Skip to Content
Stocks

The Best Companies to Own: 2024 Edition

These companies stand out from the competition and can be good choices for long-term investing.

When you buy a stock, you own a piece of the underlying business. It’s important to understand the quality of the business you own, for the same reason you would test drive a new car before buying it.

The best companies tend to exceed your expectations. They find investment opportunities that you might not have thought about, or that you wouldn't be able to pursue as an individual, increasing the intrinsic value of their business. Over time, these companies tend to be worth much more than they are today.

Long term, our analysts think having a stake in a high-quality company will put you in a far better position than chasing market movements or the brief boom of a low-quality business. With that in mind, here are a group of rock-solid companies that are truly positioned to stand the test of time.

Having a stake in a high-quality company will put you in a far better position than chasing market movements or the brief boom of a low-quality business.

What Makes a “Best Company”?

One of the keys to finding the best long-term investments is buying companies that can stay one step ahead of the competition. Legendary investor Warren Buffett originally coined the term “economic moat” to refer to a company’s ability to keep competitors at bay over time. Morningstar builds on this idea to rate companies based on their “moat,” or the strength and sustainability of their competitive edge.

We’ve compiled a list of the best companies our analysts cover that are available to U.S. investors. These companies have successfully carved out wide moats between them and their industry competitors, and we’re confident that they will produce returns that outweigh their costs for the next 20 years or more. In other words, these companies will reliably be able to produce returns for investors over a long period even as they invest in their growth. The strength of their competitive advantages is also either steady or increasing, which adds to our confidence in their long-term growth.

A company’s longevity and competitive advantage are inherently tied to sustainability, so our analysis takes environmental, social, and governance, or ESG, considerations into account. The best companies have business models that allow them to effectively navigate evolving ESG issues that could materially impact their business. Cutting corners or taking on too much risk may work in the short run, but these tactics won’t give a company enduring success.

The companies that make our list also have predictable cash flows (or predictable amounts of money going into and out of a company), so our analysts can more accurately estimate how much the businesses are worth. These companies also make smart decisions about how they manage and invest their money.

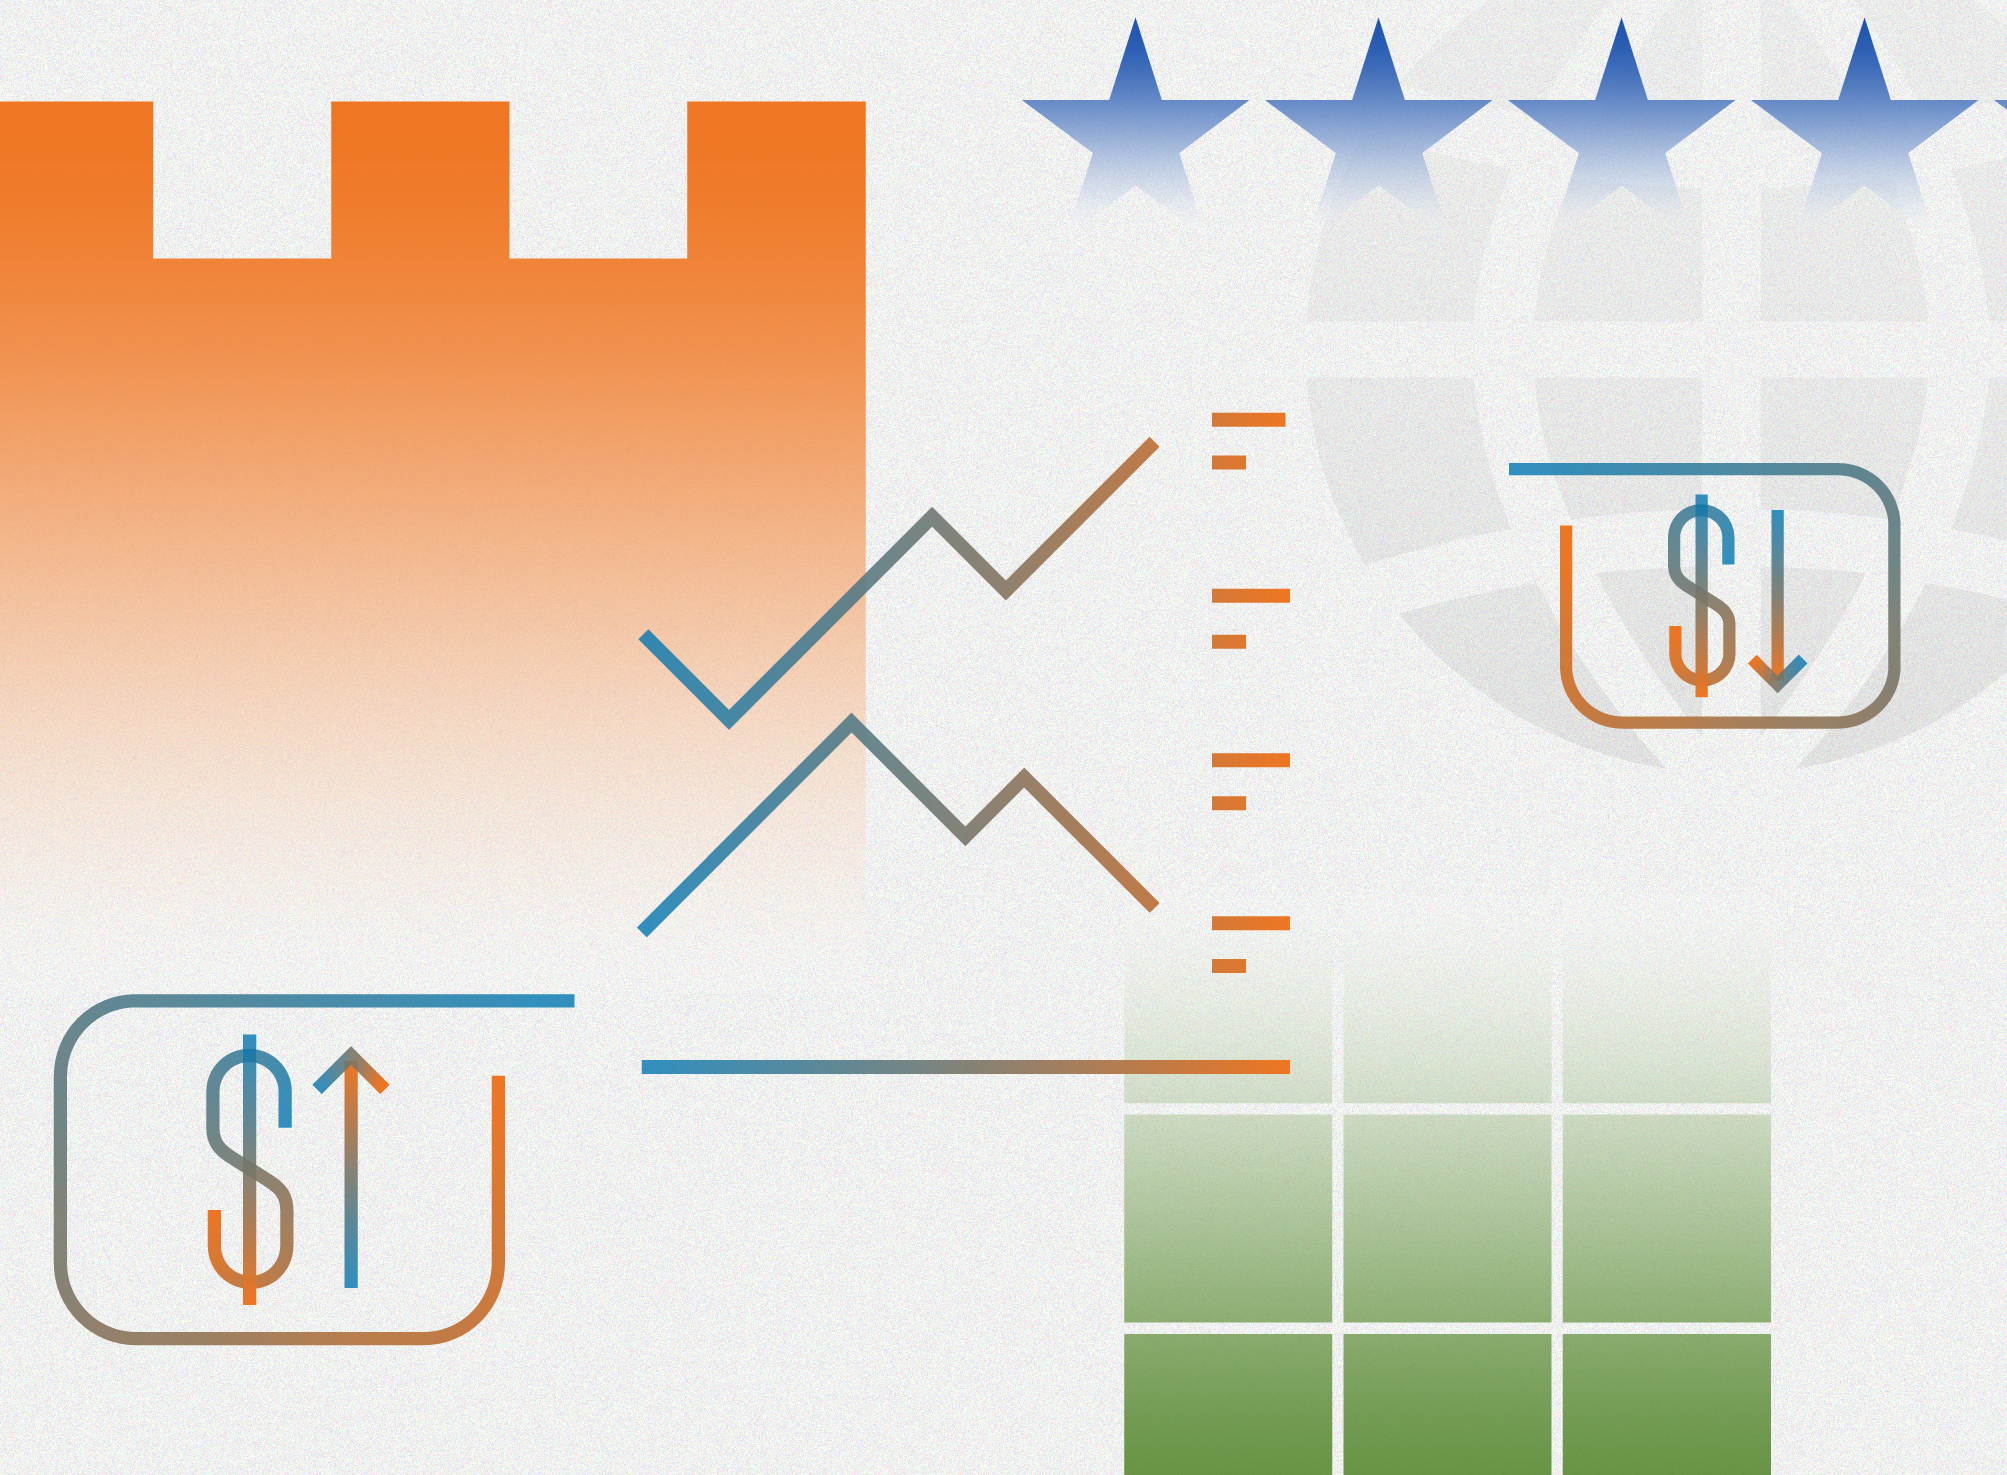
We aren’t advocating that you buy shares of every company on this list today. Even the greatest company can be a bad investment if you overpay. The share prices of many companies on this list overestimate their real value, so it may not be the right time to buy. Still, we believe these companies are essential for any stock investor’s watchlist.

We’ve grouped the companies on this list according to the overall sectors of the economy in which they compete.

Start your free 7-day trial of Morningstar Investor. Understand the difference between a good company and a great opportunity. Unlock our analysts’ fair value estimates and get continuous research and analysis to help you make the best decisions.

Note: If you’re having trouble viewing lists on this page, please try another browser.

Consumer Defensive Companies

The consumer defensive sector isn’t what it sounds like. Think brands you find in your home—companies that manufacture household and personal products, food, and beverages. It also includes discount stores.

These companies provide services that consumers always need, so changes in the economy, like downturns, generally don’t have much impact on the sector. That’s where the “defensive” of consumer defensive comes in: The sector isn’t impacted by the ups and downs of the economy. Many of the companies below have strengthened their positions by developing a strong relationship with shoppers and offering either lower prices than their competitors or a strong brand identity that justifies higher pricing.

Consumer Defensive Companies
Company Name Ticker Sector Business Country Market Cap as of
June 30, 2024 (in Mil USD)
ESG Risk Rating Assessment
Walmart Inc WMT Consumer Defensive United States 544,628.32 Medium
Procter & Gamble Co PG Consumer Defensive United States 389,233.51 Medium
Costco Wholesale Corp COST Consumer Defensive United States 376,830.34 Medium
Coca-Cola Co KO Consumer Defensive United States 274,201.36 Medium
Nestle SA NSRGY Consumer Defensive Switzerland 267,866.07 Medium
PepsiCo Inc PEP Consumer Defensive United States 226,743.45 Medium
Philip Morris International Inc PM Consumer Defensive United States 157,523.26 Medium
Unilever PLC UL Consumer Defensive United Kingdom 137,097.85 Medium
Anheuser-Busch InBev SA/NV BUD Consumer Defensive Belgium 116,155.03 Medium
Mondelez International Inc MDLZ Consumer Defensive United States 87,778.53 Medium
Colgate-Palmolive Co CL Consumer Defensive United States 79,615.61 Medium
Diageo PLC DEO Consumer Defensive United Kingdom 70,143.68 Low
British American Tobacco PLC BTI Consumer Defensive United Kingdom 68,069.91 High
Constellation Brands Inc STZ Consumer Defensive United States 47,070.07 Medium
The Estee Lauder Companies Inc EL Consumer Defensive United States 38,151.20 Medium
Reckitt Benckiser Group PLC RBGLY Consumer Defensive United Kingdom 37,816.35 Medium
The Hershey Co HSY Consumer Defensive United States 37,175.79 Medium
Sysco Corp SYY Consumer Defensive United States 35,550.97 Low
Kenvue Inc KVUE Consumer Defensive United States 34,811.33 Low
Ambev SA ABEV Consumer Defensive Brazil 32,616.42 Medium
Imperial Brands PLC IMBBY Consumer Defensive United Kingdom 21,666.08 High
Brown-Forman Corp BF.B Consumer Defensive United States 20,573.16 Medium
McCormick & Co Inc MKC Consumer Defensive United States 19,024.39 Medium
Clorox Co CLX Consumer Defensive United States 16,947.96 Medium
Coca-Cola Femsa SAB de CV KOF Consumer Defensive Mexico 16,520.94 Medium
Campbell Soup Co CPB Consumer Defensive United States 13,491.65 Medium

Financial Services Companies

The financial-services sector includes banks, asset managers, financial research and data companies, credit services, investment brokerage firms, stock exchanges, and insurance companies. Just as the services they supply differ, the companies below fend off competition in distinct ways. The most common characteristic among them is that their customers face relatively high hurdles when they want to switch service providers.

Many companies in this sector are economically sensitive with interest rates, the level of the stock market, and financial health of consumers and businesses affecting results.

Financial Services Companies
Company Name Ticker Sector Business Country Market Cap as of
June 30, 2024 (in Mil USD)
ESG Risk Rating Assessment
Berkshire Hathaway Inc BRK.B Financial Services United States 877,880.81 Medium
JPMorgan Chase & Co JPM Financial Services United States 580,823.55 Medium
Visa Inc V Financial Services United States 537,038.98 Low
Mastercard Inc MA Financial Services United States 410,109.13 Low
Bank of America Corp BAC Financial Services United States 311,016.13 Medium
Wells Fargo & Co WFC Financial Services United States 207,052.27 High
American Express Co AXP Financial Services United States 166,554.62 Low
Royal Bank of Canada RY Financial Services Canada 150,378.83 Medium
S&P Global Inc SPGI Financial Services United States 139,553.40 Low
The Toronto-Dominion Bank TD Financial Services Canada 96,528.29 Low
Intercontinental Exchange Inc ICE Financial Services United States 78,517.99 Low
Moody’s Corporation MCO Financial Services United States 76,865.76 Low
CME Group Inc CME Financial Services United States 70,767.25 Low
U.S. Bancorp USB Financial Services United States 61,950.26 Medium
Bank of New York Mellon Corp BK Financial Services United States 44,786.69 Low
Tradeweb Markets Inc TW Financial Services United States 22,588.43 Low
Northern Trust Corp NTRS Financial Services United States 17,185.70 Medium

Healthcare Companies

Healthcare is another sector that generally holds steady no matter what is happening in the economy. The healthcare sector includes companies in biotechnology, diagnostics and research, drug manufacturing, and health information services.

Many of the high-quality healthcare companies that made our list are drug manufacturers whose patent protection keeps competitors at bay.

Healthcare Companies
Company Name Ticker Sector Business Country Market Cap as of
June 30, 2024 (in Mil USD)
ESG Risk Rating Assessment
Johnson & Johnson JNJ Healthcare United States 351,760.23 Medium
Merck & Co Inc MRK Healthcare United States 313,561.42 Medium
AstraZeneca PLC AZN Healthcare United Kingdom 241,203.11 Medium
Roche Holding AG RHHBY Healthcare Switzerland 224,614.10 Medium
Novartis AG NVS Healthcare Switzerland 218,730.15 Low
Thermo Fisher Scientific Inc TMO Healthcare United States 211,089.13 Low
Pfizer Inc PFE Healthcare United States 158,551.27 Low
Stryker Corp SYK Healthcare United States 129,618.16 Medium
Sanofi SA SNY Healthcare France 120,058.48 Medium
Gilead Sciences Inc GILD Healthcare United States 85,477.99 Medium
Bristol-Myers Squibb Co BMY Healthcare United States 84,185.47 Medium
Zoetis Inc ZTS Healthcare United States 79,103.32 Low
GSK PLC GSK Healthcare United Kingdom 78,540.80 Low
Agilent Technologies Inc A Healthcare United States 37,820.96 Low
Haleon PLC HLN Healthcare United Kingdom 37,677.49 Low
Coloplast A/S CLPBY Healthcare Denmark 27,076.85 Low
West Pharmaceutical Services Inc WST Healthcare United States 23,993.81 Low
Zimmer Biomet Holdings Inc ZBH Healthcare United States 22,327.70 Medium
Waters Corp WAT Healthcare United States 17,209.83 Low

Industrial Companies

Planes, trains, and heavy machinery. Companies in the industrials sector support and transport all things industry. The sector includes companies that produce machinery, hand-held tools, and industrial products. It also includes aerospace and defense firms as well as transportation services. More companies from the industrials sector made our list than from any other group.

Many of these companies benefit from their incumbent position in their respective industries. It allows these businesses to develop brands and patents that give them their edge. Many further benefit from a cost advantage, operating in industries where infrastructure or regulation limitations make it expensive for new competitors to enter the market.

Industrial Companies
Company Name Ticker Sector Business Country Market Cap as of
June 30, 2024 (in Mil USD)
ESG Risk Rating Assessment
GE Aerospace GE Industrials United States 174,009.62 High
Caterpillar Inc CAT Industrials United States 162,903.50 Medium
Siemens AG SIEGY Industrials Germany 146,400.23 Medium
Honeywell International Inc HON Industrials United States 139,099.74 Medium
Union Pacific Corp UNP Industrials United States 138,046.23 Low
RTX Corp RTX Industrials United States 133,469.11 Medium
United Parcel Service Inc UPS Industrials United States 117,083.24 Low
Lockheed Martin Corp LMT Industrials United States 111,140.91 Medium
Airbus SE EADSY Industrials Netherlands 110,642.92 Medium
Deere & Co DE Industrials United States 102,961.34 Low
ABB Ltd ABBNY Industrials Switzerland 102,667.87 Low
Automatic Data Processing Inc ADP Industrials United States 97,693.75 Low
RELX PLC RELX Industrials United Kingdom 85,893.70 Negligible
Waste Management Inc WM Industrials United States 85,567.07 Low
General Dynamics Corp GD Industrials United States 79,604.00 High
Canadian National Railway Co CNI Industrials Canada 75,040.05 Low
Canadian Pacific Kansas City Ltd CP Industrials Canada 73,319.24 Medium
TransDigm Group Inc TDG Industrials United States 71,493.11 High
Cintas Corp CTAS Industrials United States 70,836.57 Low
CSX Corp CSX Industrials United States 65,411.86 Medium
Northrop Grumman Corp NOC Industrials United States 64,516.23 Medium
Emerson Electric Co EMR Industrials United States 63,022.54 Medium
Republic Services Inc RSG Industrials United States 61,203.97 Low
Copart Inc CPRT Industrials United States 52,127.66 Low
BAE Systems PLC BAESY Industrials United Kingdom 50,586.54 Medium
Norfolk Southern Corp NSC Industrials United States 48,501.48 Medium
Waste Connections Inc WCN Industrials Canada 45,236.48 Medium
Experian PLC EXPGY Industrials United Kingdom 42,564.87 Low
Otis Worldwide Corp OTIS Industrials United States 38,920.11 Low
Verisk Analytics Inc VRSK Industrials United States 38,459.54 Low
Fastenal Co FAST Industrials United States 35,978.88 Medium
Rockwell Automation Inc ROK Industrials United States 31,382.79 Low
Expeditors International of Washington Inc EXPD Industrials United States 17,626.87 Low
Rentokil Initial PLC RTO Industrials United Kingdom 14,786.95 Low
Masco Corp MAS Industrials United States 14,683.69 Medium
Graco Inc GGG Industrials United States 13,409.09 Medium
Allegion PLC ALLE Industrials United States 10,331.12 Low
C.H. Robinson Worldwide Inc CHRW Industrials United States 10,317.22 Low
Huntington Ingalls Industries Inc HII Industrials United States 9,713.61 High
Landstar System Inc LSTR Industrials United States 6,597.38 Low

Technology Companies

Technology is an area that is infamously ripe for disruptors, but some companies have been able to carve out pockets of stability. Companies in the technology sector are engaged in the design, development, and support of computer operating systems and applications. This sector also includes companies that make computer equipment, data storage products, networking products, semiconductors, and components.

Many of the companies that made our list are software application developers that keep their position by providing services with high switching costs. Customers find it difficult to stop using their services because it’s hard to do, expensive, or risky to make the switch.

Technology Companies
Company Name Ticker Sector Business Country Market Cap as of
June 30, 2024 (in Mil USD)
ESG Risk Rating Assessment
Microsoft Corp MSFT Technology United States 3,321,869.07 Low
Apple Inc AAPL Technology United States 3,229,664.35 Low
Taiwan Semiconductor Manufacturing Co Ltd TSM Technology Taiwan 769,948.89 Low
Broadcom Inc AVGO Technology United States 747,118.15 Low
Cisco Systems Inc CSCO Technology United States 191,408.99 Low
Accenture PLC ACN Technology United States 190,051.29 Negligible
Intuit Inc INTU Technology United States 183,687.54 Low
Texas Instruments Inc TXN Technology United States 176,979.52 Medium
ServiceNow Inc NOW Technology United States 161,567.86 Low
Analog Devices Inc ADI Technology United States 113,286.31 Low
Amphenol Corp APH Technology United States 80,925.38 Low
NXP Semiconductors NV NXPI Technology Netherlands 68,801.95 Low
Motorola Solutions Inc MSI Technology United States 64,388.15 Low
Roper Technologies Inc ROP Technology United States 60,336.72 Low
Autodesk Inc ADSK Technology United States 53,327.58 Low
Microchip Technology Inc MCHP Technology United States 49,108.96 Medium
Dassault Systemes SE DASTY Technology France 48,885.78 Low
Ansys Inc ANSS Technology United States 28,053.85 Low
Keysight Technologies Inc KEYS Technology United States 23,868.24 Negligible
Tyler Technologies Inc TYL Technology United States 21,345.66 Low
VeriSign Inc VRSN Technology United States 17,693.94 Medium
Jack Henry & Associates Inc JKHY Technology United States 12,102.86 Low
The Descartes Systems Group Inc DSGX Technology Canada 8,258.18 Low

Other Sectors

The companies below represent various sectors: basic materials, communication services, consumer cyclical, energy, and utilities. Most of these sectors, except for utilities, ebb and flow with the overall economy, so predicting companies’ cash flows is more difficult.

Many of these companies also operate in highly competitive or evolving industries where it can be hard to create a sustainable competitive advantage.

Other Sectors
Company Name Ticker Sector Business Country Market Cap as of
June 30, 2024 (in Mil USD)
ESG Risk Rating Assessment
The Home Depot Inc HD Consumer Cyclical United States 341,353.27 Low
Linde PLC LIN Basic Materials United States 210,933.51 Low
McDonald’s Corp MCD Consumer Cyclical United States 183,658.51 Medium
Comcast Corp CMCSA Communication Services United States 153,727.67 Medium
Lowe’s Companies Inc LOW Consumer Cyclical United States 125,625.88 Low
TJX Companies Inc TJX Consumer Cyclical United States 124,429.42 Low
Nike Inc NKE Consumer Cyclical United States 113,760.37 Low
Starbucks Corp SBUX Consumer Cyclical United States 88,180.70 Medium
Chipotle Mexican Grill Inc CMG Consumer Cyclical United States 86,040.38 Medium
Sherwin-Williams Co SHW Basic Materials United States 75,666.64 Medium
Ferrari NV RACE Consumer Cyclical Italy 73,608.92 Medium
Marriott International Inc MAR Consumer Cyclical United States 69,026.36 Medium
Ecolab Inc ECL Basic Materials United States 67,965.61 Medium
Enterprise Products Partners LP EPD Energy United States 62,931.76 Medium
O’Reilly Automotive Inc ORLY Consumer Cyclical United States 62,180.39 Low
Air Products & Chemicals Inc APD Basic Materials United States 57,366.04 Low
Hilton Worldwide Holdings Inc HLT Consumer Cyclical United States 54,560.05 Low
AutoZone Inc AZO Consumer Cyclical United States 50,635.16 Low
Ross Stores Inc ROST Consumer Cyclical United States 48,525.55 Low
Cheniere Energy Inc LNG Energy United States 40,020.77 Medium
Corteva Inc CTVA Basic Materials United States 37,594.89 High
Yum Brands Inc YUM Consumer Cyclical United States 37,305.00 Medium
CoStar Group Inc CSGP Real Estate United States 30,302.88 Medium
Tractor Supply Co TSCO Consumer Cyclical United States 29,108.81 Low
Cheniere Energy Partners LP CQP Energy United States 23,771.23 Medium
Rollins Inc ROL Consumer Cyclical United States 23,625.60 Low
Domino’s Pizza Inc DPZ Consumer Cyclical United States 18,009.70 Medium
InterContinental Hotels Group PLC IHG Consumer Cyclical United Kingdom 17,012.16 Low
James Hardie Industries PLC JHX Basic Materials United States 13,570.50 Medium
Yum China Holdings Inc YUMC Consumer Cyclical China 11,930.36 Low
Polaris Inc PII Consumer Cyclical United States 4,425.57 Medium

Best Companies to Own 2024: Methodology

The companies on this list are covered by Morningstar Research Services’ equity analysts and have shares available to U.S. investors. This means that Morningstar equity analysts have calculated fair value estimates for the shares of the companies that trade on U.S. exchanges. As a result, most of the companies on this list are based in the United States.

Within that coverage list, the best companies meet the following criteria:

  • Wide Economic Moat. The Morningstar Economic Moat Rating summarizes the length of a company's competitive advantages. An economic moat is really a structural feature allowing a firm to generate excess profits over a long period of time. If Morningstar Research Services believes that excess returns will persist for 20 years or more, that company earns a wide economic moat.
  • Standard or Exemplary Capital Allocation. The Stock Capital Allocation Rating is an assessment of the quality of management's capital allocation, with particular emphasis on the firm's balance sheet, investments, and shareholder distributions. Capital allocation is judged from an equity shareholder’s perspective, considering companies' investment strategy and valuation, balance sheet management, and dividend and share buyback policies on a forward-looking basis. A company can receive an exemplary, standard, or poor capital allocation rating.

What gives a company an economic moat?

Companies with moats have one or more of the following characteristics:

  • Network Effect. Lots of people are using the service, which then makes the service more valuable to the people who use it.
  • Intangible Assets. Patents, brands, regulatory licenses, and other intangible assets can prevent competitors from duplicating a company's products or allow the company to charge a significant price premium.
  • Cost Advantage. Firms with a structural cost advantage can either undercut competitors on price while earning similar margins, or they can charge market-level prices while earning relatively high margins.
  • Switching Costs. When it would be too expensive or troublesome to stop using a company's products, the company often has pricing power.
  • Efficient Scale. When a niche market is effectively served by one or a small handful of companies, there is no room or incentive for potential competitors to enter the market.
  • Low or Medium Fair Value Uncertainty. The Fair Value Uncertainty Rating represents the predictability of a company's future cash flows and, therefore, the level of certainty in the fair value estimate of that company. The uncertainty rating for a company can be low, medium, high, very high, or extreme. It captures a range of likely potential intrinsic values for a company based on the characteristics of the business underlying the stock, including such things as operating and financial leverage, sales sensitivity to the economy, product concentration, and other factors. The more predictable cash flows, the smaller the range of potential intrinsic values, the lower the uncertainty.

    To maintain analysts’ independence, Morningstar Research Services does not publicly rate its parent company of Morningstar, Inc. Therefore, Morningstar, Inc. (MORN) is not on the list of best companies available to U.S. investors.

    More About Stock Investing

    ABOUT THE AUTHOR

    Margaret Giles is an editor for Morningstar.

    CONTRIBUTORS

    Design editors: Courey Gruszauskas, Nura Husseini
    Editors: Susan Dziubinski, Emelia Fredlick, Marissa Monson

    Investment research is produced and issued by subsidiaries of Morningstar, Inc. including, but not limited to, Morningstar Research Services LLC, registered with and governed by the U.S. Securities and Exchange Commission.

    Margaret Giles does not own shares in any of the securities mentioned above. Read our editorial policy to learn more about our process.