15 min read
Anthropic IPO: Inside Morningstar’s Investment Analysis
Our take on the key questions that determine whether Anthropic will become one of the most valuable AI companies in the world.

As the Anthropic IPO takes shape and the market weighs the company’s prospects, Morningstar’s analysis boils the firm's valuation down to a central question: Can Anthropic translate its position at the forefront of AI research into a durable, highly profitable business as enterprise adoption accelerates?
Morningstar senior equity analyst Malik Ahmed Khan values Anthropic $92 per share, which puts its equity valuation at approximately $1.7 trillion—implying that Anthropic is well undervalued in its IPO range of $70-$78 per share. Khan also assigns the company a Morningstar Economic Moat Rating of Narrow and a Morningstar Uncertainty Rating of Very High.
That said, the range of potential outcomes for the firm is exceptionally wide.
In a bull-case scenario driven by rapid enterprise adoption and continued share gains, Morningstar estimates a value of $188 per share. On the other hand, a more cautious outlook marked by slower adoption and technological constraints supports a bear-case estimate of $25 per share.
This uncertainty reflects the two variables that will most influence Anthropic's long-term value: whether AI scaling laws continue to deliver meaningful model improvements and how quickly enterprises embed AI into their operations.
Here, we map out everything that’s informing our analysis of Anthropic, unpack the three fundamental questions that inform the firm's outlook, and examine potential scenarios for its future revenue stream.
Research on this page includes:
Our Anthropic Valuation: Key Takeaways
- We assign Anthropic a Morningstar Economic Moat Rating of Narrow, owing to its intangible assets and cost advantage, with switching costs and an indirect network effect flagged as emerging moat sources.
- We believe the firm’s intangible assets consist of frontier research know-how, its capability leadership in key domains including cybersecurity and coding, and the firm’s increasing ability to leverage its AI models to improve upcoming models.
- We attribute Anthropic’s cost advantage to its multi-chip hardware stack, which allows it to efficiently route AI workloads and lower its costs, its multi-year compute agreements that enable it to lower its compute costs, and its continued work on driving algorithmic improvements in its training and inference methods that let it serve models more efficiently.
- Our fair value estimate of $92 per share values Anthropic’s equity at $1.7 trillion, or about 13 times 2027 sales, on a 47% five-year revenue compound annual growth rate. Our bull and bear cases are $188 per share and $25 per share.
- In our bull case, our fair value for Anthropic is $188 per share, or roughly $3.4 trillion in equity value. Our bull case assumes five-year revenue growth north of 60% as rapid enterprise adoption and share gains against OpenAI, Google GOOGL, and open-weight providers push Anthropic’s sales to 12% of enterprise software and IT services budgets, supporting a 2027 price/sales multiple of 26 times.
- Our bear-case fair value is $25 per share, or roughly $500 billion in equity value. The bear case assumes five-year revenue growth of 22% on gradual enterprise adoption, scaling laws that stop holding, and compute capacity that fails to come online as planned, implying a 2027 price/sales multiple of 6 times.
- We assign a Very High Morningstar Uncertainty Rating. Whether scaling laws hold, and how quickly enterprises adopt AI, will drive the range of outcomes.
Has Anthropic Built an Economic Moat?
Here’s how we view the four moat sources for Anthropic:
- Intangible assets. We view Anthropic’s intangible assets (frontier research know-how, recursive model development, and safety alignment training) as its primary moat source. The firm has sustained capability leadership in key domains, especially in agentic coding and cybersecurity. This leadership has translated directly into pricing power.
- Cost advantage. We believe that Anthropic holds a structural cost advantage relative to other model providers as well as enterprises seeking to self-host open-weight models. We view this cost advantage as being driven by four main mechanisms:
- Rising training costs make it increasingly difficult for new entrants to catch up to Anthropic;
- Anthropic’s proprietary multi-chip orchestration system lowers compute costs across hardware platforms;
- Algorithmic improvements allow Anthropic to get more output from the same compute resources; and
- Anthropic’s scale enables it to secure compute infrastructure at lower prices than smaller rivals.
While we do not see switching costs as a fully formed moat source for Anthropic as of yet, we are seeing increased evidence that Anthropic is entrenching itself in enterprise workflows that are hard to replace.
We are also seeing signs of a network effect forming, as Anthropic’s growing user base generates valuable usage data that informs model improvements and first-party product development.
How Much Is Anthropic Worth?
Our fair value estimate of $92 per share for Anthropic values its equity at $1.7 trillion, implying a 2027 price/sales multiple of around 13 times.
We believe Anthropic is well positioned to increase revenue rapidly, with our base-case forecast calling for a top-line compound annual growth rate of 47% over the next five years.
We see three key drivers of this revenue growth.
- Higher spending from existing customers. We expect Anthropic to deepen its presence within current enterprise accounts as customers expand from basic chatbot use cases to AI agents embedded across business workflows. Given Claude's still-small share of overall enterprise technology spending, there is substantial room for wallet-share expansion.
- Continued customer acquisition. Despite strong penetration among large enterprises, Anthropic still has significant runway to add new customers, particularly across the portion of the Fortune 500 and broader enterprise market that remains in the early stages of AI adoption.
- Scalable distribution through cloud partners. Anthropic's partnerships with AWS and Google Cloud extend its reach through widely adopted AI platforms, allowing the company to attract new customers and expand revenue without proportionally increasing its sales footprint.
While we feel fairly confident in Anthropic’s ability to execute across these three verticals and drive sales growth, we think it is appropriate to also consider both bull and bear cases for the firm.
- Bull case: In our bull-case scenario, Anthropic achieves more than 60% annual revenue growth over the next five years, driven by rapid enterprise AI adoption and significant market-share gains against competitors such as OpenAI, Google, and open-weight model providers. This outlook assumes Anthropic captures an increasing share of enterprise software and IT spending while improving compute efficiency and monetization, resulting in an estimated equity value of just over $3 trillion, or $188 per share.
- Bear case: In our bear-case scenario, Anthropic’s revenue growth slows to 22% annually over five years as enterprise AI adoption progresses more gradually than expected. The outlook also assumes that model capabilities improve at a slower pace and compute capacity expansion faces constraints, limiting Anthropic’s ability to scale and open new markets, resulting in an estimated equity value of $500 billion, or $25 per share.
For a deeper dive into Anthropic's moat sources, download the full PDF.
Scaling Frontiers: Why We Are Optimistic on Anthropic’s Ability to Durably Grow Revenues
Since Anthropic’s release of its public S-1 in early November, investors—much like us—have been poring over each page.
The conversation around Anthropic has run off in multiple directions. Investors we speak with are worried about the firm’s governance, its compute bills, its profitability, and cash burn, among a litany of other risks and challenges.
Investors Need to Focus on What Matters
While it is important to consider all of these factors when it comes to Anthropic, we believe investors should refocus their attention on three key factors that we lay out below.
That is to say, even if you, as an investor, are aghast at Anthropic’s valuation or believe the company is worth far more than its IPO price, your conviction—or lack thereof—likely comes down to these three factors:
- Will enterprise AI adoption continue to broaden and deepen?
- Will model capabilities continue to improve such that Anthropic unlocks new markets?
- Can Anthropic capture value that its AI models create?
Our View
In short: We are optimistic about all three.
Our positive outlook on Anthropic reflects our view that the firm will continue to drive AI adoption, unlock new markets with model capability improvements, and capture part of the value its AI models create for customers. In this piece, we aim to unpack what gives us confidence in each of these areas. This positive outlook underpins our revenue forecast for Anthropic, with our model calling for revenue to scale to almost $360 billion by 2031.
Rather than presenting our analysis in isolation, we will first present the strongest bear arguments against Anthropic’s ability to execute on the adoption, capability, and value capture axes before presenting our views on each factor.
The Three Central Debates on Anthropic
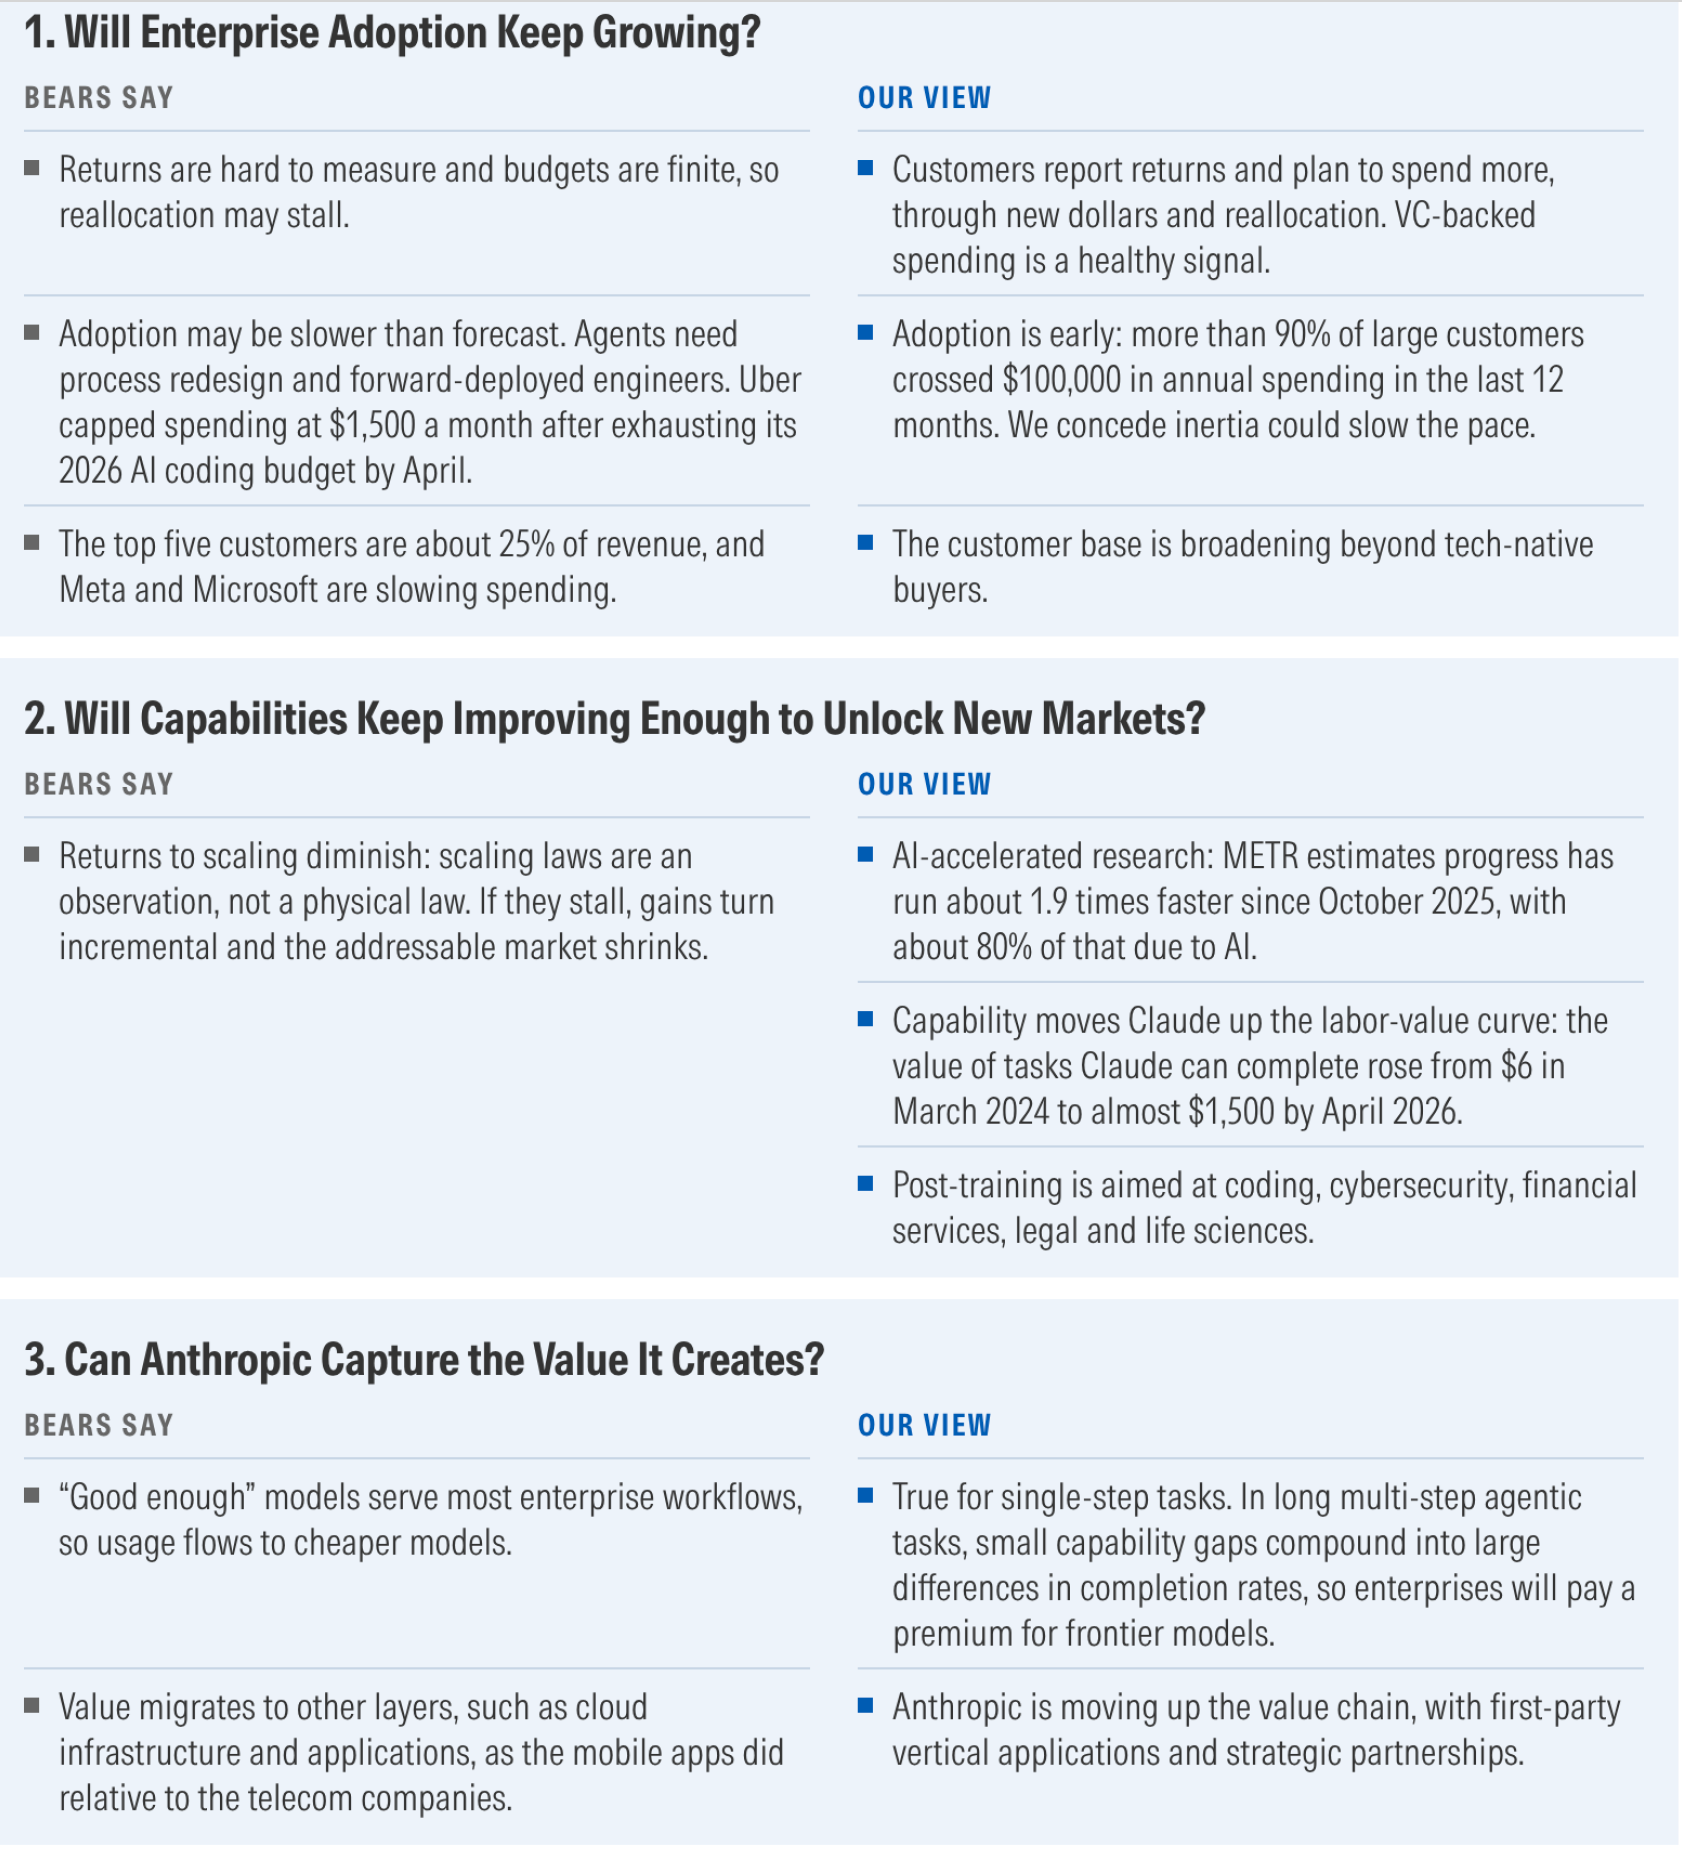
Source: Anthropic S-1, METR, Menlo Ventures, media reports, Morningstar analysis.
Anthropic Leads on Adoption, Capabilities, and Value Capture Today
Before diving into the three debates, we should first set the stage for where Anthropic is today in terms of both enterprise spending and model capabilities.
On adoption, as reflected by its massive jump in sales throughout 2026, we’d argue that the company is well positioned. The next exhibit looks at quarterly revenue, which is up more than twelvefold year over year.
The firm’s annualized run rate, which can be used as a forward-looking indicator, tells a similar story, with Anthropic’s annual recurring revenue hitting $81 billion at the end of October, up from $9 billion at the end of 2025.
Finally, we have seen Anthropic’s models gain enterprise spending, with the firm capturing 55% of enterprise AI model spending in 2026, up from 24% a couple of years ago.
So, at least for now, we can confidently argue that adoption of Anthropic’s models—with the vast majority of the firm’s sales being driven by enterprise usage—has been strong.
On the capability front, we see a similar trend, with the firm’s model capabilities continuing to expand as it maintains its status as a frontier research lab by developing and releasing leading-edge models at a regular cadence.
If we were to isolate Anthropic’s models and look at their core capability improvements, we see a similar trend. The exhibit below shows the Epoch Capabilities Index, or ECI, which measures an AI model’s capabilities across a variety of domains, and it is quite clear that Anthropic’s model capabilities have continued to advance over the past three years.
Now that we have established both strong adoption, capability improvements, and ability to capture up to now, we can turn our attention to why we think the firm will continue to execute on all three fronts.
Debate One: Will Enterprise Adoption Stay Strong?
The Bear Case
In our view, a well-articulated bear case against continued AI adoption within enterprises rests on three points: unproven returns, the pace of adoption, and customer concentration.
First, the return on AI spending remains hard to measure, and budgets are finite. Growing from $53 billion in 2026 to $358 billion in 2031 implies that Anthropic’s models drive both net new AI spending and a reallocation of existing budgets toward it. That is to say, while our forecast calls for a 47% compound annual growth rate in Anthropic’s sales, enterprise technology budgets will be growing at a low-double-digit clip over that period.
As a result, the vast majority of incremental dollars spent on Claude will be dollars reallocated from areas such as headcount, legacy software, and other services. The bears would argue that such a large reallocation is highly unlikely, especially considering the switching costs of incumbent vendors as well as internal stakeholders’ vested interests. According to the bears, the budget pressures that we’ve all heard of in 2026 are a symptom of hard-to-measure returns. Put another way, if the AI return on investment, or ROI, were clear, enterprise budget reallocations would be swift. Also, bears argue that the rapid revenue growth the model ecosystem has seen in 2026 is not durable, with much of today’s demand coming from venture-backed AI-native firms, not your everyday well-established enterprises.
Second, the bears argue that even if enterprises ultimately adopt AI at scale, the adoption ramp may be much more gradual than the one implied in many revenue forecasts, including ours. Deploying agents throughout an organization requires process redesign, change management resources, and heavy support from AI labs’ forward-deployed engineers. Bears argue that slow AI adoption could create a revenue air pocket, with Anthropic’s growing compute bill outpacing revenue growth. A prime example of this slow AI adoption is the pushback against “tokenmaxxing” and companies such as Uber capping spending at $1,500 per month after the firm exhausted its entire 2026 AI coding budget by April.
Third, Anthropic’s revenue shows clear concentration, with the top five Anthropic customers bringing in north of 20% of total revenue. Any pullback by these customers could weigh on growth. This risk, according to the bears, is already visible, with Meta META and Microsoft MSFT recently slowing down their spending on Claude.
Our View
Our confidence in Anthropic’s ability to scale its enterprise sales over the next five years is undergirded by four drivers that push back against the bear points above in turn. On returns, we believe customers are seeing returns on their investments in AI and, as a result, are planning to spend more on AI through a mix of net new dollars being spent on AI as well as a reallocation from both product and people budgets. Also, we see VC-backed companies’ high spending on AI models as a healthy signal, analogous to how VC-backed firms were high spenders on cloud computing a decade ago.
On the pace of AI adoption, adoption is still very much in its infancy, with more than 90% of Anthropic’s large customers having crossed the $100,000 annual spending mark in the past 12 months. We do concede that factors such as inertia, change management, and process redesign could temper the pace of adoption of Anthropic’s models in the enterprise.
Finally, on concentration, we see Anthropic’s customer base broadening beyond tech-native buyers. We see this as a healthy sign and further evidence that companies outside of the AI ecosystem are deriving value from the use of the firm’s models.
Debate Two: Will Capabilities Keep Improving Enough to Unlock New Markets?
The Bear Case
In our opinion, a strong bear case for model capability improvements stalling rests on one key point: the returns to scaling and building larger AI models diminish.
For context, over the past five years, model improvements have operated under a framework known as “scaling laws.” Put simply, the framework posits that an AI model’s intelligence scales predictably as you increase the volume of its training data, its post-training alignment, and the time it spends pondering over a specific problem.
We have seen these scaling laws work elegantly over the past few years, enabling models to get better and more economically useful as AI labs, such as Anthropic, worked to improve each scaling axis. We’d note, however, that the scaling laws framework is an observation, not an actual physical law, that could stop holding true at any point in the future. If scaling laws stop “working,” the bears argue, model improvements would likely become incremental, not transformational, potentially shrinking Anthropic’s total addressable market and giving competitors—especially open-weight AI model providers—the opportunity to catch up with Anthropic.
Our View: Three Compounding Advantages
While the bear argument raises a legitimate concern, we believe there is a growing body of evidence that points to the contrary, with Anthropic being able to scale its models by both improving its core training and its post-training processes. For context, the exhibit below shows the general process of building large language models.
How Large Language Models Are Built
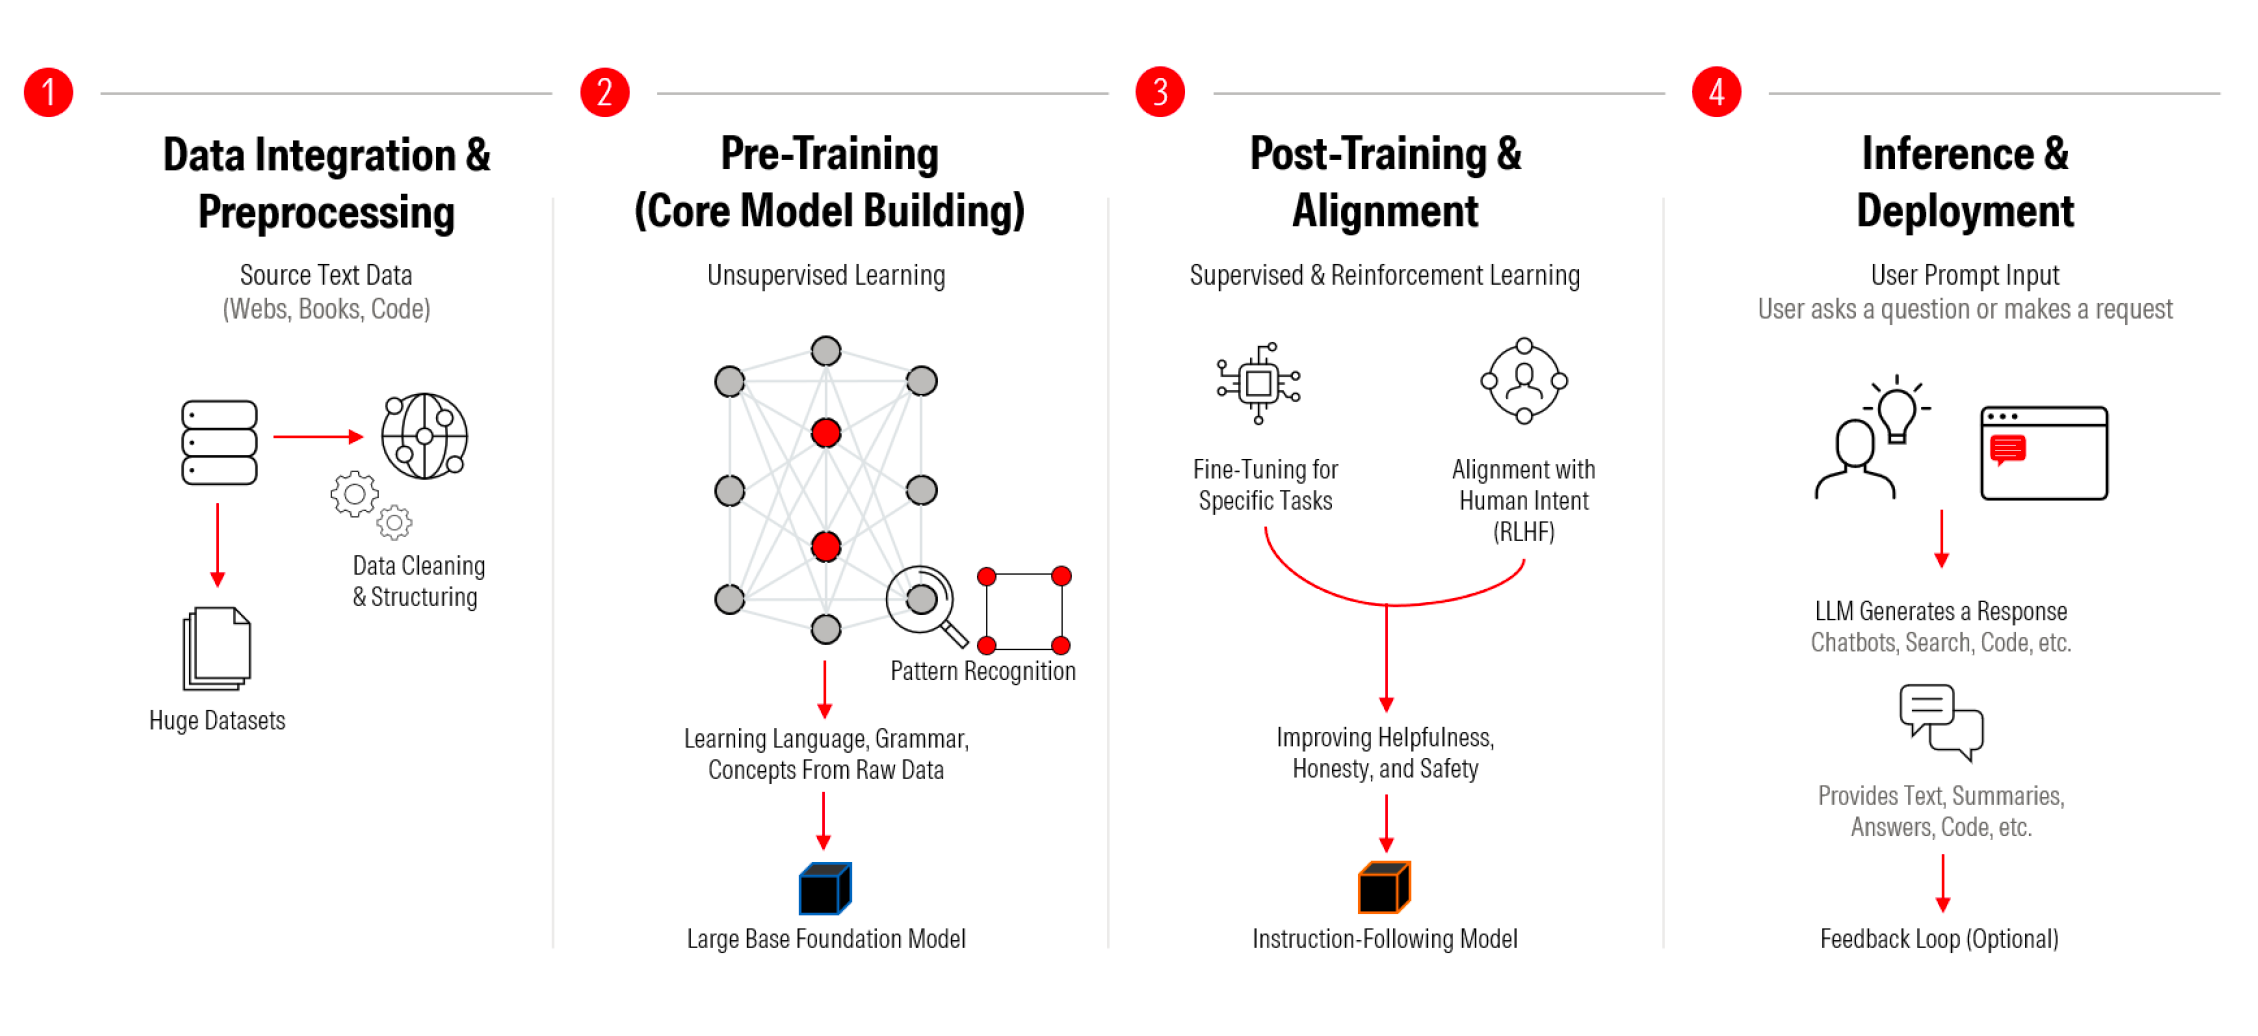
Source: Morningstar.
We see three advantages that will enable Anthropic to improve its models, thereby unlocking new capabilities and markets:
- AI is now accelerating Anthropic's own research. While bears raise concerns about model capability convergence, we would argue there is actually a legitimate runway for Anthropic’s lead in model capabilities to widen. The firm’s edge in model research is aided by recursive model development, a process in which training and testing of new models are aided by Claude, with Claude assisting in running experiments, generating and processing training data, and creating evaluations and safety audits for the upcoming models. These improvements apply to all four of the model development stages listed above.
- Capability moves Claude up the labor-value curve. We believe Anthropic’s focus on building larger models and investing resources in better training and post-training processes for its models is enabling the firm to unlock new capabilities, with these capability improvements increasingly mapping onto more complex workflows.
- Anthropic is targeting verticals where model improvements unlock more value. Finally, it is worth noting that during post-training, different research labs can help their models specialize in different areas. As a result, model capability improvements, or the returns to building more complex AI models, are interlinked with the key verticals the AI lab is targeting and how demand inflects within them.
Put together, we see plenty of evidence that Anthropic’s focus on building more complex, larger AI models will continue to drive returns for the firm. We see these improvements across all four stages of model building, showing healthy signs of continued progress.
If we were seeing the benefits of scaling and training new models run out of road, we’d expect model progress to slow and the economic value of each new model to flatten; instead, we are seeing the opposite happen.
On training, AI-driven model research is shortening the time between model generations and expanding Anthropic’s lead over competitors, especially the open-weight model labs.
On post-training, the returns to building and investing resources in larger models are showing up where they matter commercially, with Anthropic’s models increasing the dollar value of tasks Claude can complete rapidly. Also, this focus on post-training is helping the firm scale usage in key verticals such as coding, cybersecurity, financial services, legal, and life sciences, where each new capability unlocks more value.
Debate Three: Can Anthropic Capture the Value It Creates?
The Bear Case
Let’s assume a future state in which adoption stays strong and model capabilities continue to improve. Even in such a world, there is a possibility that Anthropic simply struggles to monetize its models in a way that allows its revenue to expand materially. We see this “value capture” bear thesis as built on two key points.
One, “good enough” models are good enough for most enterprise workflows. Even a cursory survey of a typical enterprise’s workflows would lead one to opine that tasks such as summarizing emails, resolving simple customer support tickets, and drafting memos do not require frontier intelligence. As a result, even if models get better, the vast majority of usage flows to cheaper models. Furthermore, since model prices tend to come down, the tasks at the frontier today will be adequately served by cheaper models of tomorrow, thereby creating a narrowing market for frontier intelligence and limiting Anthropic’s future revenue potential.
Two, value could migrate to a different part of the AI value chain. As a recent historical analogy, bears argue that despite laying the foundations of 4G and 5G, the biggest beneficiaries of improved mobile connectivity were apps like Uber UBER and TikTok, not the telecom companies that built the networks out. A similar dynamic could plausibly occur in the AI ecosystem, with AI producing a ton of value, but that value accruing to cloud infrastructure providers and/or applications and products built on top of AI models, not the model providers themselves.
The AI Value Chain
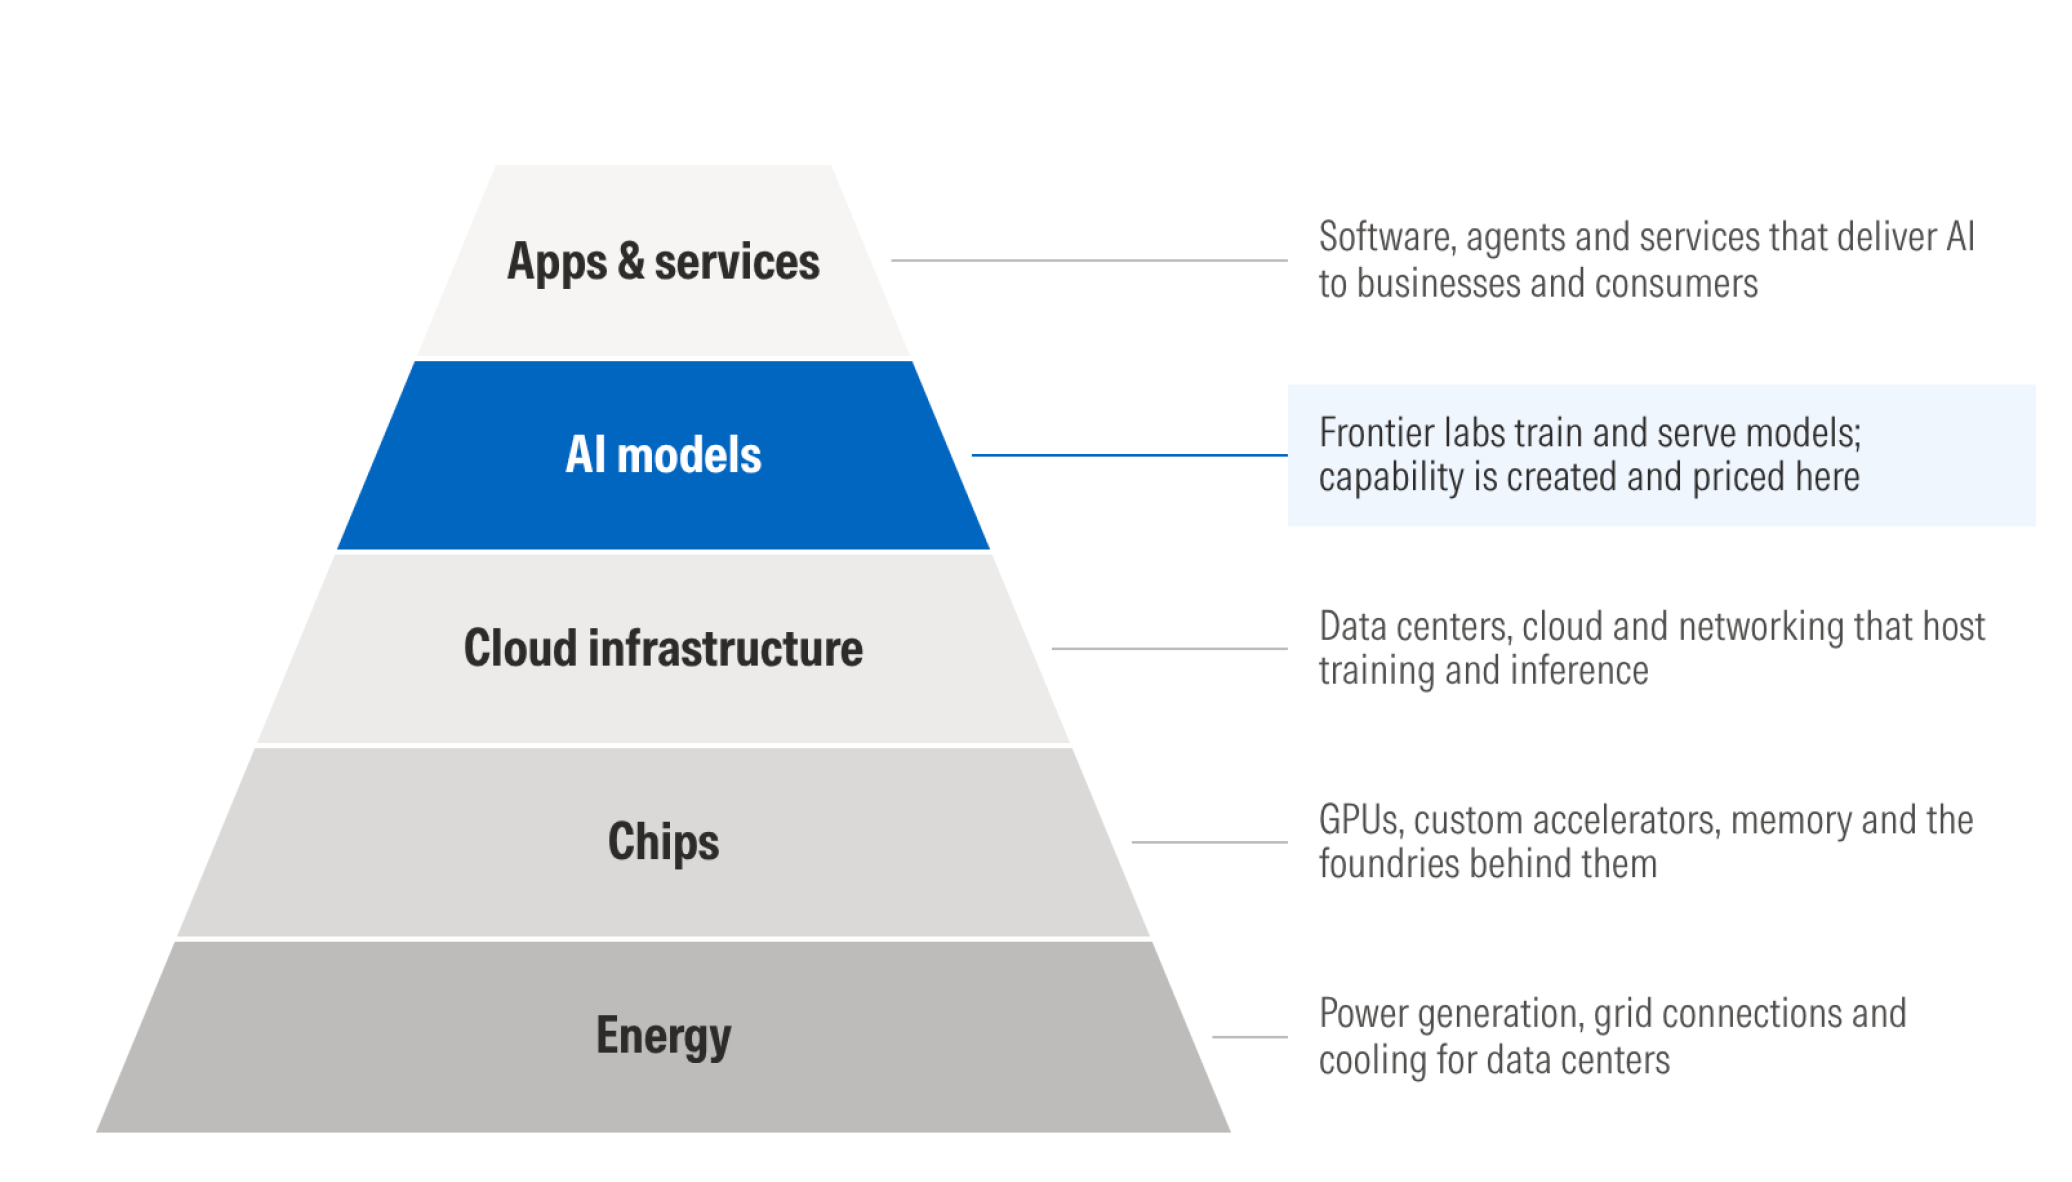
Source: Morningstar.
Our View
While we recognize the bear points on the value capture debate, we disagree with these theses for the following reasons:
To the bears’ credit, we believe the “good enough” model adoption framework is quite accurate for single-step tasks such as having a conversation with a model using a chat interface. At the same time, however, as soon as we move beyond single-step tasks and look at long-running agentic tasks, a small difference in model capability can lead to a dramatic difference in successful completion of a set task, as shown in the exhibit below.
We see this as the AI-model equivalent of the five 9's rule, where enterprises will gladly pay a premium for frontier models as they deploy increasingly complex, multistep agents.
On the value migration concern, we see clear efforts by Anthropic to move into different parts of the AI value chain, demonstrating that it recognizes this potential risk and is building toward capturing more of the total ecosystem value.
In Summation, We Think There Are Three Key Questions to Consider
To reiterate, we believe a coherent investment case for Anthropic rests on three key questions: whether enterprise adoption remains strong and continues to grow, whether model capabilities continue to improve, and whether Anthropic can capture the value its models create.
On adoption, the bears’ arguments hold water. Budgets are, indeed, finite, and large, sophisticated buyers can build their own systems or build orchestrations on cheaper alternatives to Anthropic’s models. From our vantage point, we believe adoption is still early, both in depth and breadth. Also, Anthropic’s demand is broadening beyond large tech companies, which helps with the in-house solution risk, and the 2026 budget conversations appear to be a planning lag more than a consequential budget ceiling being hit. We’d note, once again, that even within Fortune 500 customers spending more than $100,000 on Anthropic, the average company is spending less than 0.1% of its total expenses on Anthropic.
On capabilities, we believe the bears’ model-capability slowdown thesis underestimates three advantages Anthropic possesses that boost its returns on training and post-training AI models. One, AI is accelerating Anthropic’s own research, which, coupled with a clampdown on distillation, should lead to a wider gulf between the firm’s models and open-weight ones. Two, as the firm’s models improve, they unlock new capabilities that move Anthropic up the labor-value curve. Three, the firm is pointing its resources, both in training and product development, at verticals where quality matters and there is latent demand for intelligence.
On value capture, we recognize the risks posed by “good enough” models and value migration to Anthropic’s ability to capture economic value from building AI models. That said, we believe the importance of reliability in long-running, multistep agentic tasks and Anthropic’s push into other parts of the AI value chain should support its value-capture mechanism.
Together, we believe these three advantages will enable Claude to not only widen its lead over cheaper alternatives but also capture more of the value it creates.
Our views on adoption, capabilities, and value capture underpin our optimistic long-term view of Anthropic’s ability to durably grow revenue while also further strengthening its economic moat.
Get our complete analysis on these questions in the full PDF.
Research Methodology for Valuing Companies
Overview
At the heart of our valuation system is a detailed projection of a company’s future cash flows, resulting from our analysts’ research. Analysts create custom industry and company assumptions to feed income statement, balance sheet, and capital investment assumptions into our globally standardized, proprietary discounted cash flow, or DCF, modeling templates. We use scenario analysis, in-depth competitive advantage analysis, and a variety of other analytical tools to augment this process. We think analyzing valuation through discounted cash flows presents a better lens for viewing cyclical companies, high-growth firms, businesses with finite lives (mines, for example), or companies expected to generate negative earnings over the next few years. That said, we don’t dismiss multiples altogether but rather use them as supporting cross-checks for our DCF-based fair value estimates. We also acknowledge that DCF models offer their own challenges (including a potential proliferation of estimated inputs and the possibility that the method may miss short-term market-price movements), but we believe these negatives are mitigated by deep analysis and our long-term approach.
Morningstar’s Equity Research Group (“we,” “our”) believes that a company’s intrinsic worth results from the future cash flows it can generate. The Morningstar Rating for stocks identifies stocks trading at a discount or premium to their intrinsic worth—or fair value estimate in Morningstar terminology. Five-star stocks sell for the biggest risk-adjusted discount to their fair values, whereas 1-star stocks trade at premiums to their intrinsic worth.
Four key components drive the Morningstar rating:
- our assessment of the firm’s economic moat.
- our estimate of the stock’s fair value.
- our uncertainty around that fair value estimate.
- the current market price.
This process ultimately culminates in our single-point star rating.
Economic Moat
The Morningstar Economic Moat Rating is a structural feature that Morningstar believes positions a firm to earn durable excess profits over a long period of time, with excess profits defined as returns on invested capital above our estimate of a firm’s cost of capital. The economic moat rating is not an indicator of the investment performance of the investment highlighted in this report. Narrow-moat companies are those that Morningstar believes are more likely than not to achieve normalized excess returns for at least the next 10 years. Wide-moat companies are those that Morningstar believes will earn excess returns for 10 years, with excess returns more likely than not to remain for at least 20 years. Firms without a moat, including those that have a substantial threat of value destruction-related risks related to environmental, social, and governance; industry disruption; financial health; or other idiosyncratic issues, are more susceptible to competition. Morningstar has identified five sources of economic moats: intangible assets, switching costs, network effect, cost advantage, and efficient scale.
Fair Value Estimate
Each stock’s fair value is estimated by using a proprietary discounted cash flow model, which assumes that the stock’s value is equal to the total of the free cash flows of the company is expected to generate in the future, discounted back to the present at the rate commensurate with the riskiness of the cash flows. As with any DCF model, the ending value is highly sensitive to Morningstar’s projections of future growth.
Fair Value Uncertainty
The Morningstar Uncertainty Rating represents the analysts’ ability to bound the estimated value of the shares in a company around the fair value estimate, based on the characteristics of the business underlying the stock, including operating and financial leverage, sales sensitivity to the overall economy, product concentration, pricing power, exposure to material ESG risks, and other company-specific factors. Based on these factors, analysts classify the stock into one of several uncertainty levels: Low, Medium, High, Very High, or Extreme. Our recommended margin of safety—the discount to fair value demanded before we’d recommend buying or selling the stock—widens as our uncertainty of the estimated value of the equity increases.
Market Price
The market prices used in this analysis and noted in the report come from exchanges on which the stock is listed, which we believe is a reliable source.
Morningstar Rating for Stocks
The Morningstar Rating for Stocks is a forward-looking, analyst-driven measure of a stock’s current price relative to the analyst’s estimate of what the shares are worth. Stock star ratings indicate whether a stock, in the equity analyst’s educated opinion, is cheap, expensive, or fairly priced. To rate a stock, analysts estimate what they think it is worth (its “fair value”), using a detailed, long-term cash flow forecast for the company. A stock’s star rating depends on whether its current market price is above or below the fair value estimate. Those stocks trading at large discounts to their fair values receive the highest ratings (4 or 5 stars). Stocks trading at large premiums to their fair values receive lower ratings (1 or 2 stars). A 3-star rating means the current stock price is close to the analyst’s fair value estimate.
Risk Warning
Please note that investments in securities are subject to market and other risks, and there is no assurance or guarantee that the intended investment objectives will be achieved. Past performance of a security may or may not continue in the future and is no indication of future performance. A security investment’s return and an investor’s principal value will fluctuate so that, when redeemed, an investor’s shares may be worth more or less than their original cost.
A security’s current investment performance may be lower or higher than the investment performance noted within the report. Morningstar’s Uncertainty Rating is a useful data point with respect to sensitivity analysis of the assumptions used in our determining a fair value price.
General Disclosure
“Morningstar” is used throughout this section to refer to Morningstar, Inc., and/or its affiliates, as applicable. Unless otherwise provided in a separate agreement, recipients of this report may only use it in the country in which the Morningstar distributor is based. Unless stated otherwise, the original distributor of the report is Morningstar Research Services LLC, a USA-domiciled financial institution.
This report is for informational purposes only, should not be the sole piece of information used in making an investment decision, and has no regard to the specific investment objectives, financial situation, or particular needs of any specific recipient. This publication is intended to provide information to assist investors in making their own investment decisions, not to provide investment advice to any specific investor. Therefore, investments discussed and recommendations made herein may not be suitable for all investors; recipients must exercise their own independent judgment as to the suitability of such investments and recommendations in the light of their own investment objectives, experience, taxation status, and financial position.
The information, data, analyses, and opinions presented herein are not warranted to be accurate, correct, complete, or timely. Unless otherwise provided in a separate agreement, neither Morningstar, Inc., nor the Research Group represents that the report contents meet all of the presentation and/or disclosure standards applicable in the jurisdiction the recipient is located.
Except as otherwise required by law or provided for in a separate agreement, the analyst, Morningstar, Inc., and the Research Group and their officers, directors, and employees shall not be responsible or liable for any trading decisions, damages, or other losses resulting from, or related to, the information, data, analyses, or opinions within the report. The Research Group encourages recipients of this report to read all relevant issue documents—a prospectus, for example—pertaining to the security concerned, including without limitation, information relevant to its investment objectives, risks, and costs before making an investment decision and, when deemed necessary, to seek the advice of a legal, tax, and/or accounting professional.
The report and its contents are not directed to, or intended for distribution to or use by, any person or entity who is a citizen or resident of or located in any locality, state, country, or other jurisdiction where such distribution, publication, availability, or use would be contrary to law or regulation or that would subject Morningstar, Inc., or its affiliates to any registration or licensing requirements in such jurisdiction.
Where this report is made available in a language other than English and in the case of inconsistencies between the English and translated versions of the report, the English version will control and supersede any ambiguities associated with any part or section of a report that has been issued in a foreign language. Neither the analyst, Morningstar, Inc., nor the Research Group guarantees the accuracy of the translations.
This report may be distributed in certain localities, countries, and/or jurisdictions (“territories”) by independent third parties or independent intermediaries and/or distributors (“distributors”). Such distributors are not acting as agents or representatives of the analyst, Morningstar, Inc., or the Research Group. In territories where a distributor distributes our report, the distributor is solely responsible for complying with all applicable regulations, laws, rules, circulars, codes, and guidelines established by local and/or regional regulatory bodies, including laws in connection with the distribution of third-party research reports.
Risk Warning
Please note that investments in securities are subject to market and other risks and there is no assurance or guarantee that the intended investment objectives will be achieved. Past performance of a security may or may not be sustained in future and is no indication of future performance. A security investment return and an investor's principal value will fluctuate so that, when redeemed, an investor's shares may be worth more or less than their original cost.
A security's current investment performance may be lower or higher than the investment performance noted within the report. Morningstar's Uncertainty Rating serves as a useful data point with respect to sensitivity analysis of the assumptions used in our determining a fair value price.
Conflicts of Interest
No material interests are held by the analyst or their immediate family with respect to the securities subject of this investment research report.
In general, Morningstar will not hold a material interest in the security subject of this report. If a material interest is held by Morningstar, or if Morningstar owns a net long or short position in the security that is the subject of this report that exceeds 0.5% of the total issued share capital of the security, it will be disclosed at https://www.morningstar.com/company/disclosures/holdings.
Morningstar employees’ compensation is derived from Morningstar, Inc.’s overall earnings and consists of salary, bonus, and in some cases, restricted stock. Morningstar’s overall earnings are generated in part by the activities of the Investment Management and Research groups, and other affiliates, that provide services to product issuers.
Neither Morningstar, Inc., nor its analysts receive commissions, compensation, or other material benefits from product issuers or third parties in connection with this report.
Morningstar's overall earnings are generated in part by the activities of the Investment Management and Research groups, and other affiliates, who provide services to product issuers. Morningstar does not receive commissions for providing research and does not charge issuers to be rated.
Morningstar employees may not pursue business or employment opportunities outside Morningstar within the investment industry (including, but not limited to, working as a financial planner, an investment professional or investment professional representative, a broker/dealer or broker/dealer agent, a financial writer, reporter, or analyst) without the approval of Morningstar’s Legal and, if applicable, Compliance teams.
Certain managed investments use an index created by and licensed from Morningstar, Inc. as their tracking index. We mitigate any actual or potential conflicts of interest resulting from that by not producing qualitative analysis on any such managed investment as well as imposing information barriers (both technology and no-technology) where appropriate and monitoring by the compliance department.
Neither Morningstar, Inc., nor the Research Group is a market maker or a liquidity provider of the securities noted within this report.
Neither Morningstar, Inc., nor the Research Group has been a lead manager or co-lead manager over the previous 12 months of any publicly disclosed offer of financial instruments of the issuer.
Morningstar, Inc.’s Investment Management group has arrangements with financial institutions to provide portfolio management/investment advice, some of which an analyst may issue investment research reports on. In addition, the Investment Management group creates and maintains model portfolios whose underlying holdings can include financial products, including securities that may be the subject of this report. However, analysts do not have authority over Morningstar’s Investment Management group’s business arrangements or allow employees from the Investment Management group to participate or influence the analysis or opinion prepared by them.
Morningstar, Inc., is a publicly traded company (ticker: MORN) and thus a financial institution the security of which is the subject of this report may own more than 5% of Morningstar, Inc.’s total outstanding shares. Please access Morningstar, Inc.’s proxy statement, section “Security Ownership of Certain Beneficial Owners and Management,” at https://shareholders.morningstar.com/investor-relations/financials/sec-filings/default.aspx. A security's holding of Morningstar stock has no bearing on and is not a requirement for which securities Morningstar determines to cover.
Morningstar, Inc. may provide the product issuer or its related entities with services or products for a fee and on an arm’s-length basis, including software products and licenses, research and consulting services, data services, licenses to republish our ratings and research in their promotional material, event sponsorship, and website advertising.
Further information on Morningstar’s conflict-of-interest policies is available at http://global.morningstar.com/equitydisclosures. Please note that analysts are subject to the CFA Institute’s Code of Ethics and Standards of Professional Conduct.
For a list of securities the Research Group currently covers and provides written analysis on, or for historical analysis of covered securities, including fair value estimates, please contact your local Morningstar office. Morningstar Research methodologies can be found at Investor Relations | Morningstar, Inc.
For current Morningstar clients, please reach out to your respective Client Success Manager for more information on how you can best leverage this research within your firm. For all others, please reach out to our business development team at dtainsidesales@morningstar.com to learn more about Morningstar’s various offerings and more details about how you can leverage this research.
For recipients in Australia: This report has been issued and distributed in Australia by Morningstar Australasia Pty. Ltd. (ABN: 95 090 665 544; AFSL: 240892). Morningstar Australasia Pty. Ltd. is the provider of the general advice (“the service”) and takes responsibility for the production of this report. The service is provided through the research of investment products. To the extent the report contains general advice, it has been prepared without reference to an investor’s objectives, financial situation, or needs. Investors should consider the advice in light of these matters and, if applicable, the relevant Product Disclosure Statement before making any decision to invest. Refer to our Financial Services Guide for more information at http://www.morningstar.com.au/s/fsg.pdf.
For recipients in New Zealand: This report has been issued and distributed by Morningstar Australasia Pty Ltd and/or Morningstar Research Ltd (together “Morningstar”). This report has been prepared and is intended for distribution in New Zealand to wholesale clients only and has not been prepared for use by New Zealand retail clients (as those terms are defined in the Financial Markets Conduct Act 2013).
The information, views, and any recommendations in this material are provided for general information purposes only, and solely relate to the companies and investment opportunities specified within. Our reports do not take into account any particular investor’s financial situation, objectives, or appetite for risk, meaning no representation may be implied as to the suitability of any financial product mentioned for any particular investor. We recommend seeking financial advice before making any investment decision.
For recipients in Canada: This research is not prepared subject to Canadian disclosure requirements.
For recipients in Europe: This report is distributed by Morningstar Holland B.V., a wholly owned subsidiary of Morningstar, Inc. Morningstar Holland B.V. is not required to be regulated by the European Securities and Markets Authority for the provision of investment research data. The analyst/s involved in the creation of the report do not take into account any particular investor’s financial situation, objectives, or appetite for risk, meaning no representation may be implied as to the suitability of any financial product mentioned for any particular investor. Registered address: Haaksbergweg 58, 9th Floor, 1101 BZ Amsterdam, North Holland, Netherlands.
For recipients in India: This report is issued by Morningstar Investment Research India Private Limited (formerly known as Morningstar Investment Adviser India Private Limited). Morningstar Investment Research India Private Limited is registered with SEBI as an Investment Adviser (Registration number INA000001357), as a Portfolio Manager (Registration number INP000006156) and as a Research Entity (Registration Number INH000008686). Morningstar Investment Research India Private Limited has not been the subject of any disciplinary action by SEBI or any other legal/regulatory body. Morningstar Investment Research India Private Limited is a wholly owned subsidiary of Morningstar Investment Management LLC. In India, Morningstar Investment Research India Private Limited has one associate, Morningstar India Private Limited, which provides data-related services, financial data analysis, and software development. The Research Analyst has not served as an officer, director, or employee of the fund company within the last 12 months, nor has it or its associates engaged in market-making activity for the fund company.
For recipients in Hong Kong: The report is distributed by Morningstar Investment Management Asia Limited, which is regulated by the Hong Kong Securities and Futures Commission to provide investment research and investment advisory services to professional investors only. Neither Morningstar Investment Management Asia Limited nor its representatives are acting or will be deemed to be acting as an investment advisor to any recipients of this information unless expressly agreed to by Morningstar Investment Management Asia Limited.
For recipients in Japan: This report is distributed by Morningstar Japan, Inc. for informational purposes only. Neither Morningstar Japan, Inc. nor its representatives are acting or will be deemed to be acting as an investment advisor to any recipients of this information.
For recipients in Korea: The report is distributed by Morningstar Korea Ltd., which has filed with the Financial Supervisory Service, for informational purposes only. Neither Morningstar Korea Ltd. nor its representatives are acting or will be deemed to be acting as an investment advisor to any recipients of this information.
For recipients in Singapore: This report is distributed by Morningstar Investment Adviser Singapore Pte Limited, which is licensed and regulated by the Monetary Authority of Singapore to provide financial advisory services in Singapore. Recipients of this report should contact their financial advisor in Singapore in relation to this report. Morningstar, Inc., and its affiliates rely on certain exemptions (Financial Advisers Regulations, Section 27(1)(e), Section 32, Band 32C) to provide its investment research to recipients in Singapore.
For recipients in the United Kingdom: This report is distributed by Morningstar UK Ltd, a wholly owned subsidiary of Morningstar, Inc. Morningstar UK Ltd. is not required to be registered nor authorized by the Financial Conduct Authority for the distribution of investment research data. The analyst/s involved in the creation of the report do not take into account any particular investor’s financial situation, objectives, or appetite for risk, meaning no representation may be implied as to the suitability of any financial product mentioned for any particular investor. There are information barriers in place between Morningstar UK Ltd and Morningstar regulated entities based in the UK. Registered address: 1 Oliver’s Yard, 55-71 City Road, London EC1Y 1HQ.
About Morningstar® Equity Research
Morningstar Equity Research provides independent, fundamental equity research differentiated by a consistent focus on durable competitive advantages, or economic moats.
For More Information
+1 312 696-6000
equitysupport@morningstar.com