6 min read
Brexit’s Market Legacy: Lost Confidence, New Opportunities
Assessing a decade of market disruption and what comes next.

Key Takeaways
- Brexit accelerated existing trends: Structural weaknesses were already in place—Brexit amplified them, raising the UK’s perceived risk premium and weakening investor confidence.
- Confidence hasn’t recovered: Persistent outflows, shrinking benchmark weight, and widespread fund closures point to a lasting shift rather than a short-term drawdown.
- The story is still evolving: Since 2022, UK equities have outperformed global peers, driven by a strong value rotation and resilient dividends.
When Capital Loses Confidence
A decade of headwinds and capital flight following Brexit.
Fund flows
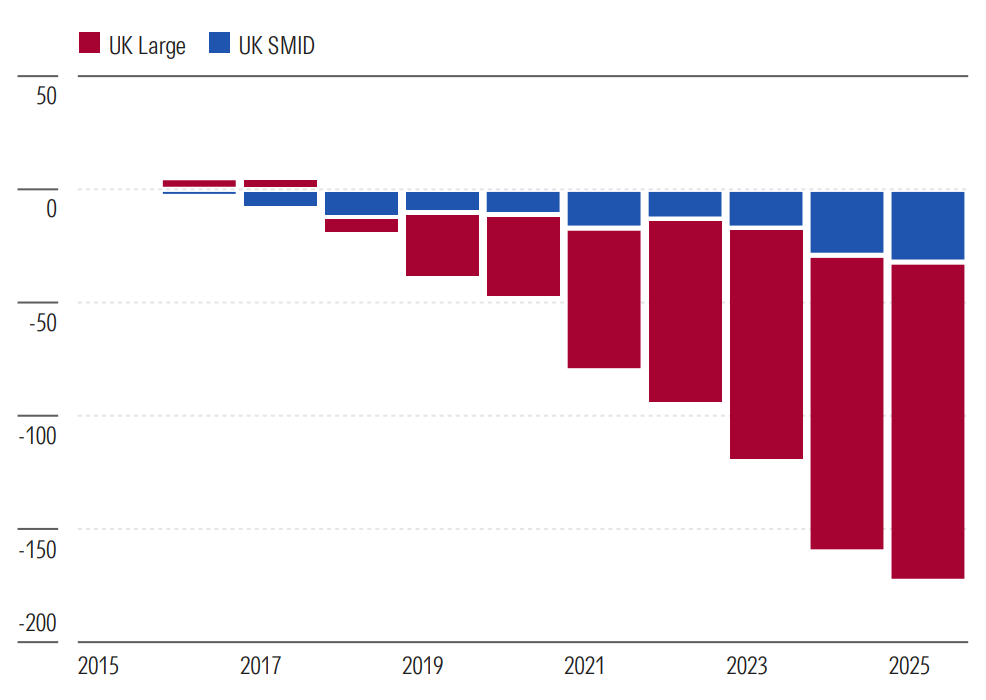
Investor behavior has been decisive, even when the politics weren’t. Since the UK formally exited the EU in 2020, UK equity funds have seen six consecutive years of net outflows, totaling more than USD 160 billion.
Whether this represents a structural loss of confidence or a market that investors no longer consider relevant, the scale and consistency of the outflows speak for themselves.
UK Equity Cumulative Estimated Net Flows
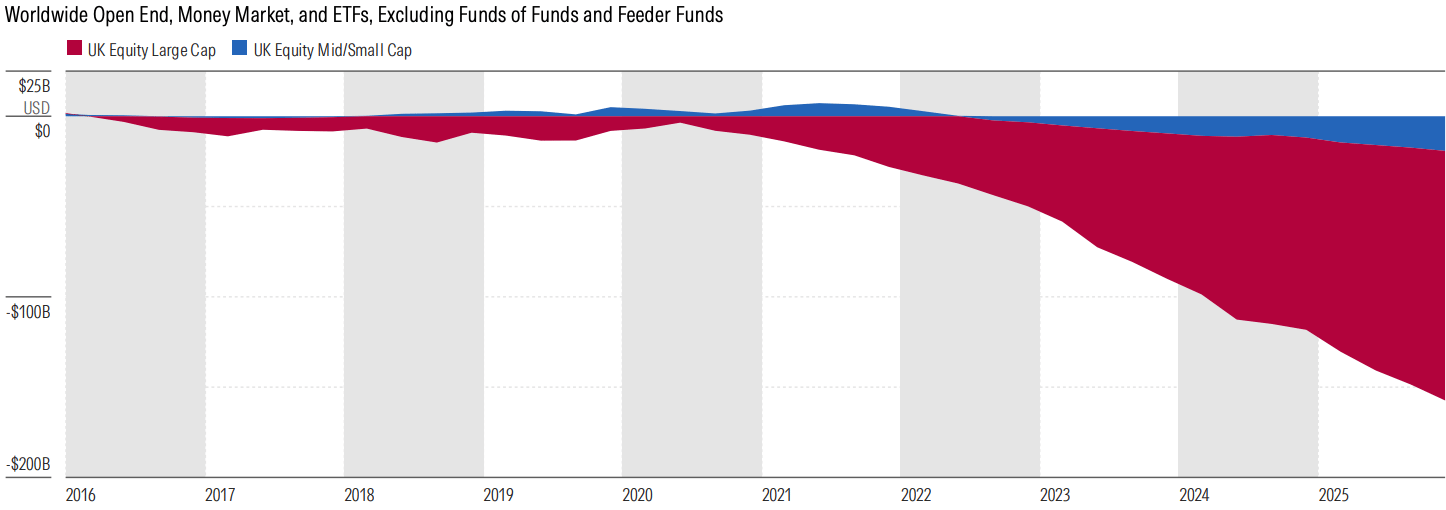
Source: Morningstar Direct. Data as of Dec. 31, 2025.
From home bias to home blindness
UK investors have historically exhibited a home bias, overweighting domestic equities relative to their global benchmark share. That preference has not merely faded—it has collapsed to the point of near home blindness.
In the most aggressive GBP allocation Morningstar Category, average UK equity weights have fallen from 40% to 18%. The capital that is left has not sat idle—it has been systematically redeployed into US equities, which now dominate multi-asset portfolios to a degree that would have seemed extraordinary a decade ago.
The UK's diminishing footprint in global benchmarks tells the same story. From nearly 10% of the MSCI ACWI 20 years ago, the UK now represents just 4%—a halving of its global weight that has mechanically forced index-tracking allocations lower still. For passive investors, this is not a discretionary choice but an automatic consequence of benchmark drift.
Fund closures signal structural pressure
Persistent outflows and shrinking allocations have had a profound impact on UK-focused asset managers. Since 2016, around 380 UK equity strategies have closed, against just over 200 launches.
Each closure is a commercial verdict. It signals that the economics of running an active UK equity strategy—already under pressure from fee compression and passive competition—have become increasingly difficult to justify.
Cumulative Closures
Source: Morningstar Direct. Data as of Dec. 31, 2025.
The winners and losers
Outflows haven’t been evenly distributed. Since 2016, outflows have primarily come from large-cap, active managers. Among the hardest hit were Columbia Threadneedle, Jupiter, Liontrust, Aviva, and Schroders.
The winners tell the opposite story. The largest inflows across UK equity strategies have flowed almost exclusively to passive providers, notably iShares and Vanguard. The proportion of total index money has risen from 22% to 46% since 2016.
Economic impact
The macro environment has been challenging following Brexit, and worsened by economic shocks from covid-19, inflation, and wars. Foreign direct investment inflows have been falling since 2016, with annual new projects almost halving between 2016 and 2025. Multinational companies have relocated operations to the EU to preserve access to the single market, reducing long-term domestic investment and innovation potential. We have seen weakness in goods exports, reflecting trade frictions but also weaker trading relationships.
Cheap for a Reason?
The UK faced substantial headwinds, but more recently, they have eased.
A structural growth gap
UK equities faced significant headwinds over the 2010s, and performance dragged considerably versus US and global indexes, with sector composition going a long way to explaining the divergence.
More growth-oriented industries, such as technology, communications services, and internet retail, benefited not only from the ultralow interest rate environment but also from growth drivers in the mass proliferation of smartphones and the internet.
For instance, from 2010 to 2025, the technology sector alone contributed 50% of total return in the US index, but just 2% in the UK. By contrast, the UK market has been heavily tilted toward “old economy” sectors— energy, financials, materials, and defensives—which faced persistent headwinds:
- A growth-led regime: Prolonged low rates favored long-duration growth assets over cash-generative but lower-growth sectors.
- Commodity bear super cycle: Oil and gas, and metals and mining delivered volatile, and often flat, real returns over the period.
- Limited exposure to platform economics: The absence of large-scale tech platforms meant the UK missed the outsized winner-takes-most dynamics seen in the US.
As a result, UK equities were structurally underexposed to the dominant drivers of global equity returns during the 2010s, amplifying the performance gap despite broadly similar global economic conditions.
A renaissance in sector performance
Since 2022, we have seen a notable rotation, with many sectors well represented in the UK index delivering significantly stronger performance. For the five years ending February 2026, the UK market has outperformed both the US and global indexes in both sterling and US dollar terms, benefiting from a shift in macro conditions that turned headwinds into tailwinds.
Key drivers:
- Rotation from growth to value
- Strength in commodities and energy
- Improved bank profitability
- Resilient dividend profile
- Low starting valuations
UK equity market is less driven by multiple expansion
Over the long term, we can see that total returns in the UK equity market have been driven mostly by dividends, and then earnings growth, with multiple expansion playing a much smaller and more inconsistent role.
This contrasts with the S&P 493 (S&P 500 excluding the Magnificent Seven: Alphabet GOOGL, Amazon.com AMZN, Apple AAPL, Meta Platforms META, Microsoft MSFT, Nvidia NVDA, and Tesla TSLA), where multiple expansion has been a much larger contributor to total returns over the 2010s cycle, albeit considerably driven by earnings growth within the Magnificent Seven.
Large caps lead, small caps lag
While value has outperformed growth over this period, the most striking divergence has been between large-cap and small and mid-cap equities. As shown in the exhibit, over the past five years, small and mid-caps have continued to lag significantly, delivering little to no total return while UK large-caps performed strongly.
5-Year Performance (GBP)

Source: Morningstar Direct. Data as of March 31, 2026.
This divergence reflects several structural and cyclical factors, namely:
- Preference for scale and global exposure
- Domestic economic sensitivity
- Continued valuation pressure
The Valuation Opportunity
UK small caps warrant attention
Despite recent outperformance, the valuation opportunity in UK equities remains compelling. Both on trailing and forward P/E ratios, the UK trades at a 30% (trailing) and 35% (forward) discount to the US, both substantially less than the long-term average.
While this has come in from a discount of 40% to 50%, and is somewhat driven by sector composition, the market remains cheap relative to US equities, particularly in small caps, which are cheap to both their own history and equivalent companies in other developed markets.
M&A activity signals value
Perhaps the most telling validation of the valuation case has come not from analysts or fund managers, but from corporate boardrooms. The past three years have seen a sustained wave of overseas acquirers—predominantly from the US and Europe—targeting UK-listed companies at premiums that public market investors have been unwilling to pay.
When a strategic buyer is prepared to pay 30%, 40%, or 50% above the prevailing share price to take a company private, they are making an explicit statement about where intrinsic value lies.
The pace of deal activity shows no sign of slowing in 2026, with several high-profile takeover bids already made. Perhaps most striking is Schroders, where a GBP 9.9 billion bid from a US acquirer would bring the curtain down on more than 200 years of independent, family steered ownership—a reminder that no UK-listed business, however storied, is beyond the reach of overseas capital.
Share buybacks on the rise
Attractive valuations haven’t gone unnoticed, with UK boards buying back shares at record levels in recent years. The buyback yield for the Morningstar UK index has been at elevated levels since late 2022. The last time we observed these levels was around the global financial crisis.
It’s not only the size of these buybacks, but also the number of companies involved. Dividends have been a common feature of the market for decades, with the UK seen as a hunting ground for many income investors. However, in percentage terms, the number of companies buying back shares has been the highest since our data began in 2004.
A Category Overview of UK Equities
A concentrated market
Compared with other developed markets, the UK has consistently been very concentrated, with the top 10 making up 40% to 50% throughout. A lot of the largest names are dominant multinationals in industries with global cyclical growth drivers as opposed to domestically oriented structural ones, such as consumer durables, oil and gas, mining, and banks, which has led to a bifurcation of UK listings, where large caps are split between globally dominant multinationals and historically underdeveloped domestic growth names.
Percentage in Top 10 Holdings

Source: Morningstar Direct. Data as of March 31, 2026.
Does it pay to be active?
UK active equity managers have navigated a grueling backdrop since the referendum. Against this, it is perhaps unsurprising that success rates have trended downward across the EAA Fund categories. SMID-cap stocks have underperformed large caps, which typically correlates with poor success ratios in the UK, and the concentration of returns at the top end has been significant.
Should we see the conditions for active management improving markedly, combined with attractive valuations, active UK equities could well come into their own.
The Next Decade: Reset or Repeat?
A shrinking universe
One of the defining challenges for UK equities over the next decade will be the ability to attract and retain listed companies. Elevated M&A activity and a weak IPO pipeline have caused the number of listings to decline by 27% since the end of 2015. The pull of alternative venues is significant. Boards increasingly favor exchanges where valuations are better reflected, with many opting for the US, where liquidity is deeper and valuations richer. How policymakers respond will be critical in determining whether London can reclaim its position as a leading global listing venue.
AIMageddon
The Alternative Investment Market, or AIM, faces a growing structural challenge. The continued erosion of its listed company base—driven by departures to the Main Market, a dry IPO pipeline, and shifting incentives—raises genuine questions about the market’s long-term relevance as a home for growth companies.
- Listings fell from 1,347 (2007) to 524 (2026)
- Just 14 new listings in 2025
Compounding this, AIM has historically attracted investors through its IHT relief benefits. The 2024 Budget announcement slashed relief from 100% to 50% from April 2026, removing a key incentive, with many investors having participated in the market primarily for its tax efficiency.
Yet, reasons for optimism exist. The London Stock Exchange has announced a series of rule changes designed to reduce the regulatory burden and reinforce AIM’s appeal to growth companies. Whether these prove sufficient to reverse the structural decline remains to be seen.
What Could Go Right
Stabilizing politics
- Potential for improved UK–EU relations eases trade frictions and supports business confidence.
- Meanwhile, a more predictable fiscal and regulatory environment encourages domestic and foreign investment.
Rate cuts
- Rates may have peaked, albeit inflation is likely to be somewhat structurally sticky given geopolitical tensions and food and energy supply chain issues.
- If we do see rate cuts, lower discount rates will support equity valuations, particularly for domestic and mid-cap stocks. Lower mortgage rates also drive domestic consumption.
Valuation re-rating
- UK equities trade at a persistent discount to global peers (US/Europe) and are sustained by capital outflows and poor sentiment. If we see a turnaround driven by earnings resilience and strong performance, the valuation will act as a catalyst for equity returns.
- Meanwhile, increased M&A activity provides a valuation floor.
Active managers performing
- UK market structure (high valuation dispersion, sector concentration, and under-researched mid- and small caps) is conducive to alpha generation, and particularly down the market cap spectrum, the penetration of passives is lower.
- Potential shift back toward active strategies if performance improves relative to passive, and the environment favors stock pickers.
Changes to listing rules and market reforms
- Reforms to the UK listing regime (such as dual-class shares and streamlined requirements) improve competitiveness versus US exchanges.
- Pension fund reforms could increase domestic equity allocations.
- Finally, an enhanced capital markets ecosystem supports IPO activity and can retain high-growth companies.


