
ETFs Cap Off Another Year of Inflows in Style
Investors piled $598 billion into U.S. ETFs in 2023, including $263 billion in the fourth quarter.
/s3.amazonaws.com/arc-authors/morningstar/30e2fda6-bf21-4e54-9e50-831a2bcccd80.jpg)
Key Takeaways
- Positive sentiment from the Federal Reserve powered the Morningstar Global 60/40 Index to a 4.7% return in December 2023. The index finished the year 14.8% higher than where it started.
- Exchange-traded funds’ $598 billion haul for the year fell well short of their 2021 record as money market funds offered renewed competition for investor assets.
- Stock ETFs led all broad category groups with $384 billion of inflows in 2023, but bond ETFs grew at a faster rate.
- Investors opted for growth-stock funds over value strategies and faster-growing sector portfolios over cheaper ones.
- Covered-call strategies powered the nontraditional-equity cohort to another sparkling year; defined-outcome ETFs brought solid inflows into alternatives.
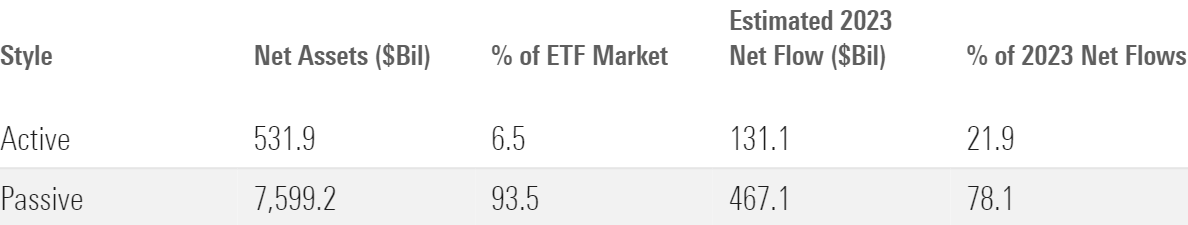
- Active ETFs represented 5.3% of the ETF market entering 2023 but claimed 21.9% of overall flows for the year.
- Vanguard reeled in $159 billion, leading all ETF providers for the fourth consecutive year.
Bonds Make a Late Push
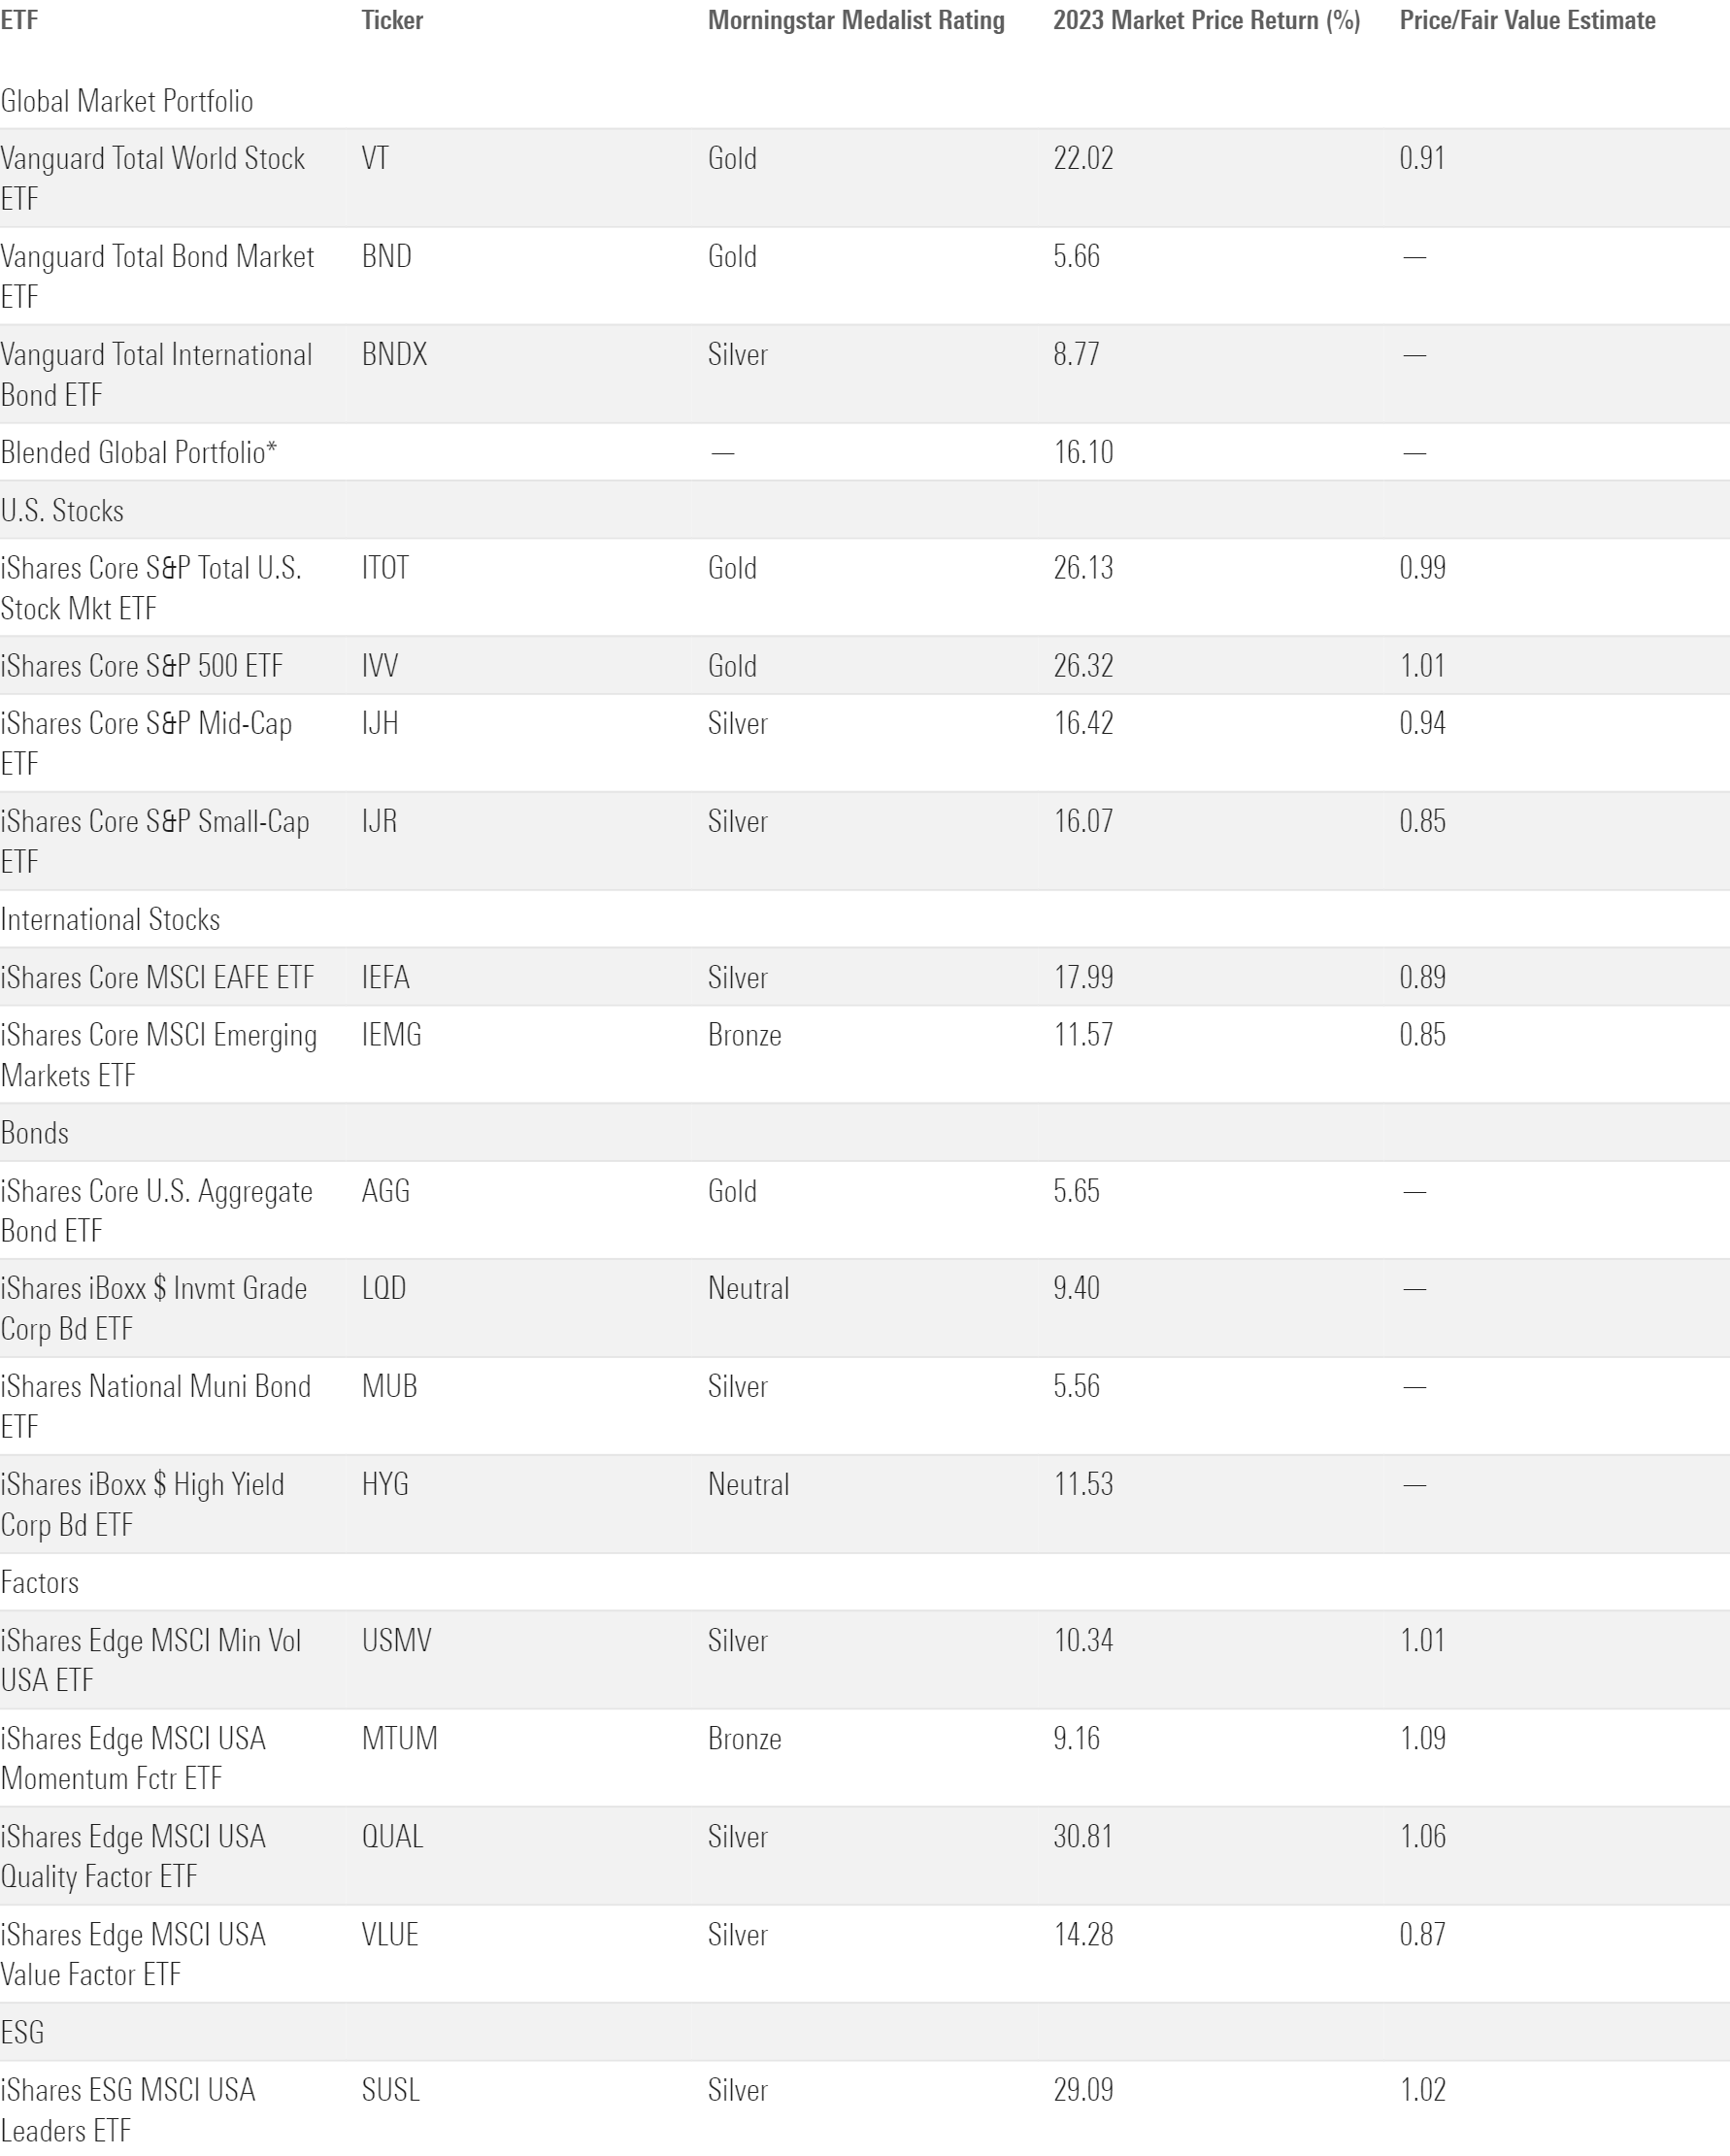
Exhibit 1 shows the 2023 returns for a sample of Morningstar analyst-rated ETFs that serve as proxies for major asset classes. The blended global portfolio finished 2023 16.1% higher than where it started, an excellent rebuttal to questions around the sensibility of the 60/40 portfolio after a dreadful performance in 2022.
2023 Market Performance Through the Lens of Analyst-Rated ETFs
The bond market in 2023 was highly sensitive to interest rates and their perceived trajectory. The Federal Reserve had already raised rates seven times when the year began, and many bond investors believed the worst was behind them. That optimism fueled a strong first quarter for bonds, but it didn’t last long. Economic data indicated that the rate hikes hadn’t tempered inflation or the economy like many expected, stirring up concerns that high rates were here to stay. Vanguard Total Bond Market ETF BND lost value in five-straight months, bottoming out with a negative 3.1% year-to-date return on Oct. 19.
Shortly thereafter, an avalanche of positive developments resuscitated the bond market and the indexes that track it. Inflation started to cool, the economy remained resilient, and Fed spokespeople intimated that 2024 could bring rate reductions instead of more hikes—a cocktail of promises that sparked rallies in bonds and stocks alike. BND climbed 8.4% over the final two months of 2023, enough for a 5.7% return on the year.
The improved interest-rate outlook benefited long-term bond funds the most, but turbulence earlier in the year made it hard for them to recover. When the book closed on 2023, iShares 20+ Year Treasury Bond ETF’s TLT 2.8% return trailed iShares Short Treasury Bond ETF’s SHV 5.0% gain.
Indexes that target lower-quality bonds fared well in 2023. Narrowing credit spreads powered SPDR Bloomberg High Yield Bond ETF JNK to a 12.4% return, its best since 2019, and iShares Broad USD Investment Grade Corporate Bond ETF USIG advanced 8.7%. Corporate-bond returns tend to be more closely correlated with the stock market than Treasuries—a billing they lived up to in 2023.
Stocks Return to Form
U.S. stocks took a beating in 2022 but staged an Adonis Creed-caliber comeback in 2023: Vanguard Total Stock Market VTI rallied 26.1%, clawing back all it lost the year before and then some.
The rebound was hardly democratic. For most of the year, a handful of mega-cap tech stocks lifted the entire market with exceptional returns, earning them the nickname “The Magnificent Seven.” The insatiable demand for artificial intelligence exposure helped ignite banner years for firms like Nvidia NVDA (239% return) and Meta Platforms META (194%). But these tremendous results masked middling performance in other market segments. IShares Core S&P 500 ETF IVV advanced 26.3% on the year, doubling up Invesco S&P 500 Equal Weight ETF RSP, which holds the same companies in equal rather than market-cap-weighted proportions. The economic factors that powered bonds toward the end of 2023 worked the same magic on some quieter areas of the stock market, but it was a concentrated rally for most of the year.
The Magnificent Seven’s historic year rippled throughout the stock market. Growth indexes dominated their value counterparts; Vanguard Growth ETF’s VUG 46.8% return trounced Vanguard Value ETF’s VTV gain by 38 percentage points. Technology Select Sector SPDR ETF XLK led the State Street suite of sector funds with a 56.0% gain, while its siblings that track the utilities, energy, and consumer staples sectors all lost value. And IVV outpaced iShares Core S&P Mid-Cap ETF IJH and iShares Core S&P Small-Cap ETF IJR by about 10 percentage points apiece—a margin that was much wider before small-cap stocks skyrocketed in December.
2023 ETF Flows
ETFs raked in an estimated $598 billion in 2023. That’s nothing to sneeze at, but it fell well short of ETFs’ near-trillion-dollar inflows in 2021 when the ETF market was significantly smaller. That doesn’t mean the year was a failure. ETFs continued to take market share from mutual funds, whose $440 billion of outflows from January through November point to the vehicles’ divergent directions. Plus, higher short-term bond yields made money market funds a legitimate rival to ETFs in 2023. From January through November, these strategies reeled in a record-setting $934 billion.
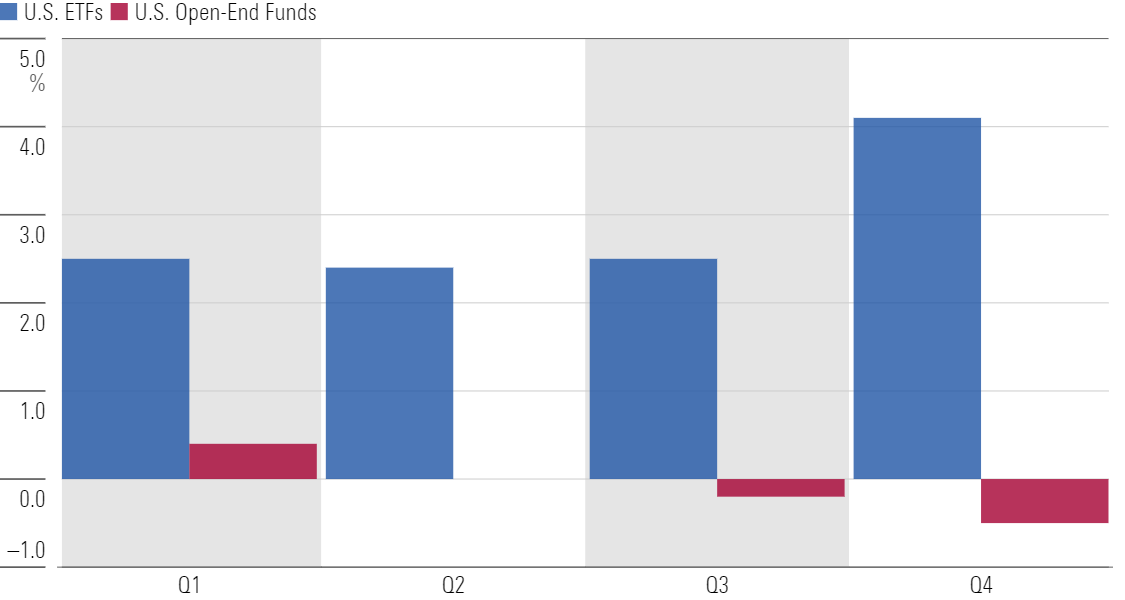
ETF providers likely penciled in even milder 2023 flows before the fourth quarter. Over the first three, ETFs collected $326 billion. As Exhibit 2 shows, ETFs have historically stolen the most market share from mutual funds in the fourth quarter, perhaps for tax reasons. ETFs’ strong finishes helped them grow their market share to 30% from 13% over the past 10 years.
Organic Growth Rate by Quarter
Stock ETF Flows
Flows into stock ETFs started 2023 slowly before kicking into gear as the year drew to a close. Investors piled $384 billion into them—most in absolute terms but well behind bond funds and other broad category groups when scaled for total assets.
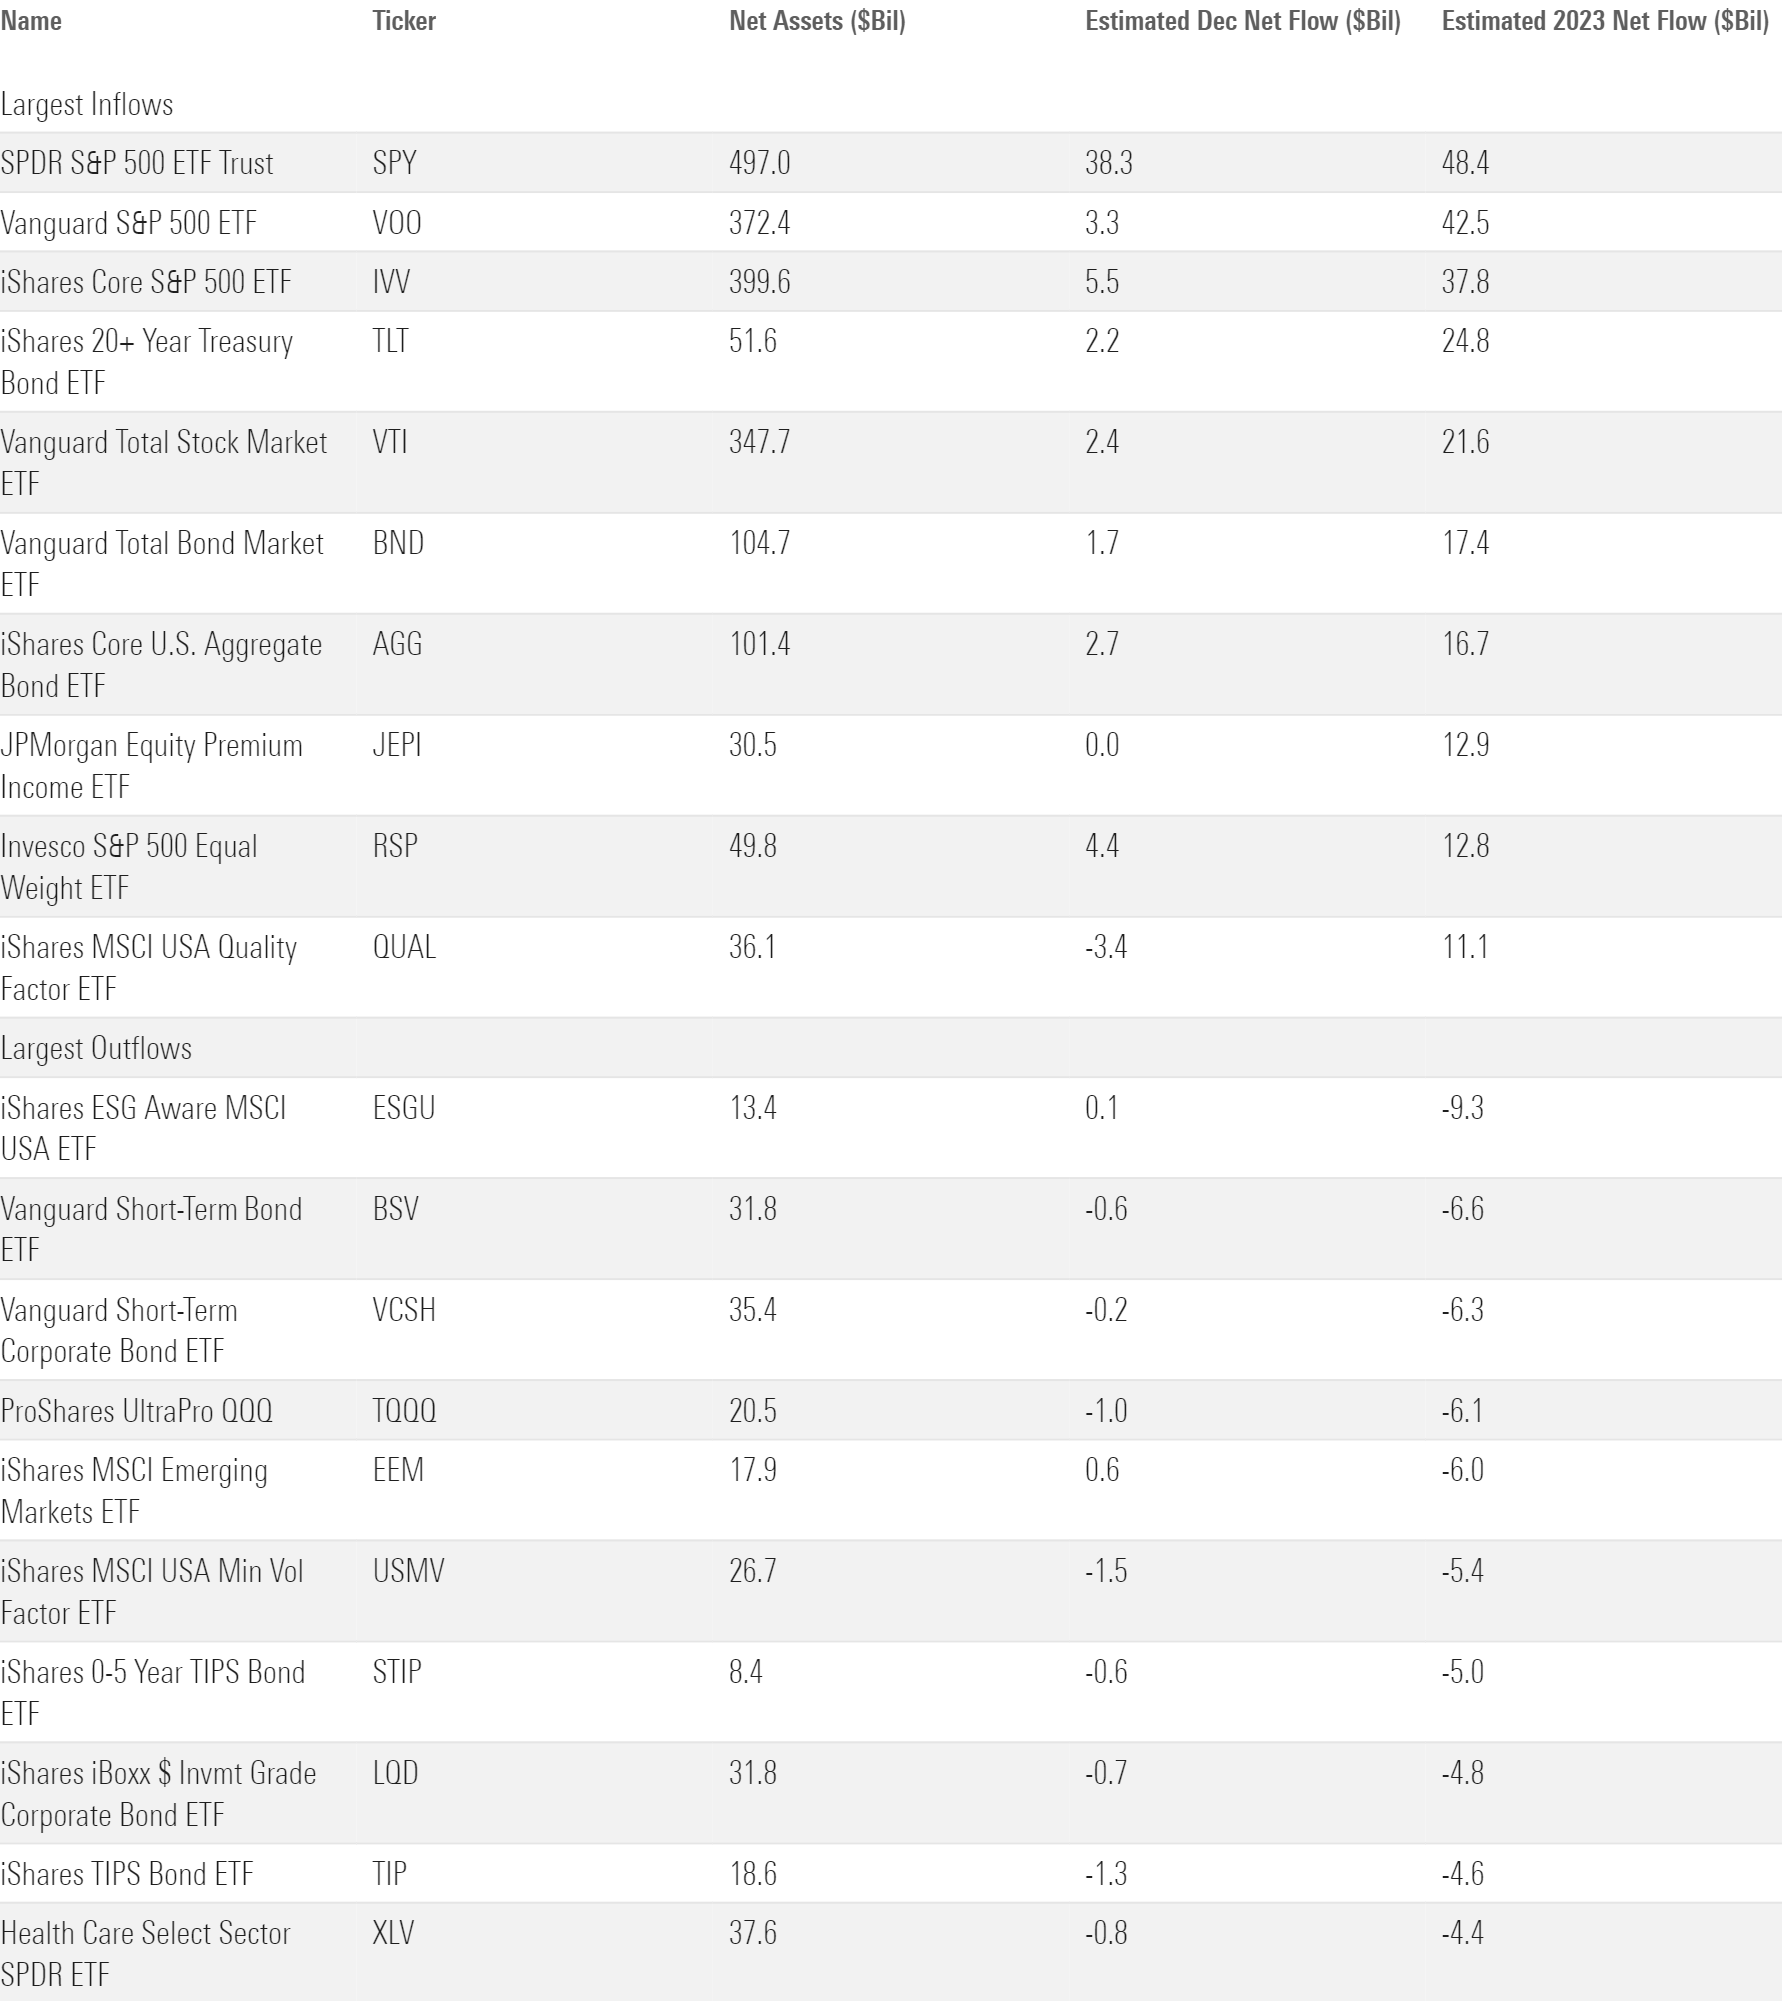
Year after year, the U.S. large-blend Morningstar Category is cemented atop the annual flows leaderboard. In 2023, investors piled $209 billion into the category that constitutes roughly 28% of the total market. Four of the five funds with the largest 2023 inflows sit in the large-blend space, and the top three all track the S&P 500 (SPDR S&P 500 Trust SPY, Vanguard S&P 500 ETF VOO, and iShares Core S&P 500 ETF). ETFs that pursue unique asset classes, styles, sectors, or market-cap segments periodically emerge as trendy picks, but the ETF world is ultimately dominated by the low-cost, plain-Jane index trackers that sit within the large-blend category.
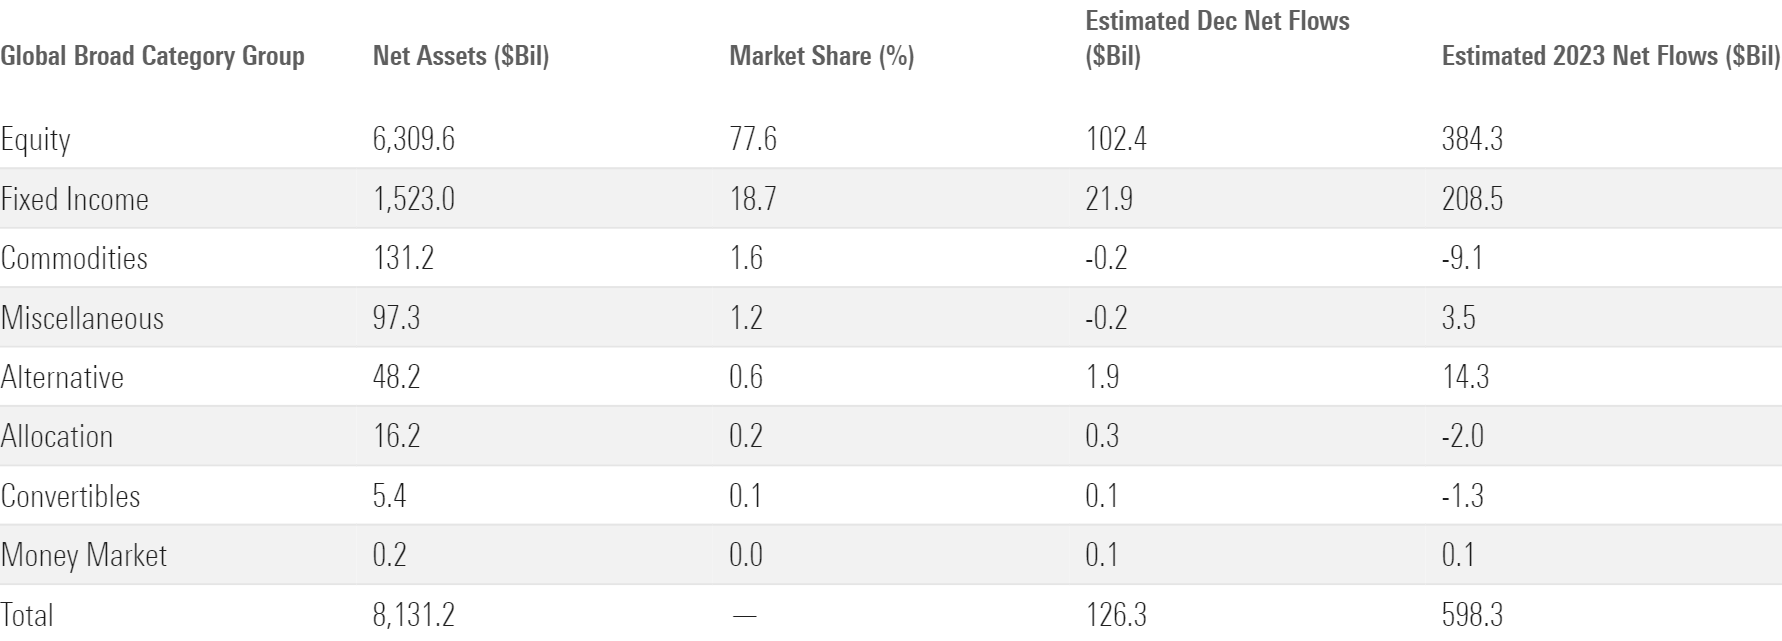
December Flows Across Morningstar Broad Category Groups
Aside from large blend, flows into U.S. equity funds were fairly subdued in 2023. The small- and mid-cap blend categories turned in solid but unremarkable years, collecting $21 billion and $13 billion, respectively. Large-growth funds reeled in $37 billion behind robust flows into Nasdaq-100 trackers Invesco Nasdaq 100 ETF QQQM ($8.4 billion) and Invesco QQQ Trust QQQ ($6.6 billion). And in a twist, large-value funds shed money for the first year since 2009. Value investors may have lost their patience after strategies like iShares Russell 1000 Value ETF IWD turned in a resilient 2022 campaign only to crash back to earth with relatively weak returns one year later.
Similar to the domestic arena, flows into the foreign large-blend category led the way among international-stock funds. Low-cost, broad index trackers like Vanguard FTSE Developed Markets ETF VEA helped the category pull in $42 billion on the year. Elsewhere in the international-stock cohort, funds that concentrate on a couple of long-ignored countries, India and Japan, enjoyed their best year of flows to date. The India equity category began the year with $6.5 billion in assets before racking up $4.3 billion of inflows, good for a 67% organic growth rate. Japan-stock funds collected $6.0 billion of their own for a 32% organic growth rate. Not all country-specific categories joined in on the fun, however: The China region segment bled $1.4 billion—the worst among international-equity categories.
Morningstar Categories With the Largest December Flows
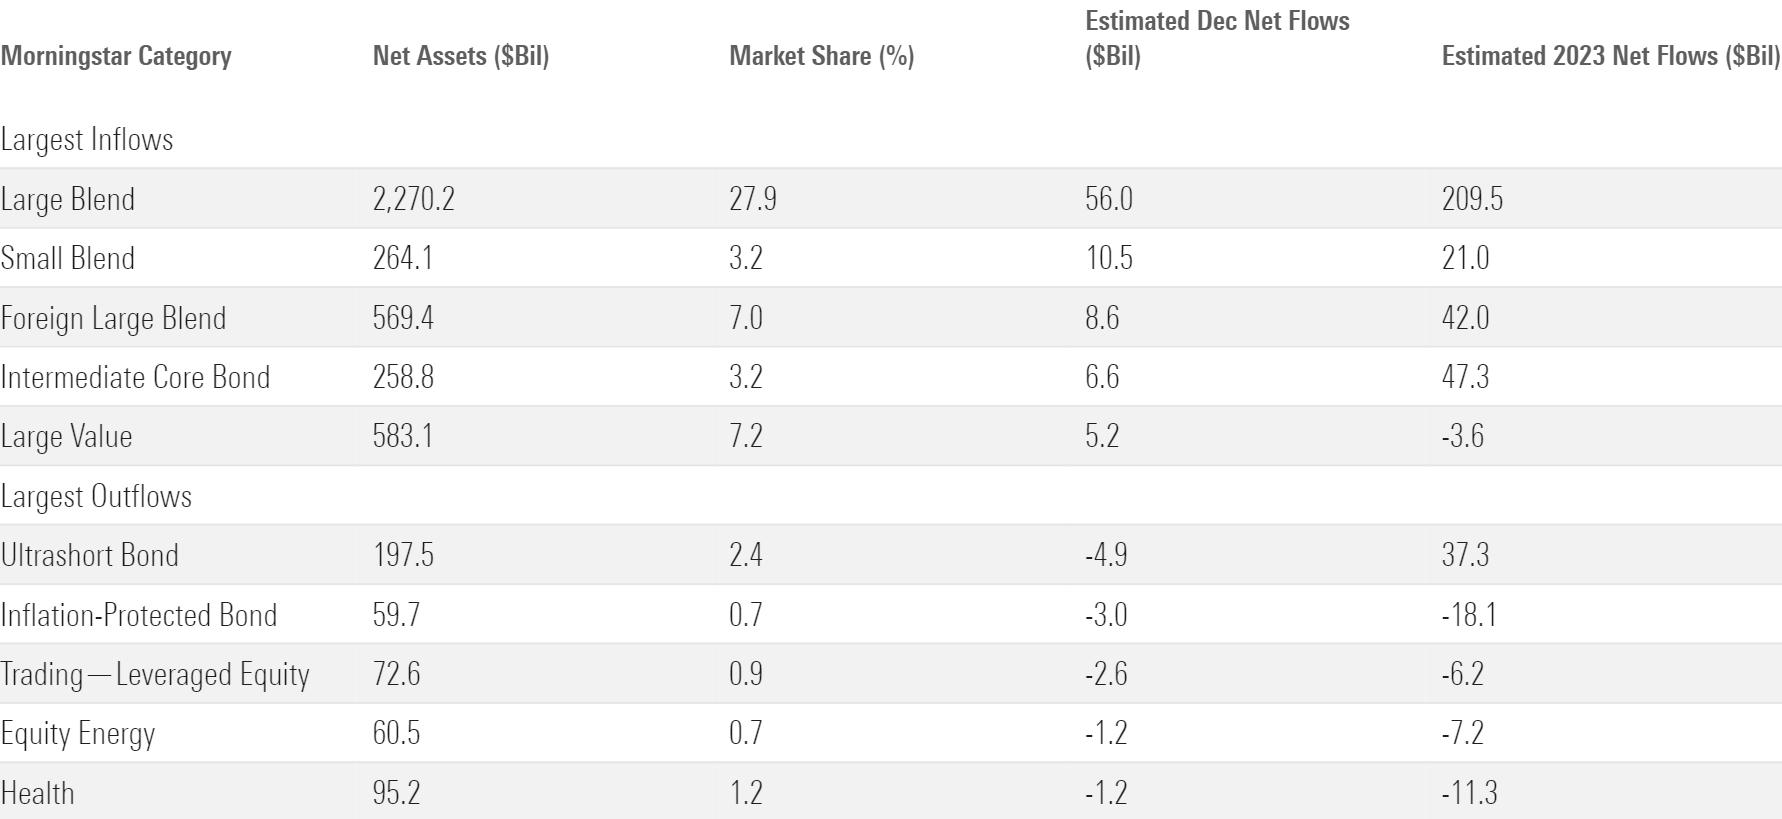
The sector-equity category group shed $13 billion on the year, its worst year on record. Outflows from funds that track value-oriented sectors weighed on the broader group. Investors abandoned ETFs focusing on the healthcare ($11 billion outflow), energy ($7.2 billion), and consumer staples sectors ($4.1 billion). Meanwhile, technology, communication-services, and consumer discretionary ETFs all hauled in money in 2023. These flow patterns across sector and style ETFs in 2023 mirrored the performance patterns for the stocks that they hold, which is likely no coincidence.
The nontraditional-equity cohort grew at a breakneck pace in 2023. It gathered $24 billion, which translates into a 71% organic growth rate that led all category groups by a wide margin. For the second year in a row, covered-call ETFs paved the way. The yield and downside protection these strategies offer made them highly desirable during the bear market in 2022, and they rode that demand through 2023.
J.P. Morgan owned the covered-call space. Its two-headed monster of JPMorgan Equity Premium Income ETF JEPI and JPMorgan Nasdaq Equity Premium Income JEPQ jointly collected nearly $20 billion in 2023. Flows into these funds started to taper as the market outlook improved in late 2023, however. Smooth markets in 2024 should reveal whether covered-call funds are market-proof or just bear-market darlings.
Bond ETF Flows
Bond ETFs constituted one fifth of the ETF market entering 2023, but the $209 billion they absorbed accounted for 35% of overall ETF net flows. Near-zero interest rates zapped bond yields for more than a decade, but their newly competitive yield attracted a wider swath of investors.
Investors in 2023 opted for longer-term bond portfolios, whose values stood to increase the most if the Fed announced future interest-rate cuts. (That eventually bore out after much pain along the way). Long-government funds—some of the purest duration plays available—reeled in $45 billion on the year, a close second to the much larger intermediate core bond category. Diversified long-term bond strategies gathered $5 billion, good for a 38% organic growth rate. That left short-term bond funds in a sour spot, mired between their long-term peers’ desirable duration and the ultrashort-bond category’s supreme safety. These ETFs bled $16 billion in 2023—by far their worst year on record.
ETFs With the Largest 2023 Flows
The inflation-protected bond category edged out short-term bonds for the dishonorable distinction of the largest 2023 outflows. The category hemorrhaged more than $18 billion in 2023 (a negative 23% organic growth rate). Investors poured roughly $40 billion into these funds in 2021 but bailed on them after encountering the inflation they wished to hedge. Bank-loan funds, another inflation antidote, gathered a paltry $1.1 billion. In the same vein, commodities ETFs fell out of favor as well. They shed $9.1 billion in 2023—their third consecutive year of outflows.
Active ETFs Level Up
If 2022 was active ETFs’ coming out party, then 2023 was when they grabbed the karaoke mic and brought the house down. As a flurry of new active ETFs hit the market, investors piled $131 billion into them—a new annual record. That accounted for 21.9% of net flows into all ETFs, a tremendous ratio for a cohort whose ETF market share climbed from just 5.3% to 6.5% during the year.
Active ETFs Expanded Their Footprint in 2023
Four ETF providers claimed most of the spoils from the rush into actively managed ETFs: Dimensional, J.P. Morgan, Avantis, and Capital Group. Dimensional set the pace with a $31 billion haul, but each firm saw at least $10 billion stream into its active ETF lineup. Dimensional and Avantis both weave systematic portfolios that toe the line between active and passive, though the former has a longer track record via its mutual funds. J.P. Morgan leans on its covered-call ETFs, and Capital Group offers some of the discretionary strategies that it has run through open-end funds for decades. It remains to be seen whether these shops can protect their active-ETF market share; they are likely to face fierce competition in the coming years.
Strategic-Beta Stumbles
The rise of active ETFs came at the expense of strategic-beta funds, which are index-tracking products that sit somewhere between active and passive. Their milder 3.3% organic growth rate trailed that of active and traditional passive ETFs by a comfortable margin.
Risk-oriented strategies bled $14 billion, a harsh but understandable blow given the market’s resurgence. A weak year from dividend ETFs sapped the strategic-beta cohort, too. These funds were some of the market’s hottest in 2022, but they scraped together just $3.9 billion in 2023—their lowest annual haul since 2009. Funds targeting the quality factor kept the broader group afloat. Quality ETFs pulled in $25 billion in 2023 behind a stellar year from iShares MSCI USA Quality Factor ETF QUAL, whose addition to a widely followed BlackRock model portfolio prompted a parade of inflows.
Sustainable ETFs
Environmental, social, and governance ETFs bled $8.0 billion in 2023. It was their first year of outflows since 2012, but it’s probably too soon to conclude that investors are done with ESG.
For every action, there is an equal and opposite reaction—in physics and model portfolio changes. When BlackRock admitted QUAL to its popular model portfolio, it jettisoned iShares ESG Aware MSCI USA ETF ESGU to clear the room. ESGU consequently bled $9.3 billion on the year, enough to drag the broader sustainable ETF landscape into the red. The outflows here should be read as a testament to BlackRock’s influence, not an indictment on the popularity of ESG investing.
Alternative ETFs
Nearly all of the $14 billion that the alternative category group collected in 2023 came from the options-trading category, which houses defined-outcome or “buffer” ETFs. Designed to protect the downside by surrendering some upside, these strategies layer options atop conventional indexes. Similar to covered-call funds, their resilience in bear markets made them a popular choice in 2022. That spilled into 2023 as uncertainty lingered, but a brighter market outlook could dim the prospects for defined-outcome strategies.
The Vanguard Dynasty Continues
Vanguard hauled in $159 billion, the most among all ETF providers for the fourth consecutive calendar year. IShares and State Street, the rest of the ETF market’s Big Three, finished second and third. At the end of 2023, this trio accounted for 76% of all U.S. ETF assets.
December Flows for the 10 Largest ETF Providers
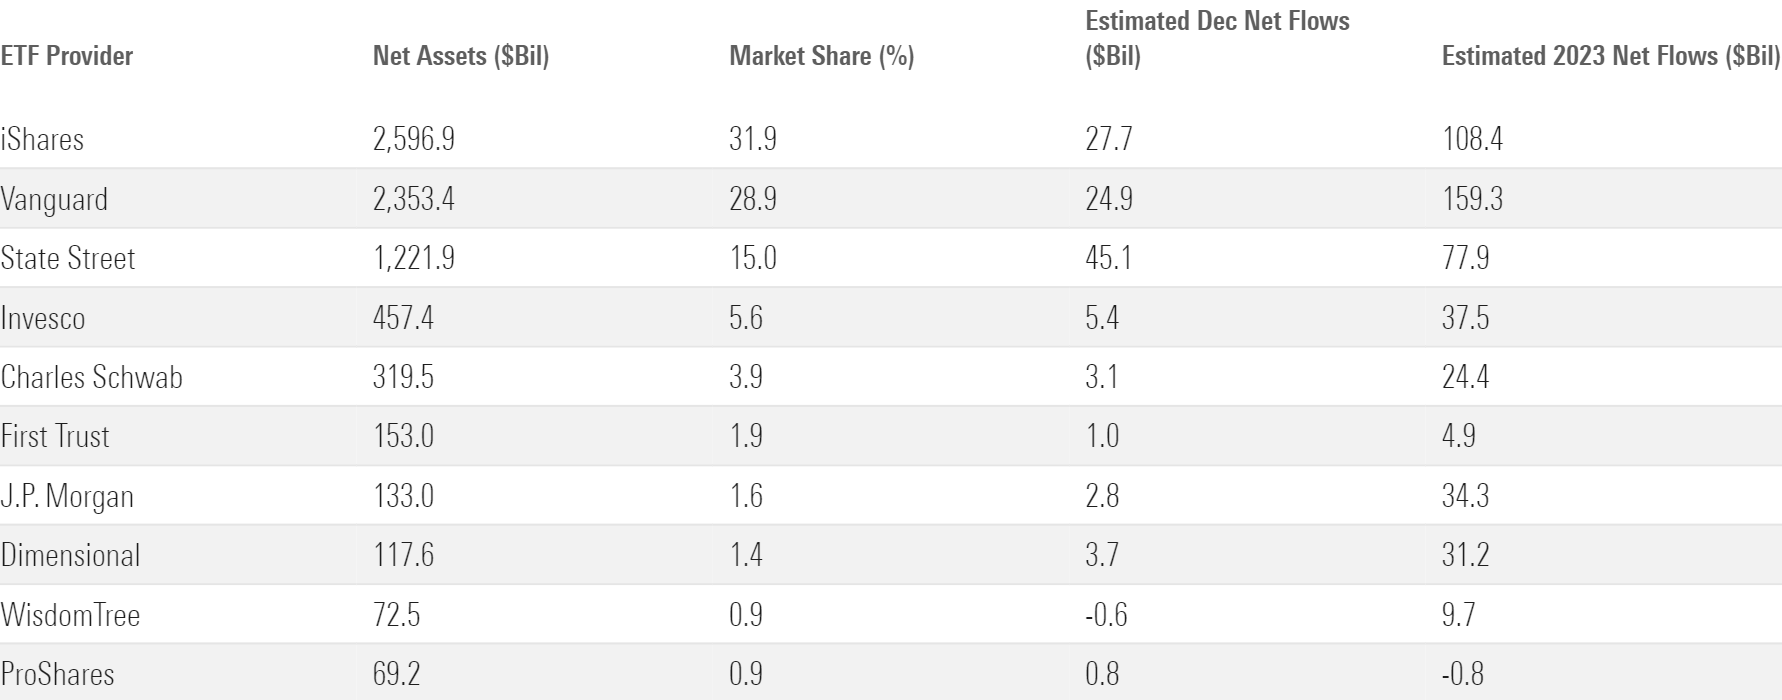
Vanguard won the flows crown the same way it won the last three: a roster of cut-and-dried index funds and a disciplined investor base that sticks with them. More than half the money that poured into Vanguard went to VOO, VTI, or BND. Advisors and individuals who invest in Vanguard funds have a reputation for systematically investing in these broad strategies rather than timing them with the market. That steady hand has shone over the past four years, as Vanguard’s four-year winning streak spanned two pronounced market drawdowns and their subsequent rallies.
Entering 2023, iShares’ bond ETFs constituted about one fourth of the firm’s size, but they went on to claim about 72% of its net flows for the year. That’s because iShares’ stock ETFs had a lackluster 2023, gathering $37 billion that translated into a 3.4% organic growth rate. IVV reeled in $38 billion on its own, but heavy outflows from the firm’s value, dividend, ESG, and low-volatility products weighed on the overall picture.
State Street was headed for a much quieter year until a late surge into SPY helped it finish the year on a high note. The firm had little to celebrate outside of that. As the premier sector-ETF provider, outflows from that segment stung it harder than most. And while State Street’s fixed-income lineup had bright spots—like SPDR Bloomberg 1-3 Month T-Bill ETF’s BIL $6.9 billion inflow—it couldn’t match the growth of its two larger rivals.
What’s Cheap?
The fair value estimate for ETFs rolls up our equity analysts’ fair value estimates for individual stocks and our quantitative fair value estimates for stocks not covered by Morningstar analysts into an aggregate fair value estimate for stock ETF portfolios. Dividing an ETF’s market price by this value yields its price/fair value ratio. This ratio can point to potential bargains and areas of the market where valuations are stretched.
The 10 Most Under- and Overvalued Analyst-Rated ETFs
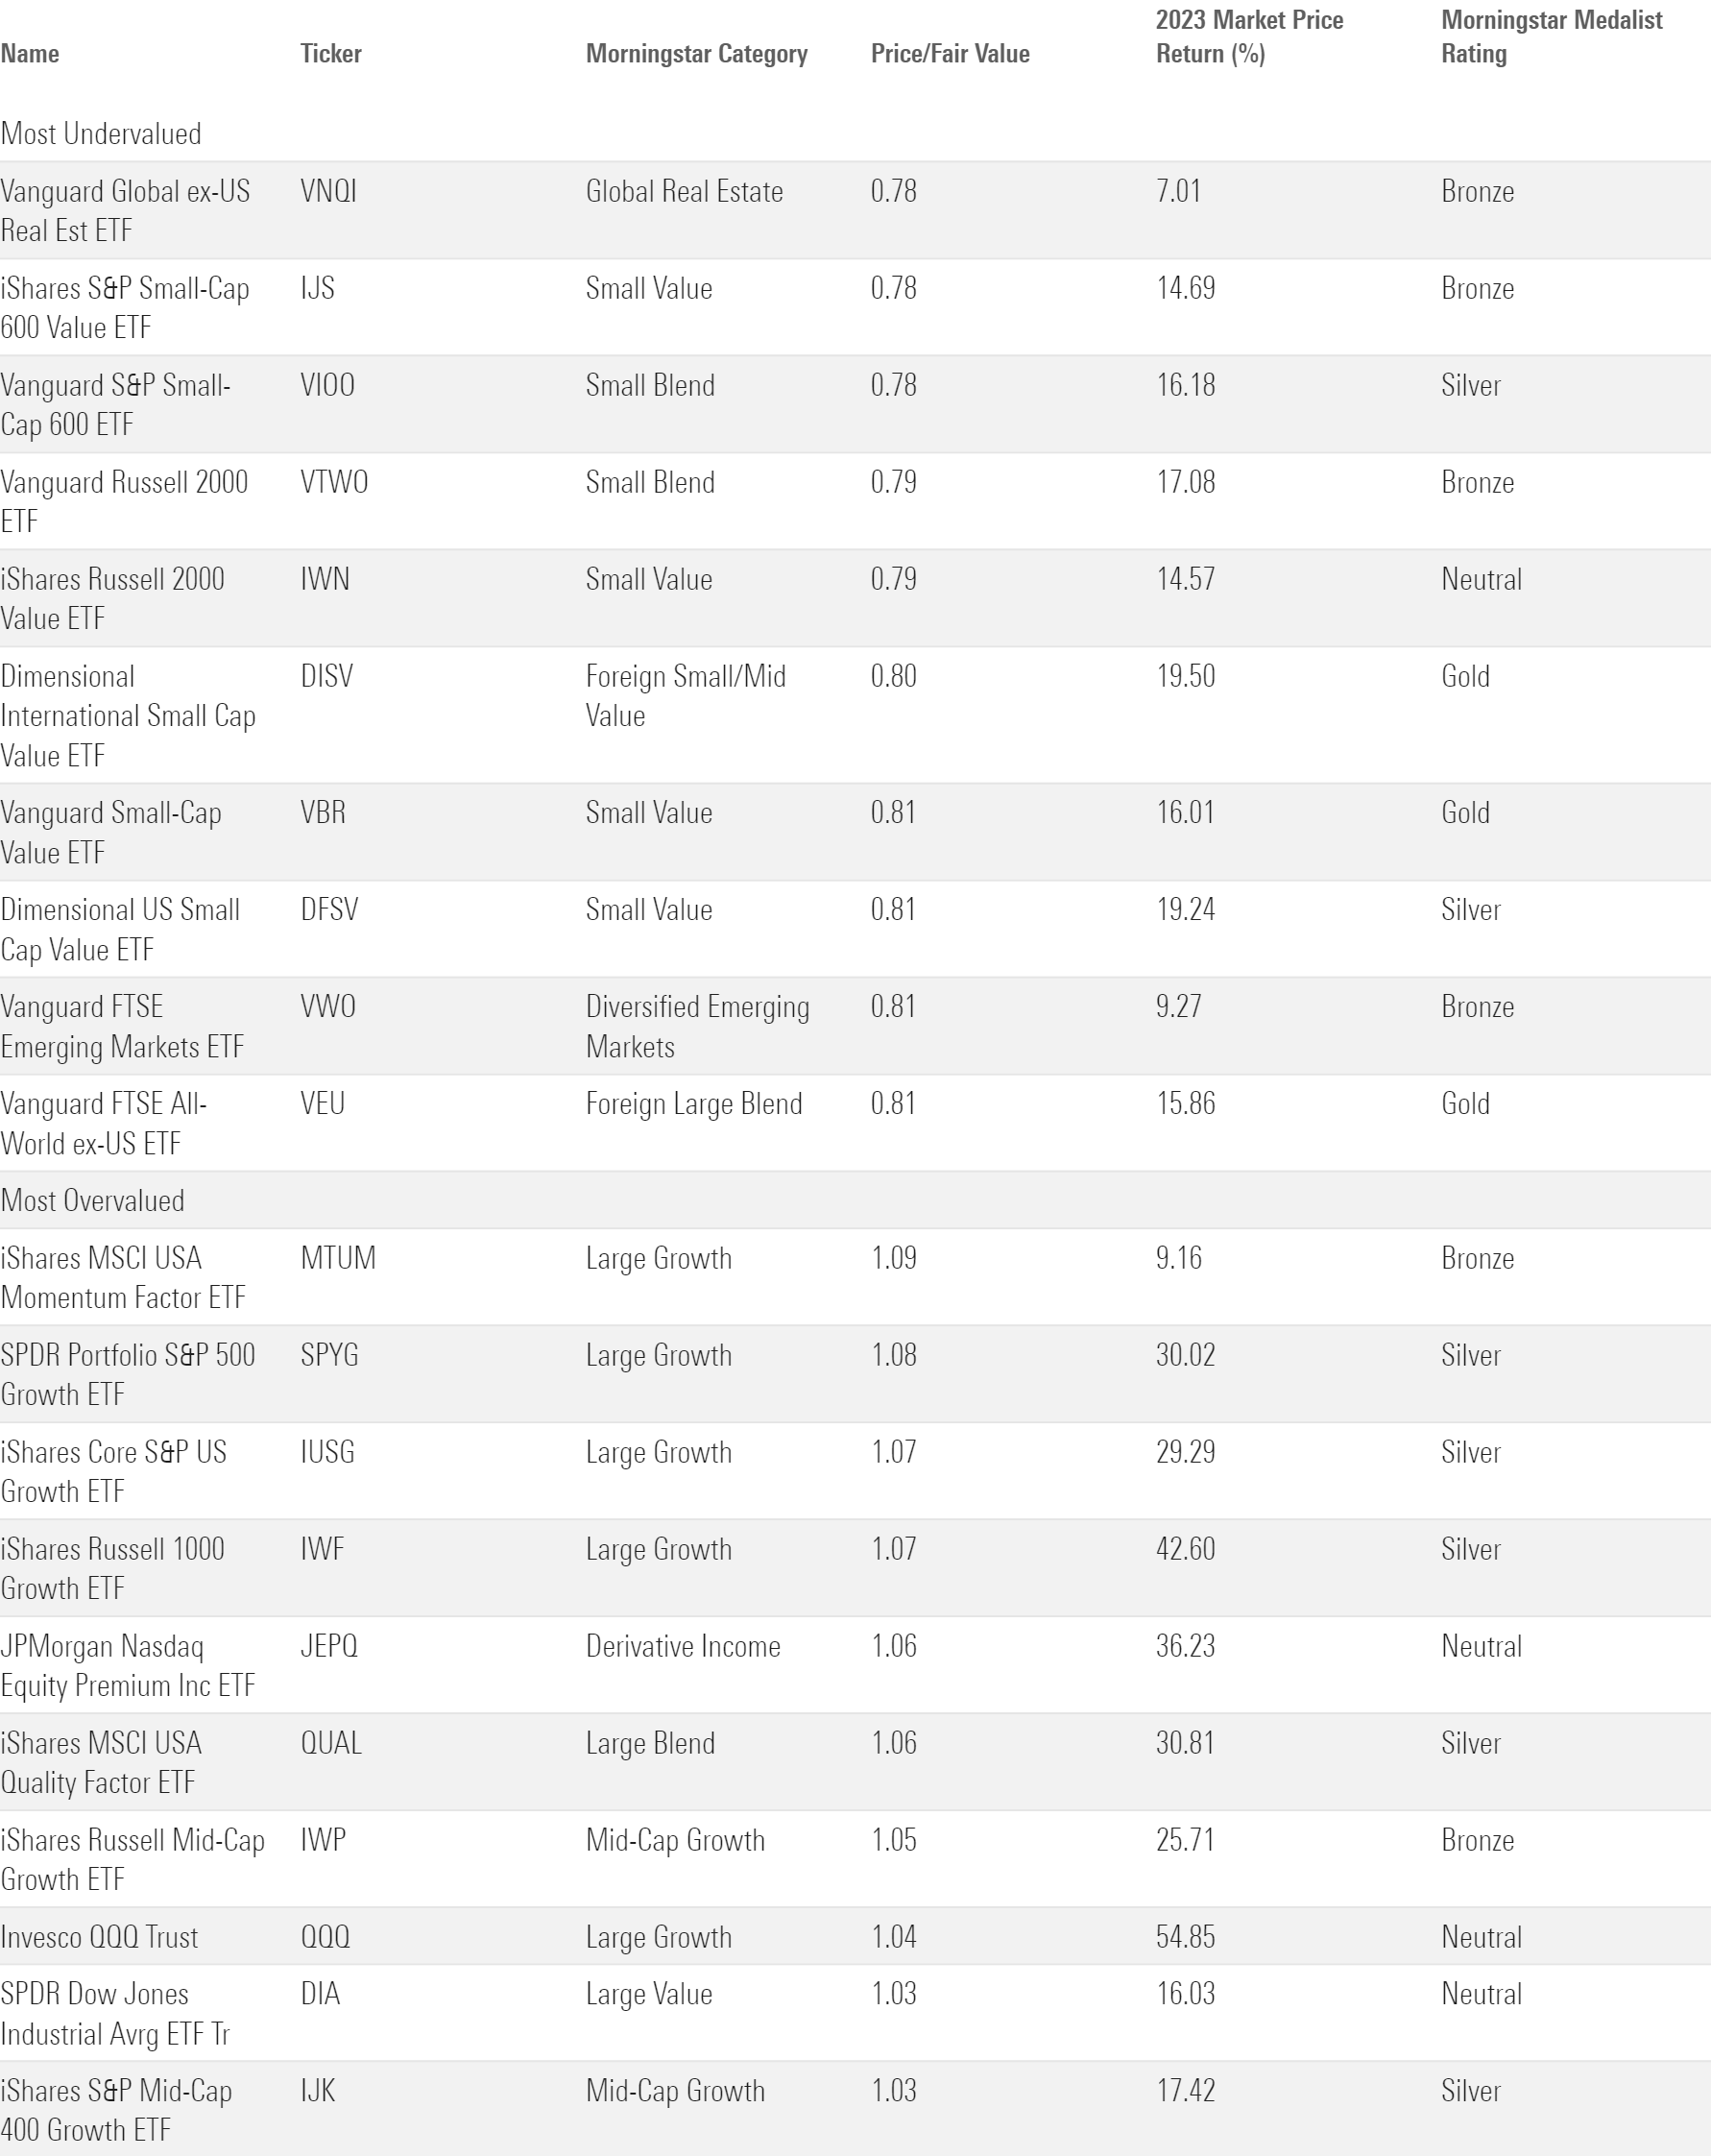
For a more comprehensive survey of what looks attractive entering the new year, check out Morningstar’s 2024 Market Outlook.
The author or authors do not own shares in any securities mentioned in this article. Find out about Morningstar’s editorial policies.
/cloudfront-us-east-1.images.arcpublishing.com/morningstar/ZHTKX3QAYCHPXKWRA6SEOUGCK4.png)
/cloudfront-us-east-1.images.arcpublishing.com/morningstar/24UPFK5OBNANLM2B55TIWIK2S4.png)
/d10o6nnig0wrdw.cloudfront.net/04-25-2024/t_29c382728cbc4bf2aaef646d1589a188_name_file_960x540_1600_v4_.jpg)
:quality(80)/s3.amazonaws.com/arc-authors/morningstar/30e2fda6-bf21-4e54-9e50-831a2bcccd80.jpg)