
Is Your Index Fund Tracking the Right Index? Here’s What to Look For
Understanding these 6 qualities of the best indexes can help investors choose among thousands of index funds.
/s3.amazonaws.com/arc-authors/morningstar/ab0b7979-59e4-461f-be92-19c328d94d6f.jpg)
/s3.amazonaws.com/arc-authors/morningstar/30e2fda6-bf21-4e54-9e50-831a2bcccd80.jpg)
An index fund can only be as good as the index it tracks. While these benchmarks are usually transparent and rules-based, they are not all equal. Nuances in construction can cause performance to diverge between seemingly similar index strategies. Sorting out these details is cumbersome. And in a market where thousands of index products line the shelves, distinguishing the good from the bad can be a daunting task.
Morningstar analysts compiled a simple checklist of six characteristics to consider when evaluating index funds. This checklist is foundational to Morningstar Medalist Ratings for index strategies and can point investors toward the best options available. The six traits of the best indexes are:
- Representative
- Diversified
- Investable
- Transparent
- Sensible
- Low Turnover
Is It Representative?
The main advantage of index funds is their low cost. Index funds that draw on the full range of opportunities available to their active peers can turn that cost advantage into a bona fide performance edge. In other words, index funds bundle the same stocks and bonds as their active peers and sell them to investors for a lower price. If an index features a different set of securities than the funds it aims to beat, there’s no guarantee its lower fee will matter.
Consider iShares Broad USD Investment Grade Corporate Bond ETF USIG and iShares iBoxx $ Investment Grade Corporate Bond LQD. Both aim to provide exposure to U.S.-dollar-denominated investment-grade corporate bonds, but LQD’s stricter maturity and liquidity screens shrink its opportunity set. LQD requires bonds to have a minimum of three years remaining until maturity and $750 million in outstanding value, while USIG requires one year until maturity and $250 million of outstanding face value.
For LQD, these stringent requirements exclude a sizable portion of the opportunity set available to peers. LQD’s average category peer holds 15%-20% of their assets in bonds maturing in less than three years. LQD’s stringent screens create an active bet against shorter-duration bonds without a clear incentive to do so, and they also create a more volatile portfolio. Since its 2002 inception through January 2024, LQD’s excess return over the category average barely broke even but came with much higher volatility. In contrast, USIG’s performance tends to be less volatile than LQD and much more like its average category peer because it represents the opportunity set well.
Is It Diversified?
The case for diversifying across a wide array of holdings is twofold: 1) The demise of one holding won’t torpedo the performance of the entire portfolio, and 2) casting a wide net improves the chances of catching the next winner to rise from obscurity to market leader.
The best indexes diversify away other sources of risk that the market does not reward. For instance, research shows that loading up in a single sector yields no long-term performance edge. Indexes that reflect the market’s sector composition, rather than concentrate in a select few, position themselves for stronger risk-adjusted performance over the long haul.
Is It Investable?
Indexes that invest in illiquid securities can be hard to track or have limited capacity, meaning that they are not practically investable for portfolio managers. Bank loans, for example, trade infrequently and therefore command steep transaction costs, a friction that rubs on bottom-line returns for index strategies. Capacity problems arise when so much money is tied to a benchmark that the prices of its securities move when index funds buy or sell, forcing them to execute at unfavorable prices.
Indexes operating in illiquid market segments may choose to impose liquidity thresholds to address investability concerns. However, this may eliminate a significant chunk of the opportunity set, hurting the index’s representative trait, like the case for LQD.
Is It Transparent?
A clearly defined index allows investors to anticipate its behavior across market environments, ensuring that investors are getting what they expect. Most benchmarks check this box.
That said, indexes that are curated by investment committees rather than hard-and-fast rules don’t meet the transparency standard. The S&P 500 is the most notable example. The same goes for index funds that rely on an optimizer to generate their portfolios. Optimizers are common among multifactor funds like iShares U.S. Equity Factor ETF LRGF and Hartford Multifactor U.S. Equity ETF ROUS. They can be a useful way to balance competing objectives and constraints, but optimizers are opaque and can leave investors with something other than what they bargained for.
Is It Sensible?
Sensible indexes answer yes to the question: “Are the rules that govern this portfolio’s construction driven by sound economic rationale?” Most index funds meet this standard. But a couple that do not meet it happen to be some of the most popular.
Consider Invesco QQQ Trust QQQ, the fifth-largest ETF on the market. It tracks the Nasdaq-100 Index, which admits only companies whose primary listing is the Nasdaq exchange. That requirement has no economic basis: It’s the result of Nasdaq promoting its exchange, and it strips out prominent stocks listed on other major stock exchanges, like Eli Lilly LLY, Home Depot HD, and Salesforce CRM.
Likewise, SPDR Dow Jones Industrial Average ETF DIA tracks the Dow Jones Industrial Average—a relic of the 1800s. It only holds 30 stocks, and they are weighted by price not market cap, which makes no economic sense.
Is It Low-Turnover?
Finally, good indexes take strides to dial back undue portfolio turnover. Trading securities isn’t free, and the costs can pile up quickly in illiquid markets. For example, indexes may implement buffers around their upper or lower market-cap bounds to limit turnover dictated by short-term performance, within reason. Those that do not have buffers felt the sting of higher turnover over the years.
A Case Study of Small-Cap Indexes
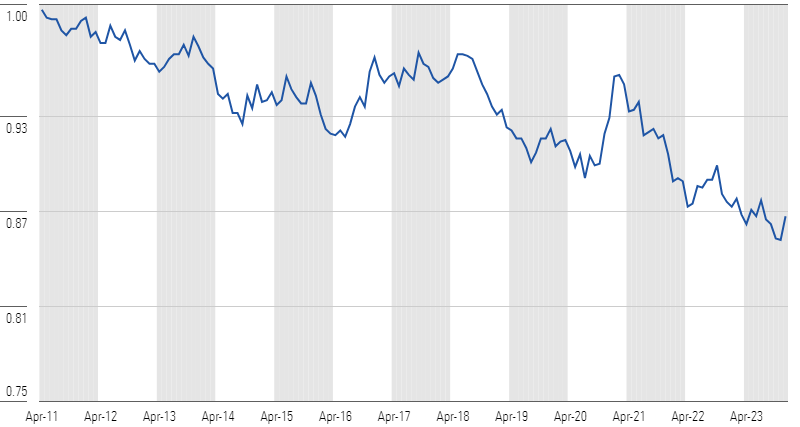
To measure the impact of these index characteristics in real terms, compare the performance of two broad-based small-cap index funds: Bronze-rated Vanguard Russell 2000 ETF VTWO and Gold-rated Vanguard Small-Cap ETF VB. They track the Russell 2000 and CRSP US Small Cap indexes, respectively.
The benchmarks are similar in spirit. Both cast a wide net and represent the shape of the small-cap market, checking the representative and diversified boxes. The indexes follow objective, reasonable blueprints, so both meet the transparency and sensibility standards.
The CRSP index is plenty investable and rarely turns over, but that’s where the Russell 2000 Index falls short. It doesn’t incorporate turnover buffers around its lower threshold, saddling it with far higher turnover than most small-cap indexes. Moreover, the micro-caps that consequently cycle in and out of the portfolio are quite illiquid, a problem amplified by the immense money tied to the Russell 2000 Index.
The cost of trading illiquid securities often has weighed on VTWO’s performance. Over the 10 years through December 2023, it returned 7.20% annually and trailed about half of its small-blend peers. VB gained 8.43% annually over the same period and ranked among the top 14%. The Russell 2000 Index’s defects aren’t the sole cause of this performance disparity—its smaller market-cap orientation and VTWO’s higher fees hurt, too—but they have undoubtedly left a mark.
Relative Growth of $1 in the Russell 2000 Index vs. the CRSP US Small Cap Index Growth
Implementing the 6 Traits Checklist
This checklist is not set in stone. It provides a general road map used by Morningstar analysts when rating index funds. It serves as a tool to discern nuances in index construction—differences that may start out small but compound over time.
The author or authors do not own shares in any securities mentioned in this article. Find out about Morningstar’s editorial policies.
/cloudfront-us-east-1.images.arcpublishing.com/morningstar/24UPFK5OBNANLM2B55TIWIK2S4.png)
/d10o6nnig0wrdw.cloudfront.net/04-25-2024/t_29c382728cbc4bf2aaef646d1589a188_name_file_960x540_1600_v4_.jpg)
/cloudfront-us-east-1.images.arcpublishing.com/morningstar/T2LGZCEHBZBJJPPKHO7Y4EEKSM.png)
:quality(80)/s3.amazonaws.com/arc-authors/morningstar/ab0b7979-59e4-461f-be92-19c328d94d6f.jpg)
:quality(80)/s3.amazonaws.com/arc-authors/morningstar/30e2fda6-bf21-4e54-9e50-831a2bcccd80.jpg)