
9 Trends That Shaped ETF Flows in Q1
US ETFs raked in $195 billion in the first quarter.
/s3.amazonaws.com/arc-authors/morningstar/30e2fda6-bf21-4e54-9e50-831a2bcccd80.jpg)

Key Takeaways
- US exchange-traded funds hauled in more than $195 billion in the first quarter of 2024, including $103 billion in March alone.
- Stock ETFs collected $76 billion, led by broad index trackers in the US large-blend Morningstar Category.
- Bond ETFs cracked $50 billion of inflows for the second quarter in a row.
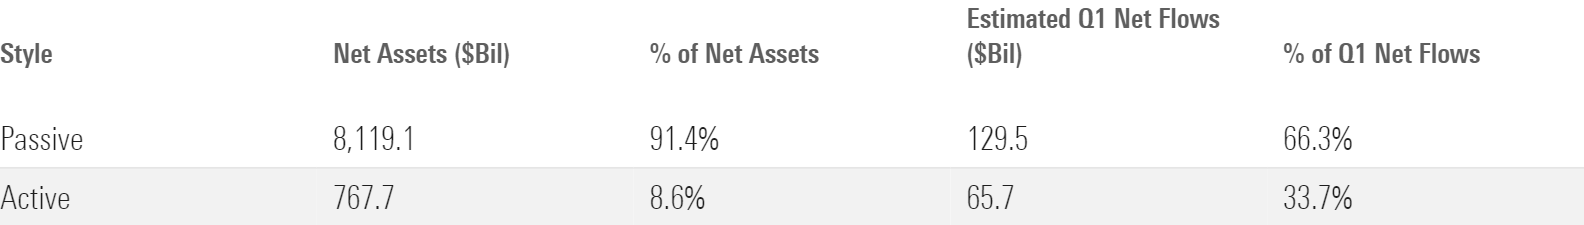
- Active ETFs remained in high demand, collecting one third of first quarter ETF flows despite representing less than 10% of the market.
- The “new nine” spot bitcoin ETFs closed the first quarter with nearly $27 billion of inflows.
- Vanguard dominated the ETF provider flows race with a $66 billion first quarter haul.
Stocks Unfazed in Q1
Exhibit 1 shows the March 2024 returns for a sample of Morningstar analyst-rated ETFs that serve as proxies for major asset classes. A blended global portfolio gained 2.31% on the month, powered by solid returns from the global stocks found in Vanguard Total World Stock ETF VT. Vanguard Total Bond Market ETF BND and Vanguard Total International Bond ETF BNDX chipped in gains as well—their first month in the black in 2024.
March Market Performance Through the Lens of Analyst-Rated ETFs
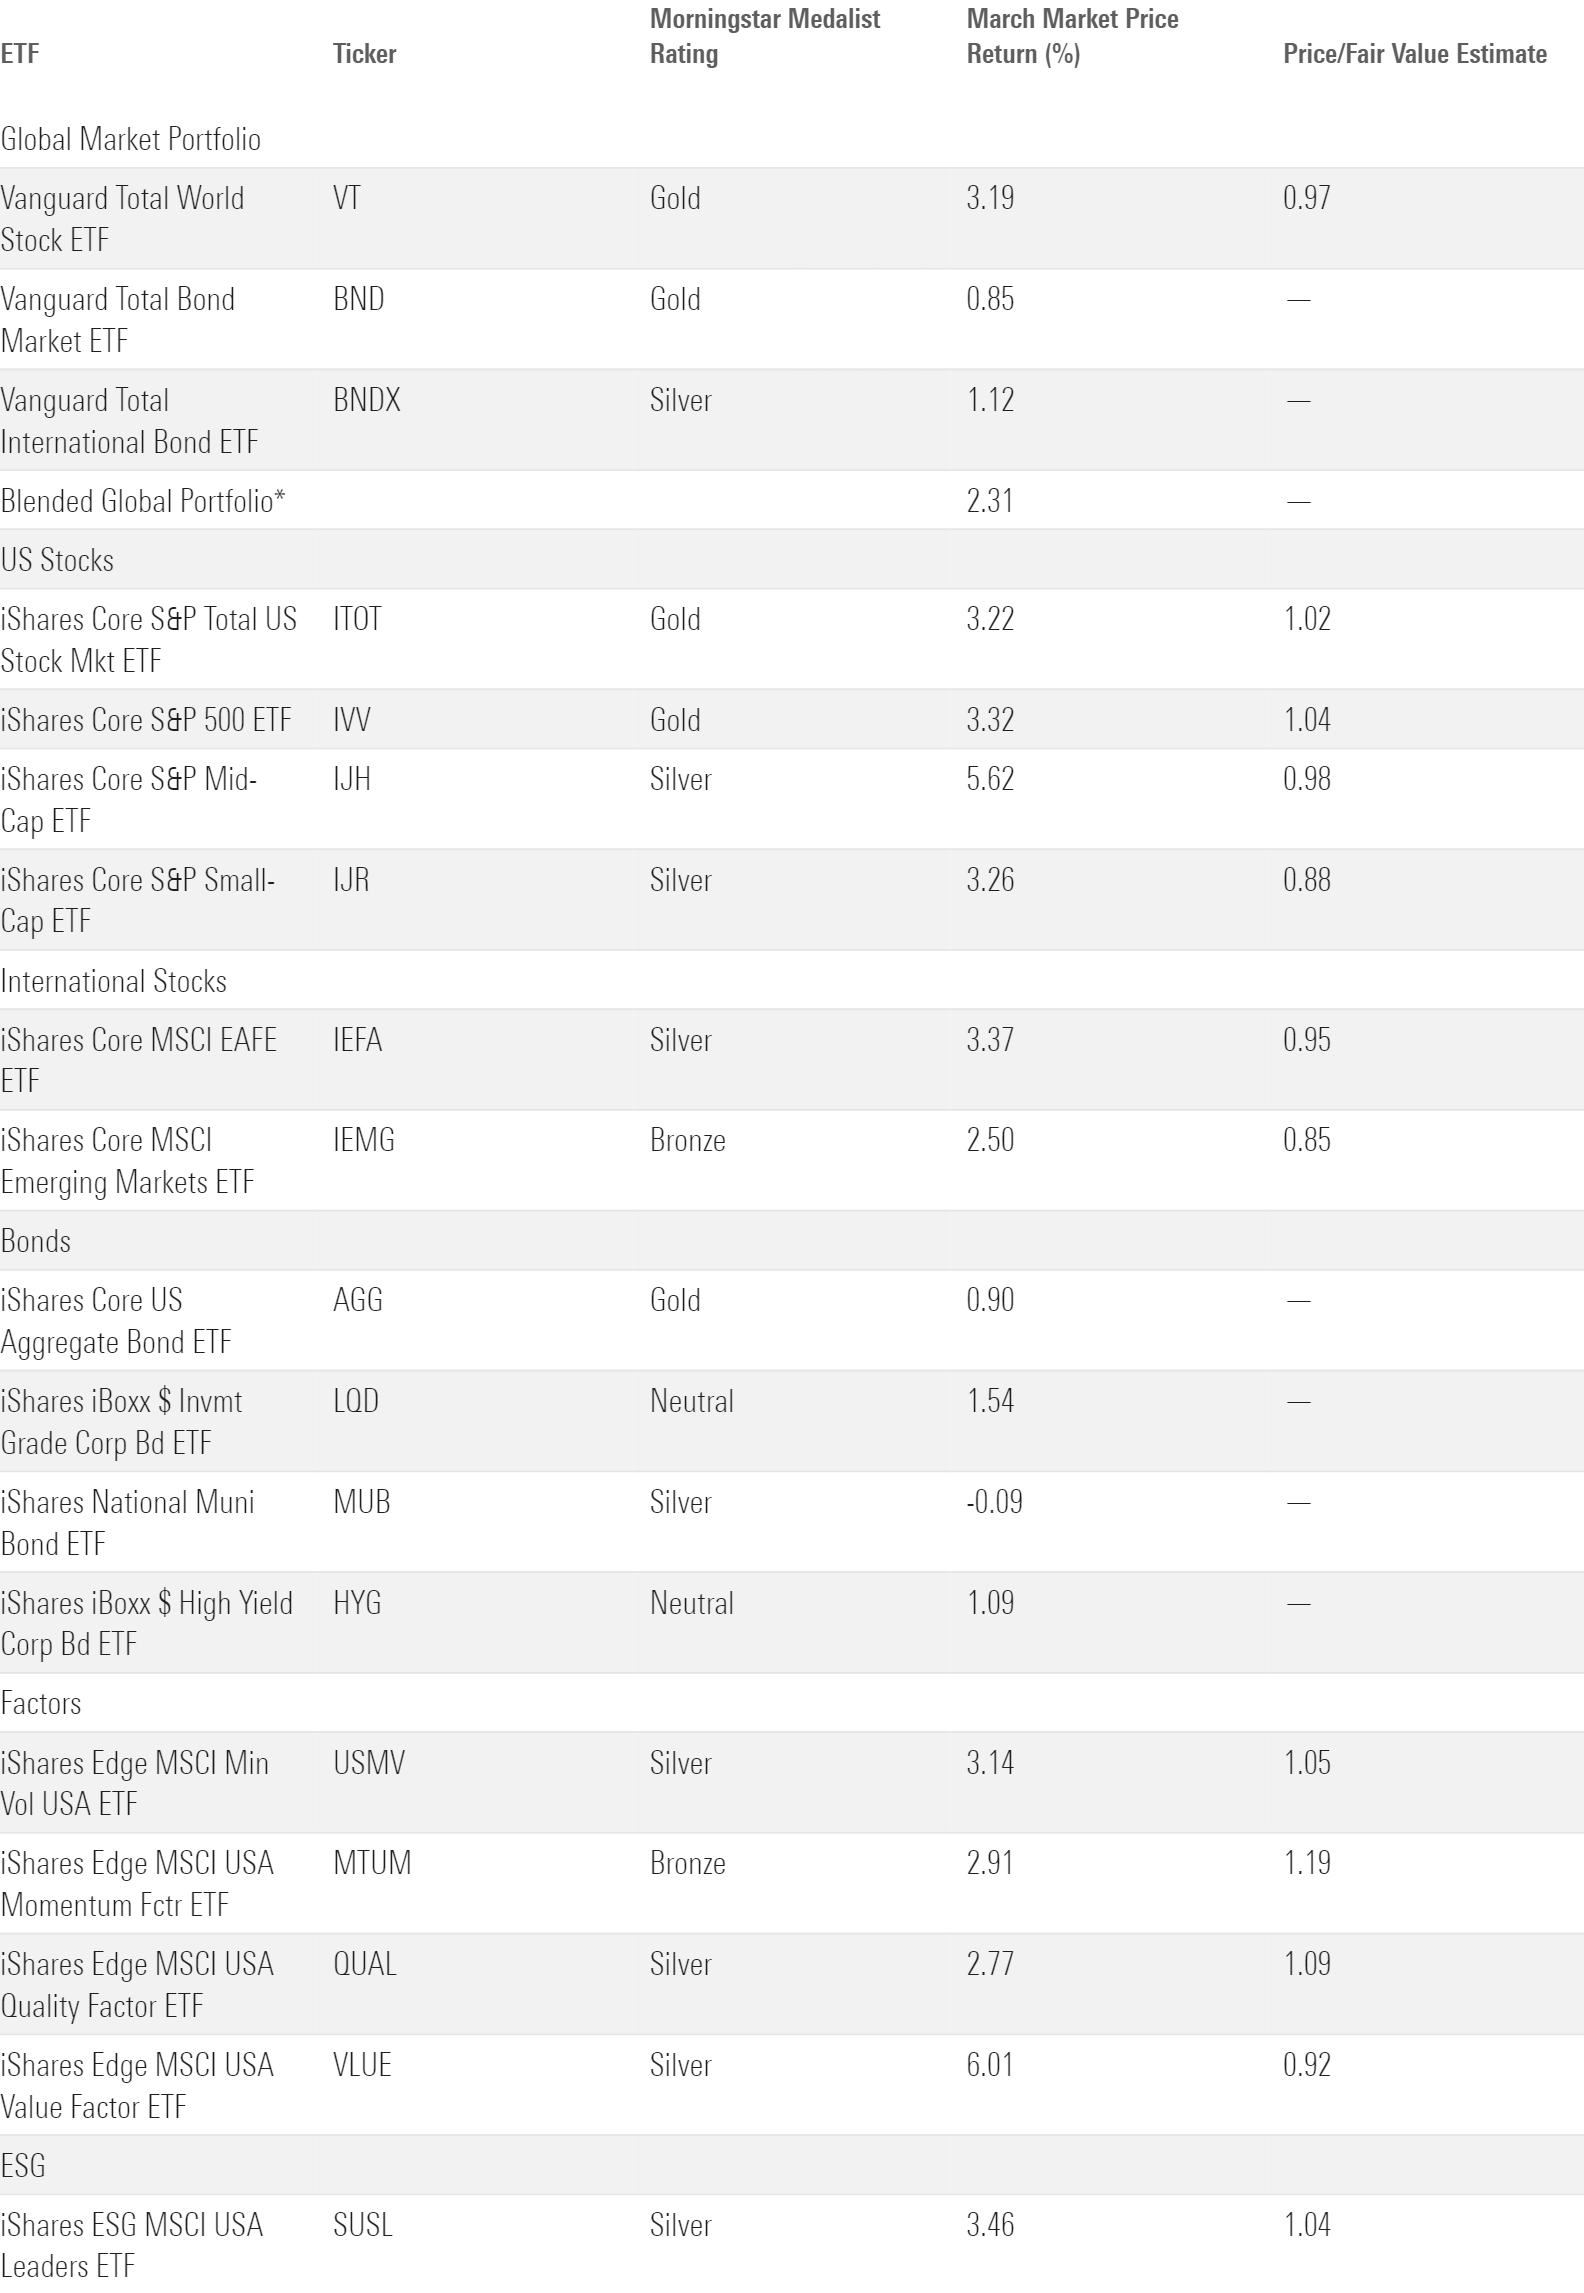
The same challenges that bonds have contended with for the past two years resurfaced in the first quarter. Persistent inflation data pushed back the timeline for interest-rate cuts and pulled the Morningstar US Core Bond Index down 0.75% on the quarter. Stocks took the economic headwinds in stride, however. The Morningstar Global Markets Index, a broad gauge of global stocks, climbed 7.82% behind a batch of stellar earnings reports, continued enthusiasm for artificial intelligence, and climbing commodity prices.
Check out Morningstar’s first quarter market summary for a detailed recap on equity and fixed-income performance and the second quarter market outlook for what lies ahead.
9 Trends in ETF Flows
1) US Stock ETF Flows Returned to Form
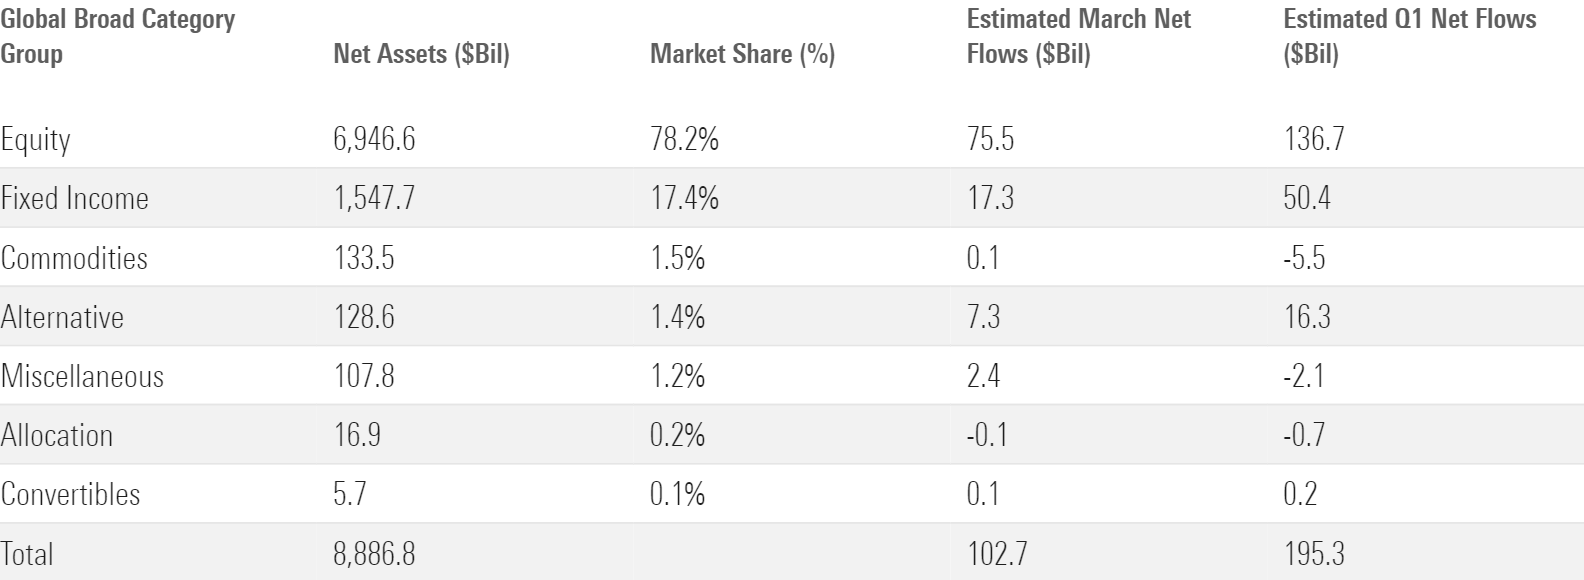
Stock ETFs hauled in $137 billion in the first quarter, $76 billion of which came in March alone, representing about 70% of all first quarter ETF flows. That’s shy of their market share entering the calendar year (78%) but marks an improvement from 2023, when their growth rate trailed upstart bond ETFs by a wide margin. Seasonality may be a factor, as some research finds that tax refunds and bonuses tend to spur strong equity flows in the first quarter.
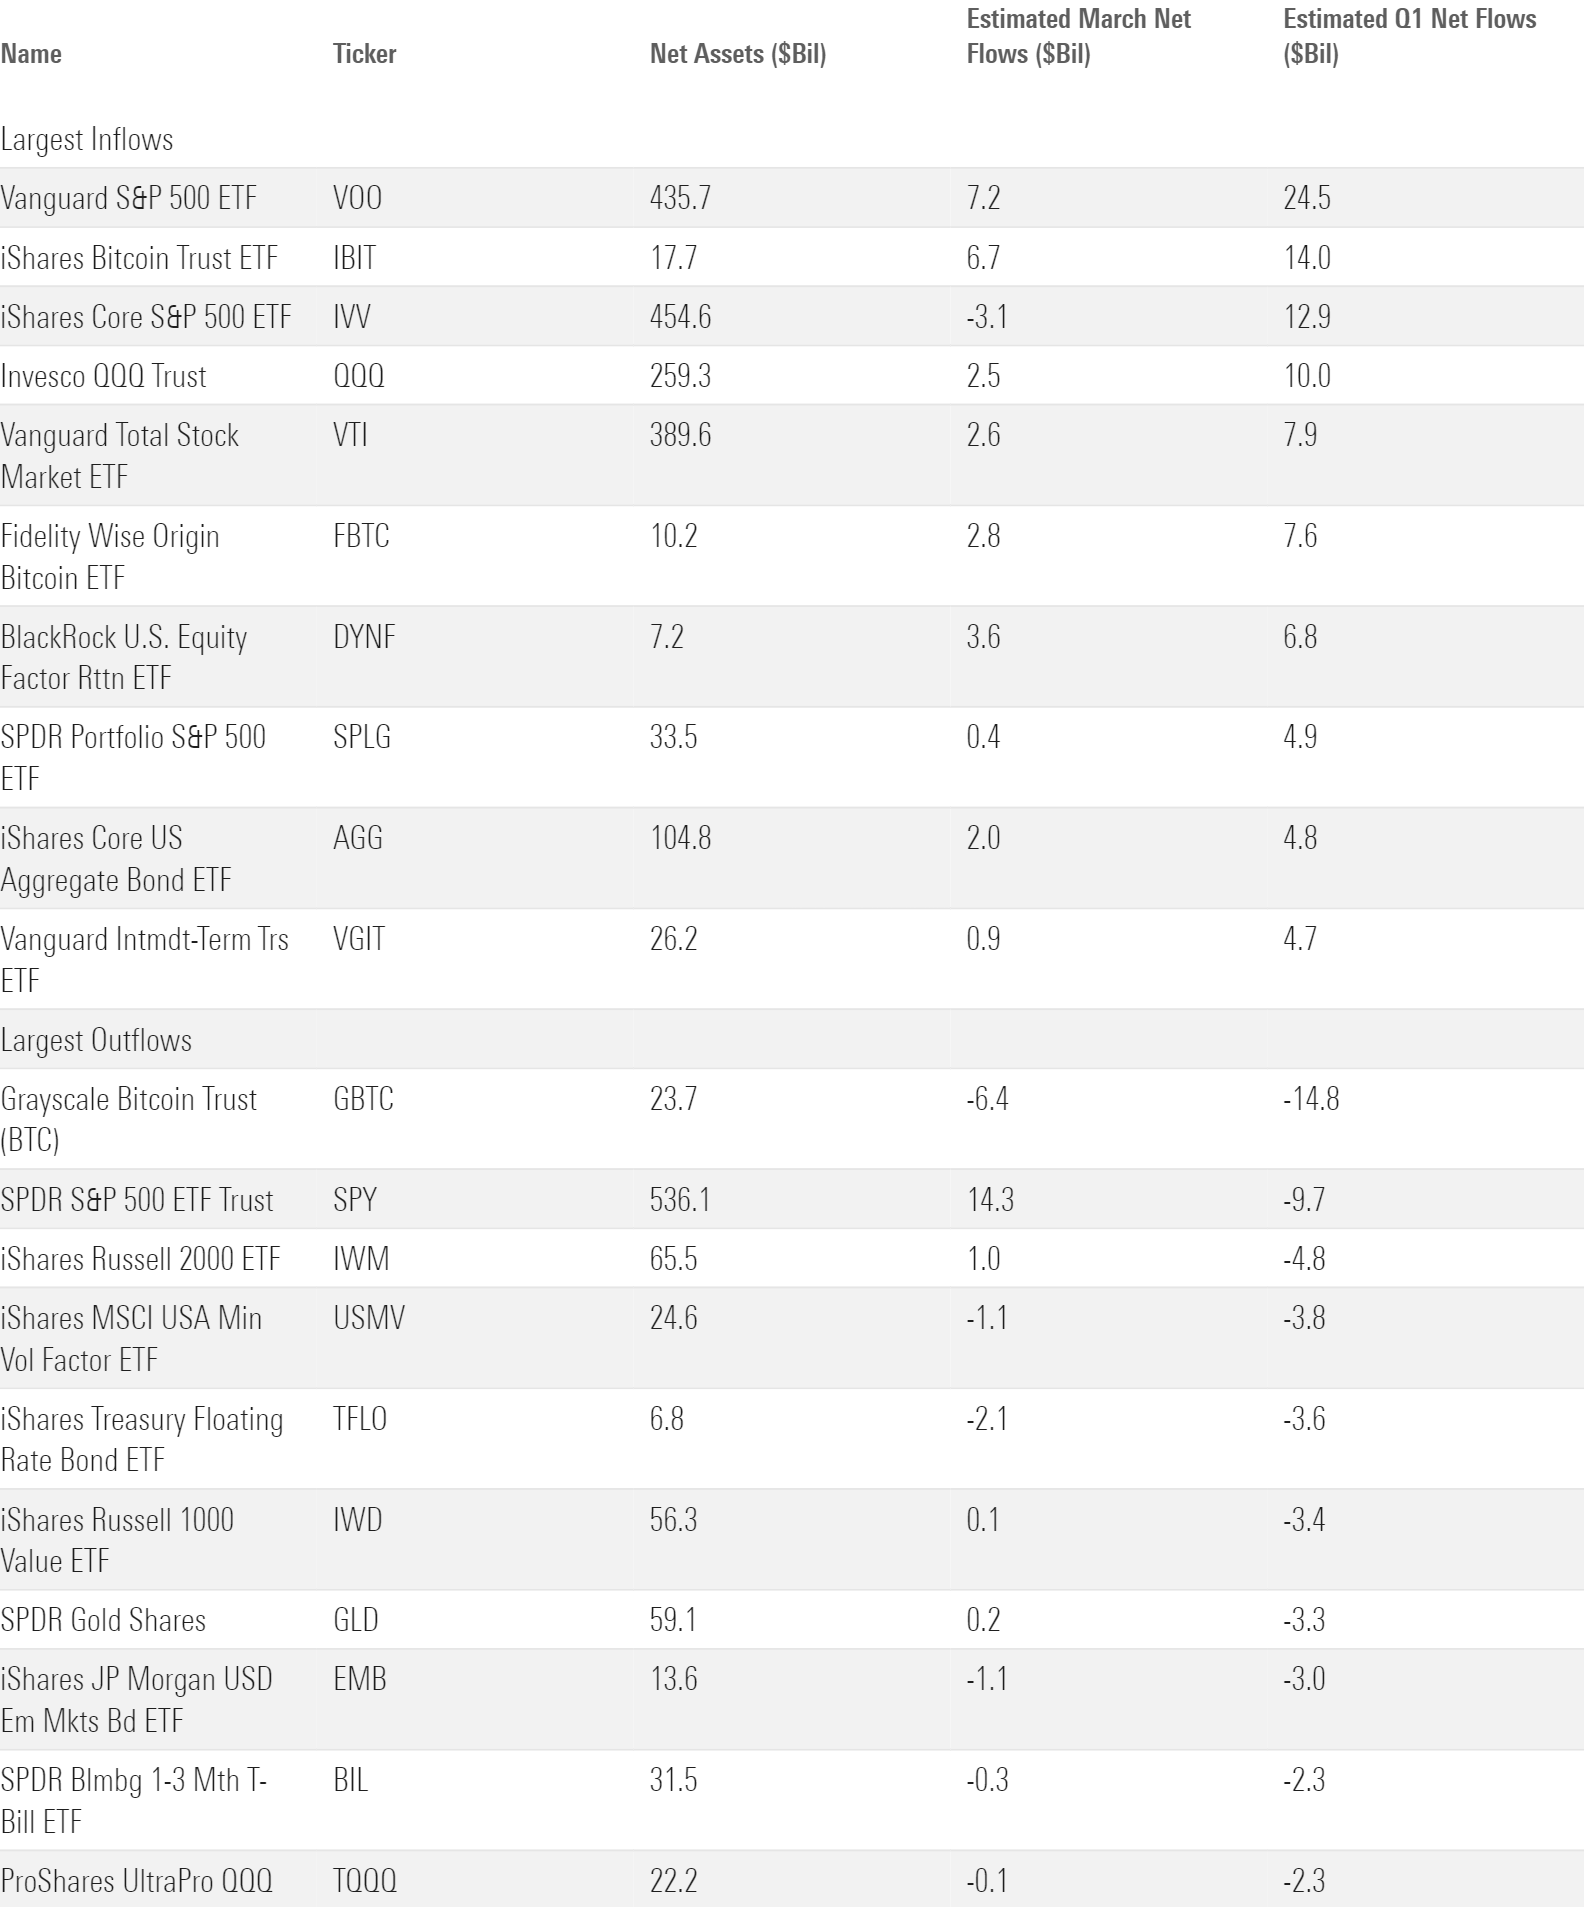
US large-blend ETFs customarily led the charge. These funds pulled in $32 billion in March to push their first quarter haul to $52 billion—more than one fourth of all ETF flows. Vanguard S&P 500 ETF VOO dominated the first quarter with nearly $25 billion of inflows alone. Fellow broad index trackers iShares Core S&P 500 ETF IVV and Vanguard Total Stock Market ETF VTI notched stellar starts as well. SPDR S&P 500 ETF Trust SPY, the most popular S&P 500 tracker, found itself on the wrong end of its notoriously volatile flows, shedding nearly $10 billion on the quarter.
A lucrative quarter for growth stock ETFs helped the US equity picture in the first quarter. Investors poured a record $25 billion into the large-growth category. Most funds in this category have benefited from the insatiable demand for the so-called Magnificent Seven stocks, but none more than Invesco QQQ Trust QQQ. The tech-heavy Nasdaq-100 tracker racked up $10 billion of new money in the first quarter, while its cheaper offshoot, Invesco Nasdaq 100 ETF QQQM, collected $2.8 billion of its own. Some of the Magnificent Seven stocks slowed down early in 2024, but the demand for funds that own them has not.
Other corners of the US equity space generated less enthusiasm. Roughly $5.5 billion of inflows constituted a solid first quarter for small-value ETFs, but the large- and mid-cap value categories didn’t snap out of their slumps. Similarly, small-blend and small-growth funds didn’t match their large-cap brethren’s popularity. In a sense, surging US equity flows have mirrored the surging US market: narrow and reliant on a few leaders to carry the broader group.
Q1 Flows Across Morningstar Broad Category Groups
2) International Stock ETFs Get a Boost from Japan and India
International equity ETFs corralled $28 billion in the first quarter, their best since the first quarter of 2023. Predictably, foreign large-blend funds led the pack. The category houses about half the international stock ETF assets and fittingly captured about half of its first quarter flows: $14.4 billion. A pair of Vanguard strategies, Vanguard FTSE Developed Markets ETF VEA and Vanguard Total International Stock ETF VXUS, hauled in more than $3 billion apiece.
Two country-specific categories, Japan stock and India equity, gave the international cohort a jolt. Both segments enjoyed breakout flows in 2023 and carried that momentum into 2024. Fresh off their best year of inflows since 2013, Japan stock funds collected $3.3 billion in the first quarter. That likely stems from performance: iShares MSCI Japan ETF EWJ climbed 11.2% in the first quarter as the Japanese stock market hit its first record high in decades. India equity ETFs didn’t perform quite as well but gathered $2.2 billion, a tidy sum for a category that entered 2024 with just $12 billion in assets.
3) Tech ETFs Mask Broader Sector-Equity Outflows
ETFs that concentrate on the technology sector raked in nearly $11 billion in the first quarter, their best quarter since the fourth quarter of 2020. Demand for artificial intelligence stocks powered the technology category, whose funds offer some of the purest exposure to those companies. Indeed, semiconductor ETFs fared particularly well. Three of the six most popular tech funds in the first quarter directly target the semiconductor industry. That included VanEck Semiconductor ETF SMH, whose $3.1 billion first quarter haul led all sector equity funds.
Look past technology, though, and sector equity flows get ugly. The other 15 categories in this group bled a combined $2.7 billion. Value-oriented sectors endured the worst of it. Utilities, financials, and energy funds, all of which sit on the cheaper side of the Morningstar Style Box, each shed north of $1 billion for the quarter. But brighter days may be coming for them. Each outgained the broad US market in March, the catalyst that some investors might need to rotate into cheaper corners of the market.
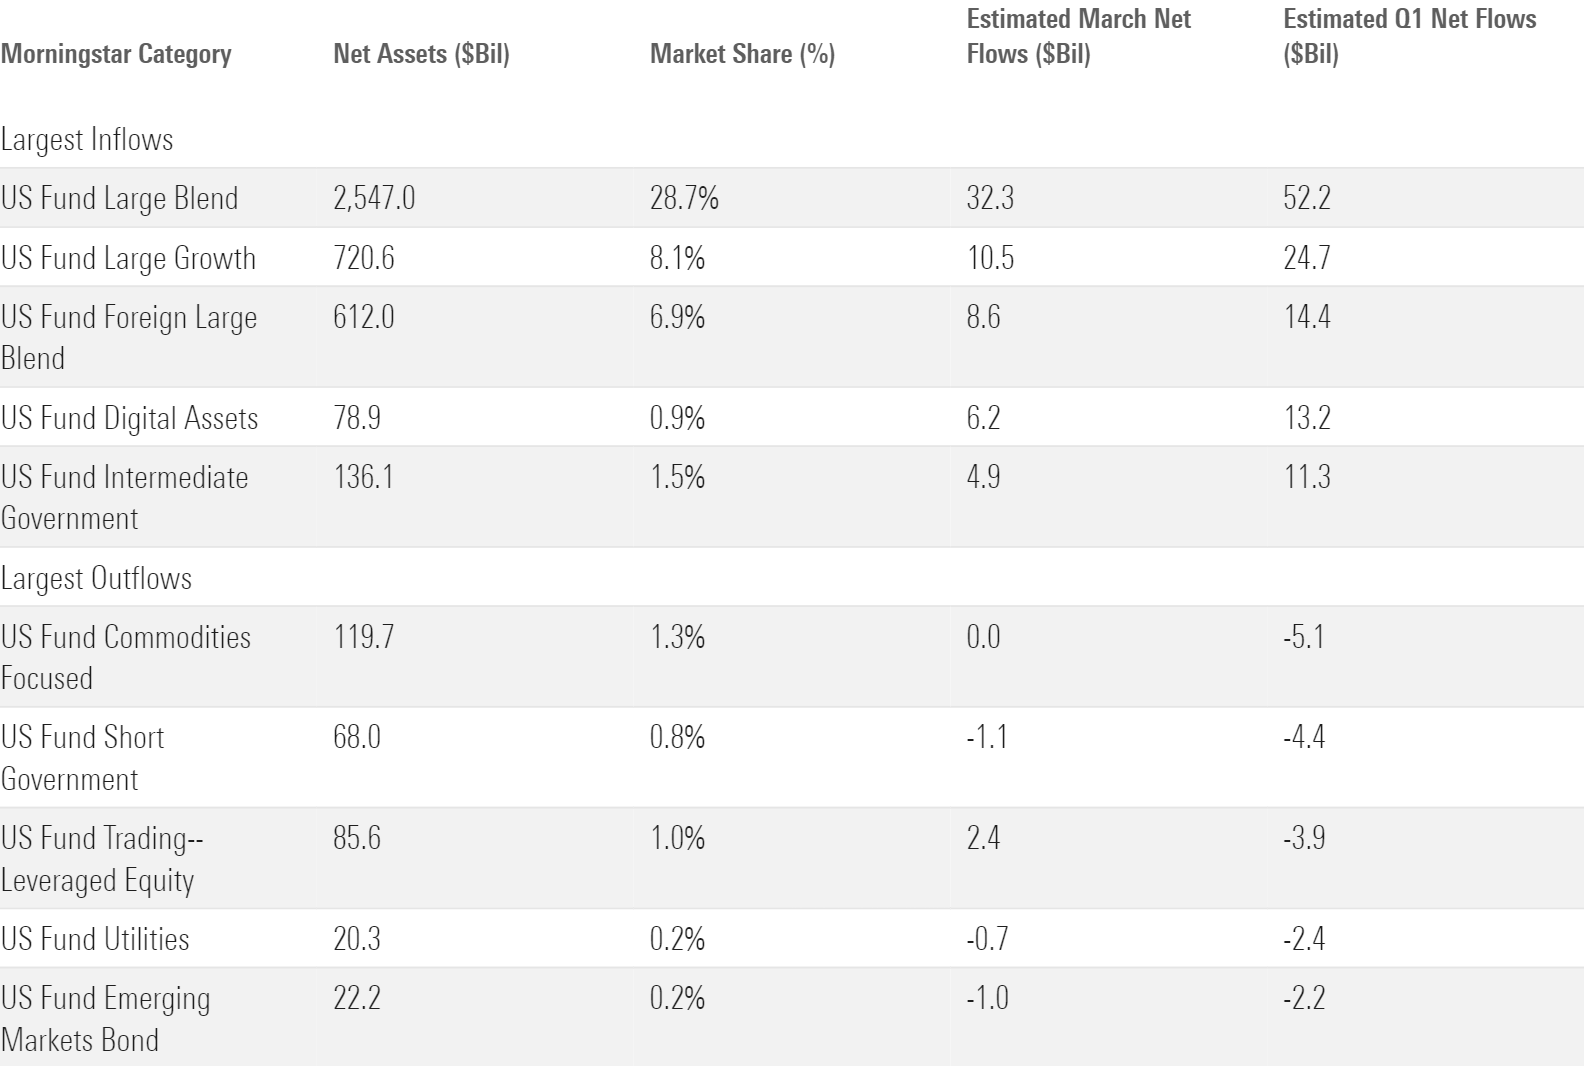
Morningstar Categories With the Largest Q1 Flows
4) Bond ETF Investors Stick to the Script
Bond ETF flows were solid if not spectacular in the first quarter. The cohort pulled in roughly $50 billion, near their quarterly average in 2023.
Investors targeted the intermediate-term categories, where bond maturities normally range between three and seven years. The intermediate government category paced the fixed-income space with $11 billion of first quarter inflows, followed by intermediate core ($10 billion) and core-plus strategies ($8.3 billion). Bond ETFs have been a popular mechanism for investors to bet on the direction of interest rates over the past few years. After more stubborn inflation data pushed back the timeline for interest-rate cuts, it seems many investors are now keen to wait and see in the middle of the yield curve.
Government bond funds were popular in the first quarter, but that doesn’t mean credit risk was out of style. Corporate-bond ETFs collected $7.1 billion, maintaining the momentum from strong flows in late 2023. Bank-loan and high-yield bond ETFs each cleared north of $1.5 billion in net flows—hardly a record-setting effort, but a good sign after flows into both categories waxed and waned in 2023.
ETFs With the Largest Q1 Flows
5) Target Maturity Bonds Expand Their Footprint
ETFs in the target maturity category reeled in $5.4 billion in the first quarter, good for an organic growth rate of 15.4%. These funds feature bonds that all mature in the same month. Instead of trading holdings to preserve a maturity range like most bond funds, these strategies hold their bonds until they mature and shut down thereafter. Target-maturity ETFs enable investors to build their own bond ladders without the complexity and credit concerns that come with individual bonds.
Investors have welcomed these products into their ETF toolbox. Target-maturity ETFs cracked $12 billion in inflows in each of the past two years. After a strong first quarter, they are poised to push even higher in 2024.
6) Active ETFs Aren’t Slowing Down
Active ETFs were all the rage in 2023, and a turn of the calendar hasn’t dented their popularity. Investors poured nearly $66 billion into them in 2024′s opening quarter. Removing bitcoin ETFs—technically not index trackers but hardly actively managed—leaves active ETFs with $50 billion in first quarter flows, which still breaks the record they set in the previous quarter.
Active stock ETFs tallied nearly $20 billion in first quarter flows to lead the active party. BlackRock US Equity Factor Rotation ETF DYNF reeled in $6.8 billion, putting it at the tip of the spear. Launched in 2019, this fund toiled below the $1 billion mark before exploding in early 2024. Its addition to some of BlackRock’s model portfolios likely explains the breakout—a reminder of the power those models wield. Beyond DYNF, offerings from J.P. Morgan, Avantis, Capital Group, and Dimensional stayed in vogue.
Actively managed bond ETFs gathered about $18 billion in the first quarter. BlackRock Flexible Income ETF BINC, the brainchild of 2023 Outstanding Portfolio Manager Rick Rieder, topped the list as it hauled in $2.2 billion. Janus Henderson AAA CLO ETF JAAA finished closely behind with $2.1 billion first quarter flows of its own.
Active ETFs Aren't Slowing Down
7) Sustainable ETF Flows Run out of Gas
Annual flows into sustainable ETFs crescendoed each year from 2015 through 2021, finishing that year with a $42 billion haul. Flows have backed down since then: Sustainable funds gathered a tepid $4 billion in 2022, then saw $8 billion leave in 2023. In the first quarter of 2024, sustainable ETFs lost $4.8 billion—their worst since last year’s opening stanza. A pair of iShares ETFs, iShares ESG MSCI USA Leaders ETF SUSL and iShares ESG Aware MSCI USA ETF ESGU, shed roughly $2 billion apiece over the past three months.
The outlook for sustainable ETF flows is hazy. Optimists could cite the value rally in 2022 as tough conditions for these growth-oriented funds. Others may point to softer equity flows in 2023 as an unfavorable backdrop. But it’s hard to lean on those explanations when flows into stock ETFs—specifically growth-stock ETFs—thrived in the first quarter of 2024. The last best rationalization may be that investors are fleeing everything that doesn’t pile into the Magnificent Seven (SUSL omits four of them, while ESGU includes all seven but in smaller proportions than most index funds). If that explanation gets foiled, it may just be that sustainable ETFs were more flash in the pan than a staple in the ETF cupboard.
8) Bitcoin ETFs Burst Out of the Gates
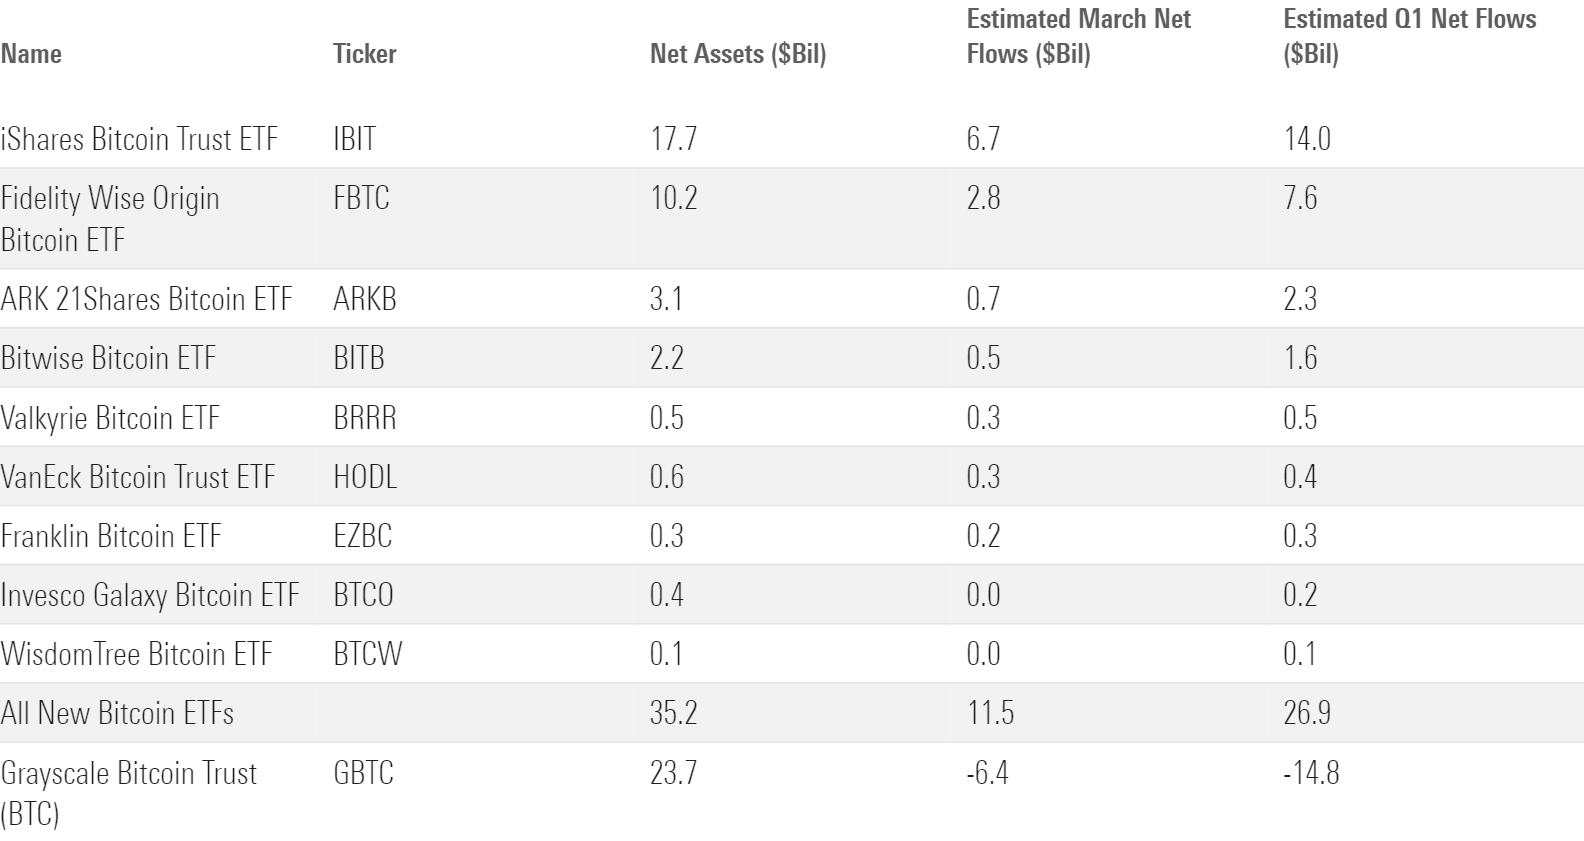
When the first spot bitcoin ETFs hit the market in January 2024, investors welcomed them with open arms. It’s now clear these products have staying power: the “new nine” spot bitcoin ETFs raked in nearly $12 billion in March, their best month yet. When the book closed on the first quarter, the new spot bitcoin ETFs had garnered about $27 billion of inflows and totaled more than $35 billion, aided by bitcoin’s 60% surge in the first quarter.
So far, iShares looks like the winner of the bitcoin ETF arms race. IShares Bitcoin Trust ETF IBIT has pulled in $14 billion since launching in mid-January, nearly double its next-closest competitor, Fidelity Wise Origin Bitcoin ETF FBTC. Bitcoin offerings from the likes of WisdomTree, Invesco, and Franklin haven’t quite taken root, but the real loser thus far is Grayscale Bitcoin Trust (BTC) GBTC. The trust-turned-ETF lost its stranglehold on the bitcoin ETF market when the “new nine” entered the fold, new competition that sparked nearly $15 billion of outflows—by far the most of any ETF in that span.
The New Bitcoin ETFs Made a Stellar Debut
9) ETF Providers: Full Speed Ahead for Vanguard
Vanguard, the annual ETF flows leader four years running, jumped out to another commanding lead in early 2024. The indexing giant gathered $66 billion in the first quarter, about $30 billion ahead of runner-up iShares.
Q1 Flows for the 10 Largest ETF Providers
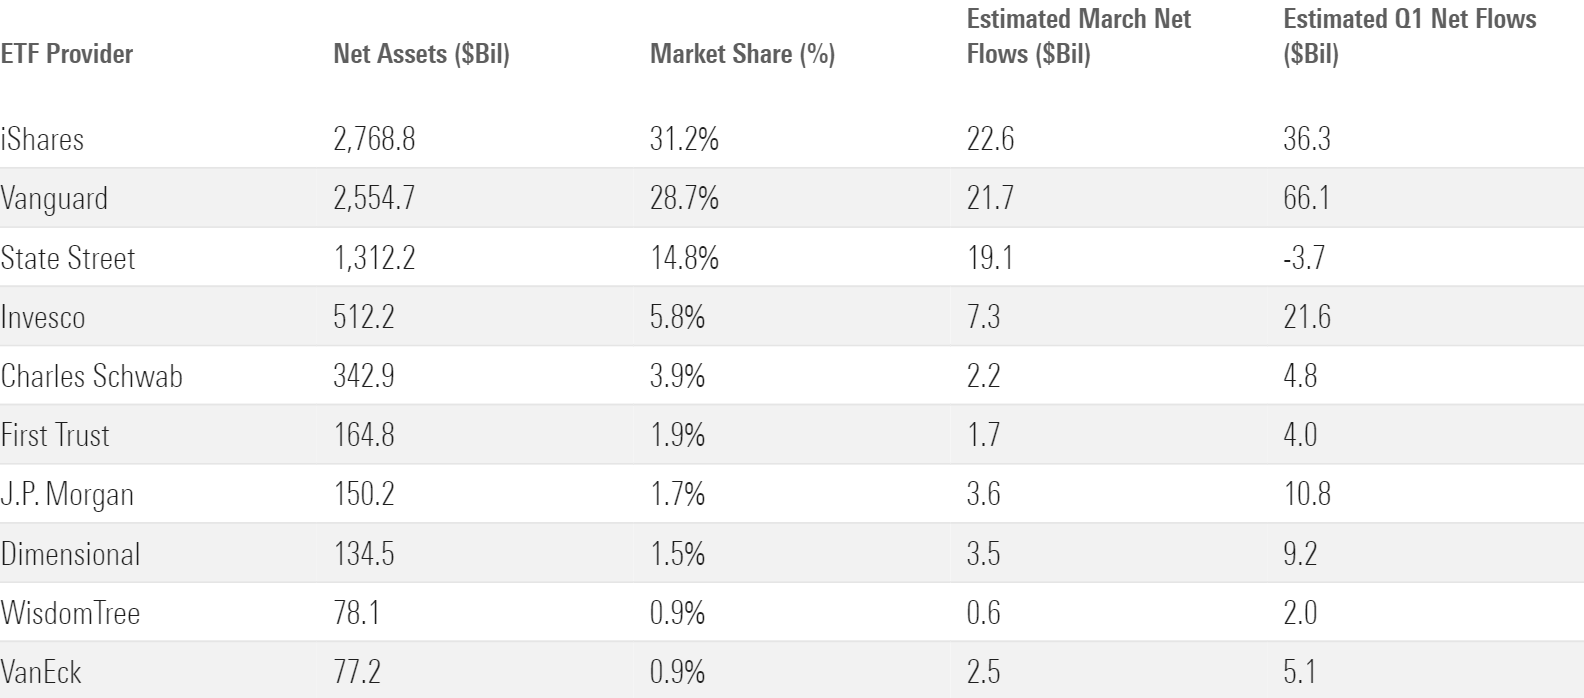
The formula hasn’t changed for Vanguard. Its lineup of very cheap, broad index trackers is a known commodity for the investors that dutifully march into them. The US stock lineup led with $43 billion in first quarter inflows, though the $11 billion that its taxable-bond funds hauled in translated into a slightly better growth rate. Whether markets are up, down, or sideways, Vanguard tends to register positive net flows, a testament to a disciplined investor base that is in it for the long haul.
IShares finished second with $36 billion of new money. Its bitcoin ETF came not a moment too soon. Subtract that from the lineup, and iShares would have pulled in just one third the flows of Vanguard, its main rival who has steadily eaten into its market share in recent years.
For iShares to hold off Vanguard and fortify its place as the number-one ETF provider, it needs to measure up better in the US equity arena. Its US stock ETFs drew just $4 billion of net flows in the first quarter. Outflows from sustainable ETFs and the firm’s strategic-beta lineup plagued the overall stock ETF picture—the same problems it grappled with in 2023. US stock ETFs represent a slightly smaller share of iShares’ total portfolio than Vanguard’s. But that’s the largest category group in the ETF market and a place where iShares cannot afford to keep losing ground.
What’s Cheap?
The fair value estimate for ETFs rolls up our equity analysts’ fair value estimates for individual stocks and our quantitative fair value estimates for stocks not covered by Morningstar analysts into an aggregate fair value estimate for stock ETF portfolios. Dividing an ETF’s market price by this value yields its price/fair value ratio. This ratio can point to potential bargains and areas of the market where valuations are stretched.
The 10 Most Under- and Overvalued Analyst-Rated ETFs.
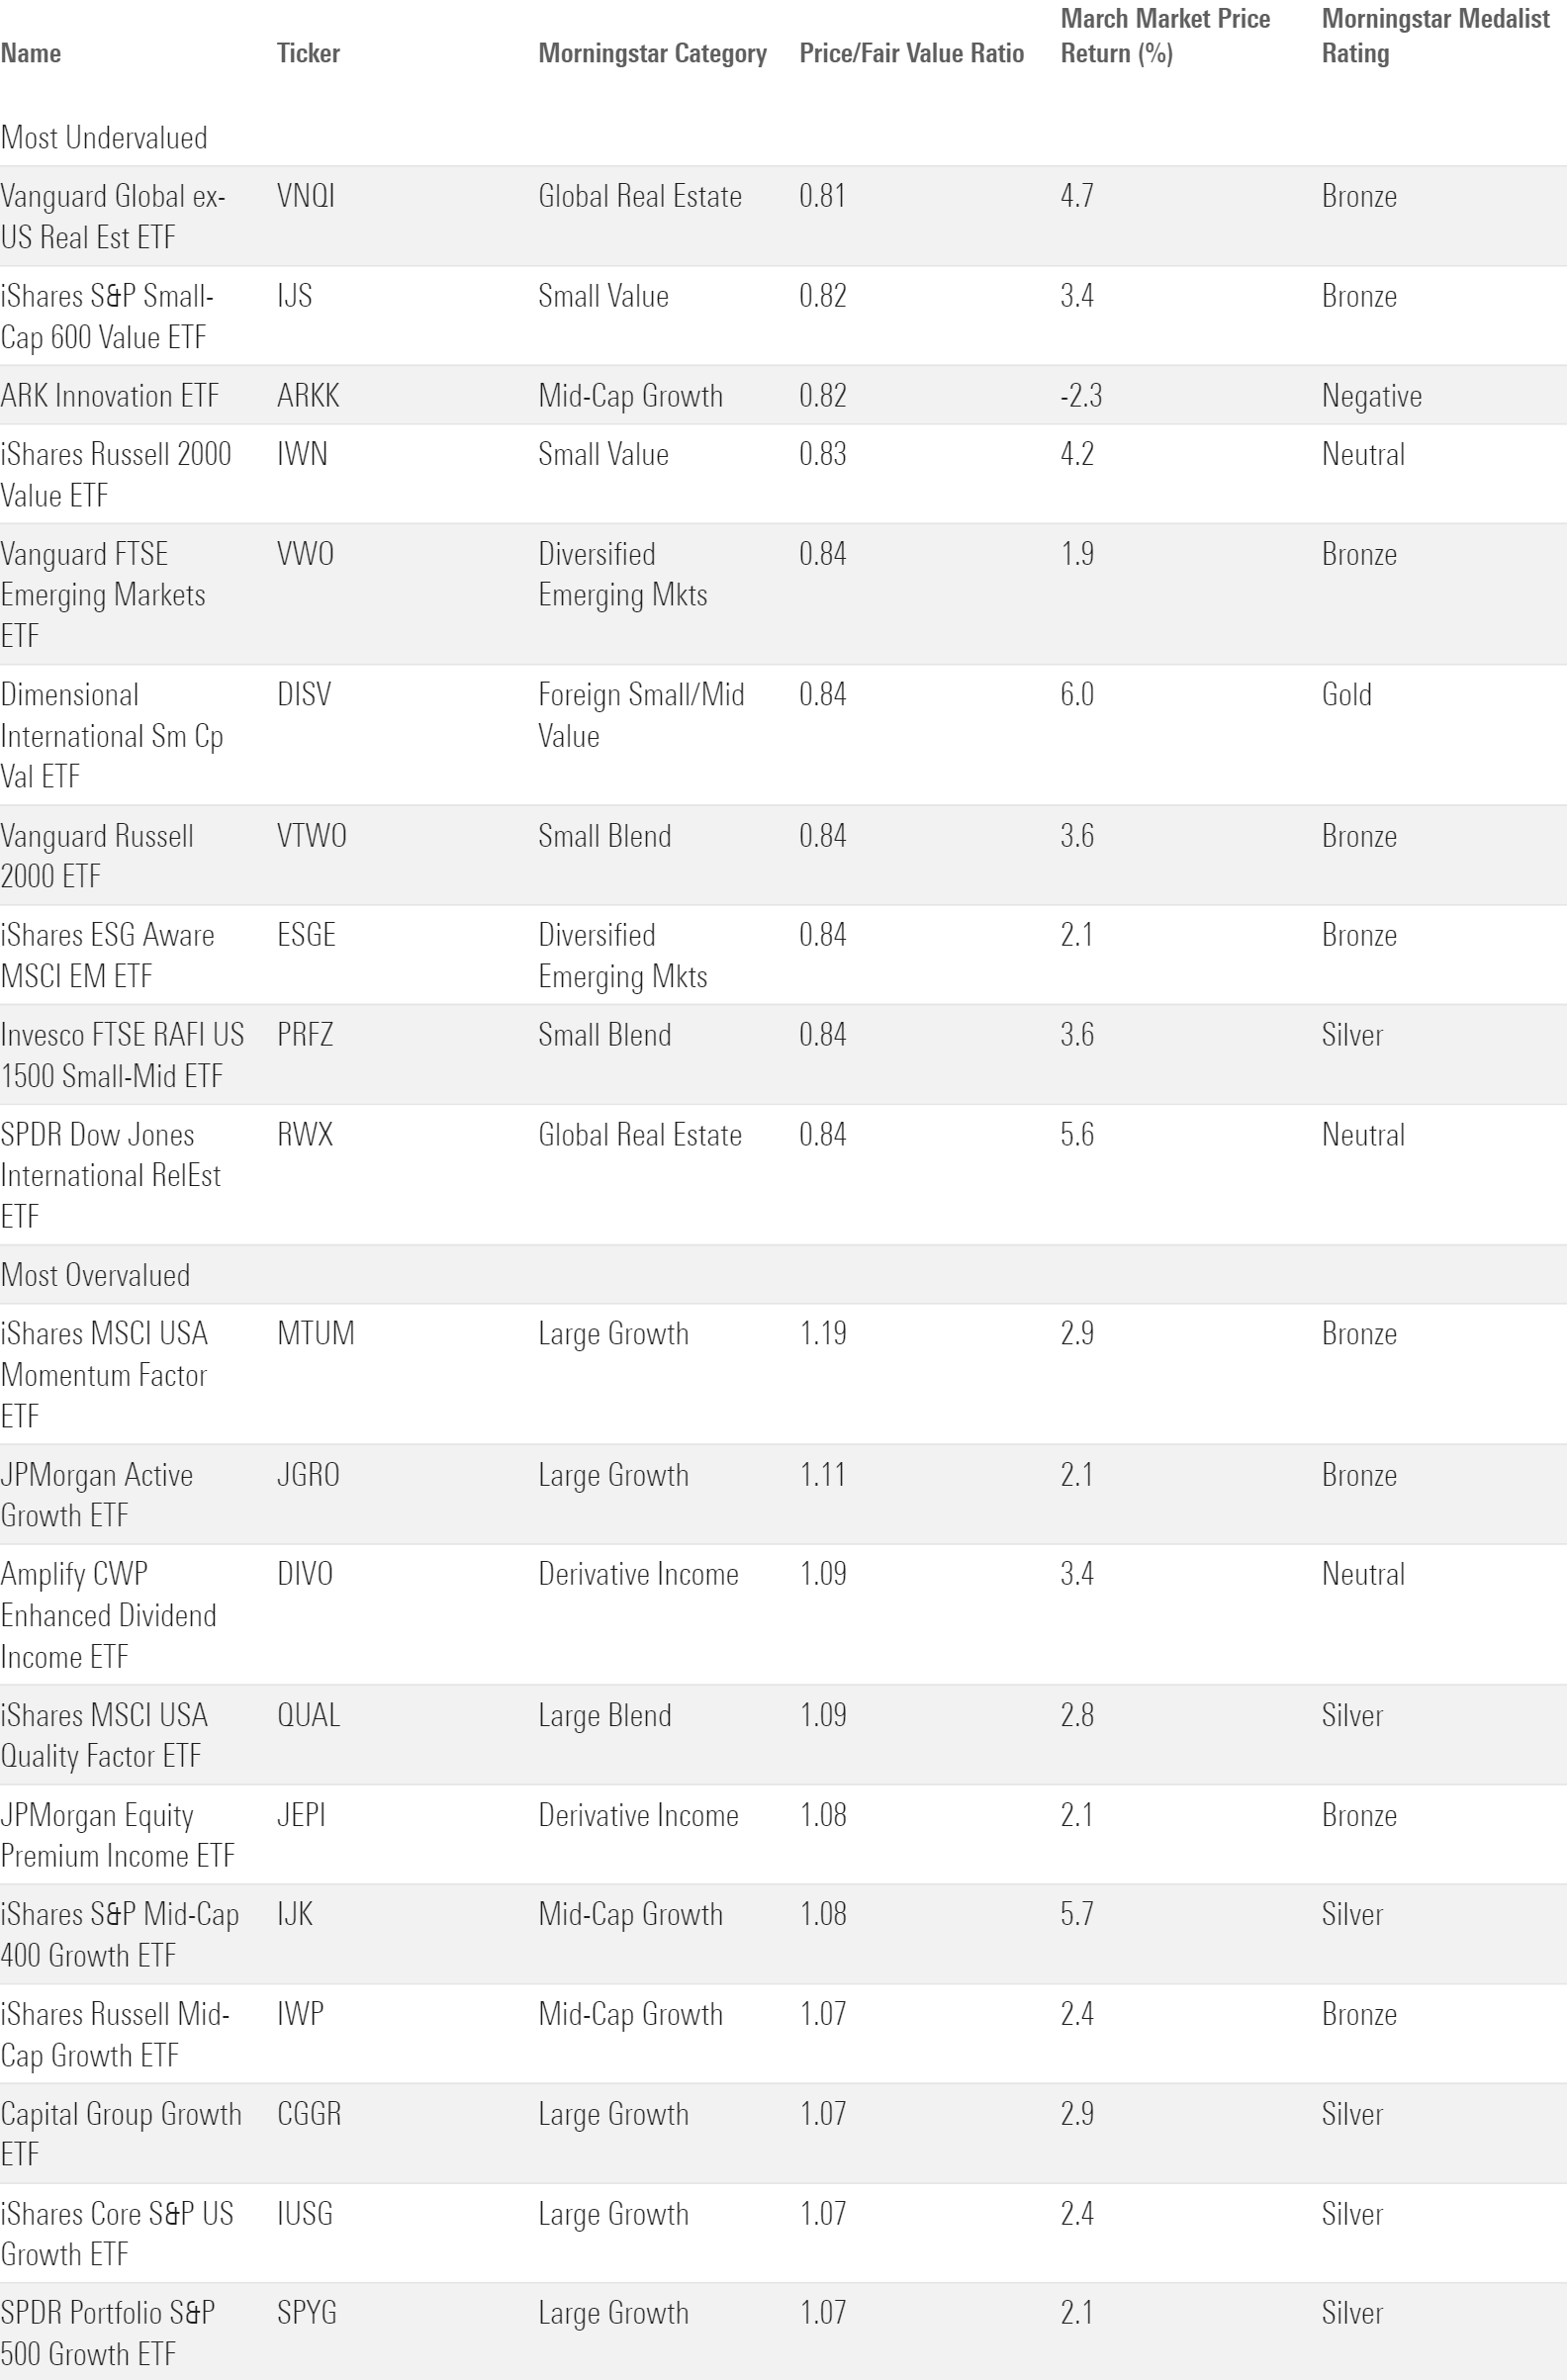
Morningstar published its second quarter market outlook this week. It highlights two areas of the US market that look most undervalued: value and small-cap stocks.
In the large-value category, iShares MSCI USA Value Factor ETF VLUE is one of the most undervalued options. It traded at an 8% discount as of April 2, 2024, even after climbing 6.0% in March. VLUE targets cheap stocks but ties its sector composition to the broad market, meaning investors won’t surrender exposure to technology and the other sectors that value strategies normally eschew. For those seeking an active option, T. Rowe Price Equity Income ETF TEQI sports a Morningstar Medalist Rating of Silver (as of March 2024) and a 9% discount. Large-cap equities have been a hard place for active managers to deliver value, however, one of the findings from the latest Morningstar Active/Passive Barometer released in March.
For small caps, investors may check out Vanguard S&P Small-Cap 600 ETF VIOO, another Silver-rated fund that trades 15% below its fair value. This strategy covers a broad swath of the US small-cap market and weights it by market cap. It includes a profitability screen that filters out many of the riskiest companies, a key advantage when dealing in the small-cap market.
The author or authors do not own shares in any securities mentioned in this article. Find out about Morningstar’s editorial policies.
/cloudfront-us-east-1.images.arcpublishing.com/morningstar/24UPFK5OBNANLM2B55TIWIK2S4.png)
/d10o6nnig0wrdw.cloudfront.net/04-25-2024/t_29c382728cbc4bf2aaef646d1589a188_name_file_960x540_1600_v4_.jpg)
/cloudfront-us-east-1.images.arcpublishing.com/morningstar/T2LGZCEHBZBJJPPKHO7Y4EEKSM.png)
:quality(80)/s3.amazonaws.com/arc-authors/morningstar/30e2fda6-bf21-4e54-9e50-831a2bcccd80.jpg)