
ETF Flows: Investors Do the Digital Dash in February
ETFs raked in $58 billion courtesy of enthusiasm around US stocks, technology, and bitcoin.
/s3.amazonaws.com/arc-authors/morningstar/30e2fda6-bf21-4e54-9e50-831a2bcccd80.jpg)
Key Takeaways
- The Morningstar Global Markets Index, a broad measure of worldwide equities, climbed 4.17% in February after a lackluster start to the year.
- Strong economic data weighed on bonds, spelling a 1.41% decline for the Morningstar US Core Bond Index in February.
- US exchange-traded funds hauled in about $58 billion in February.
- ETFs that weave portfolios of fast-growing technology stocks were some of the month’s most popular.
- The “New Nine” spot bitcoin ETFs raked in about $9 billion and reached $20 billion in assets less than two months after their debut.
- Vanguard led all ETF providers with more than $27 billion of February net flows, more than triple the runner-up.
Bonds Pull Back
Exhibit 1 shows the February 2024 returns for a sample of Morningstar analyst-rated ETFs that serve as proxies for major asset classes. Global equities enjoyed a strong month, but bond losses weighed on the global blended portfolio and held its February return to 2.3%. Vanguard Total Bond Market ETF BND slid 1.4% in its worst month since October 2023, while Vanguard Total International Bond ETF BNDX peeled back 0.5%.
February Market Performance through the Lens of Analyst-Rated ETFs
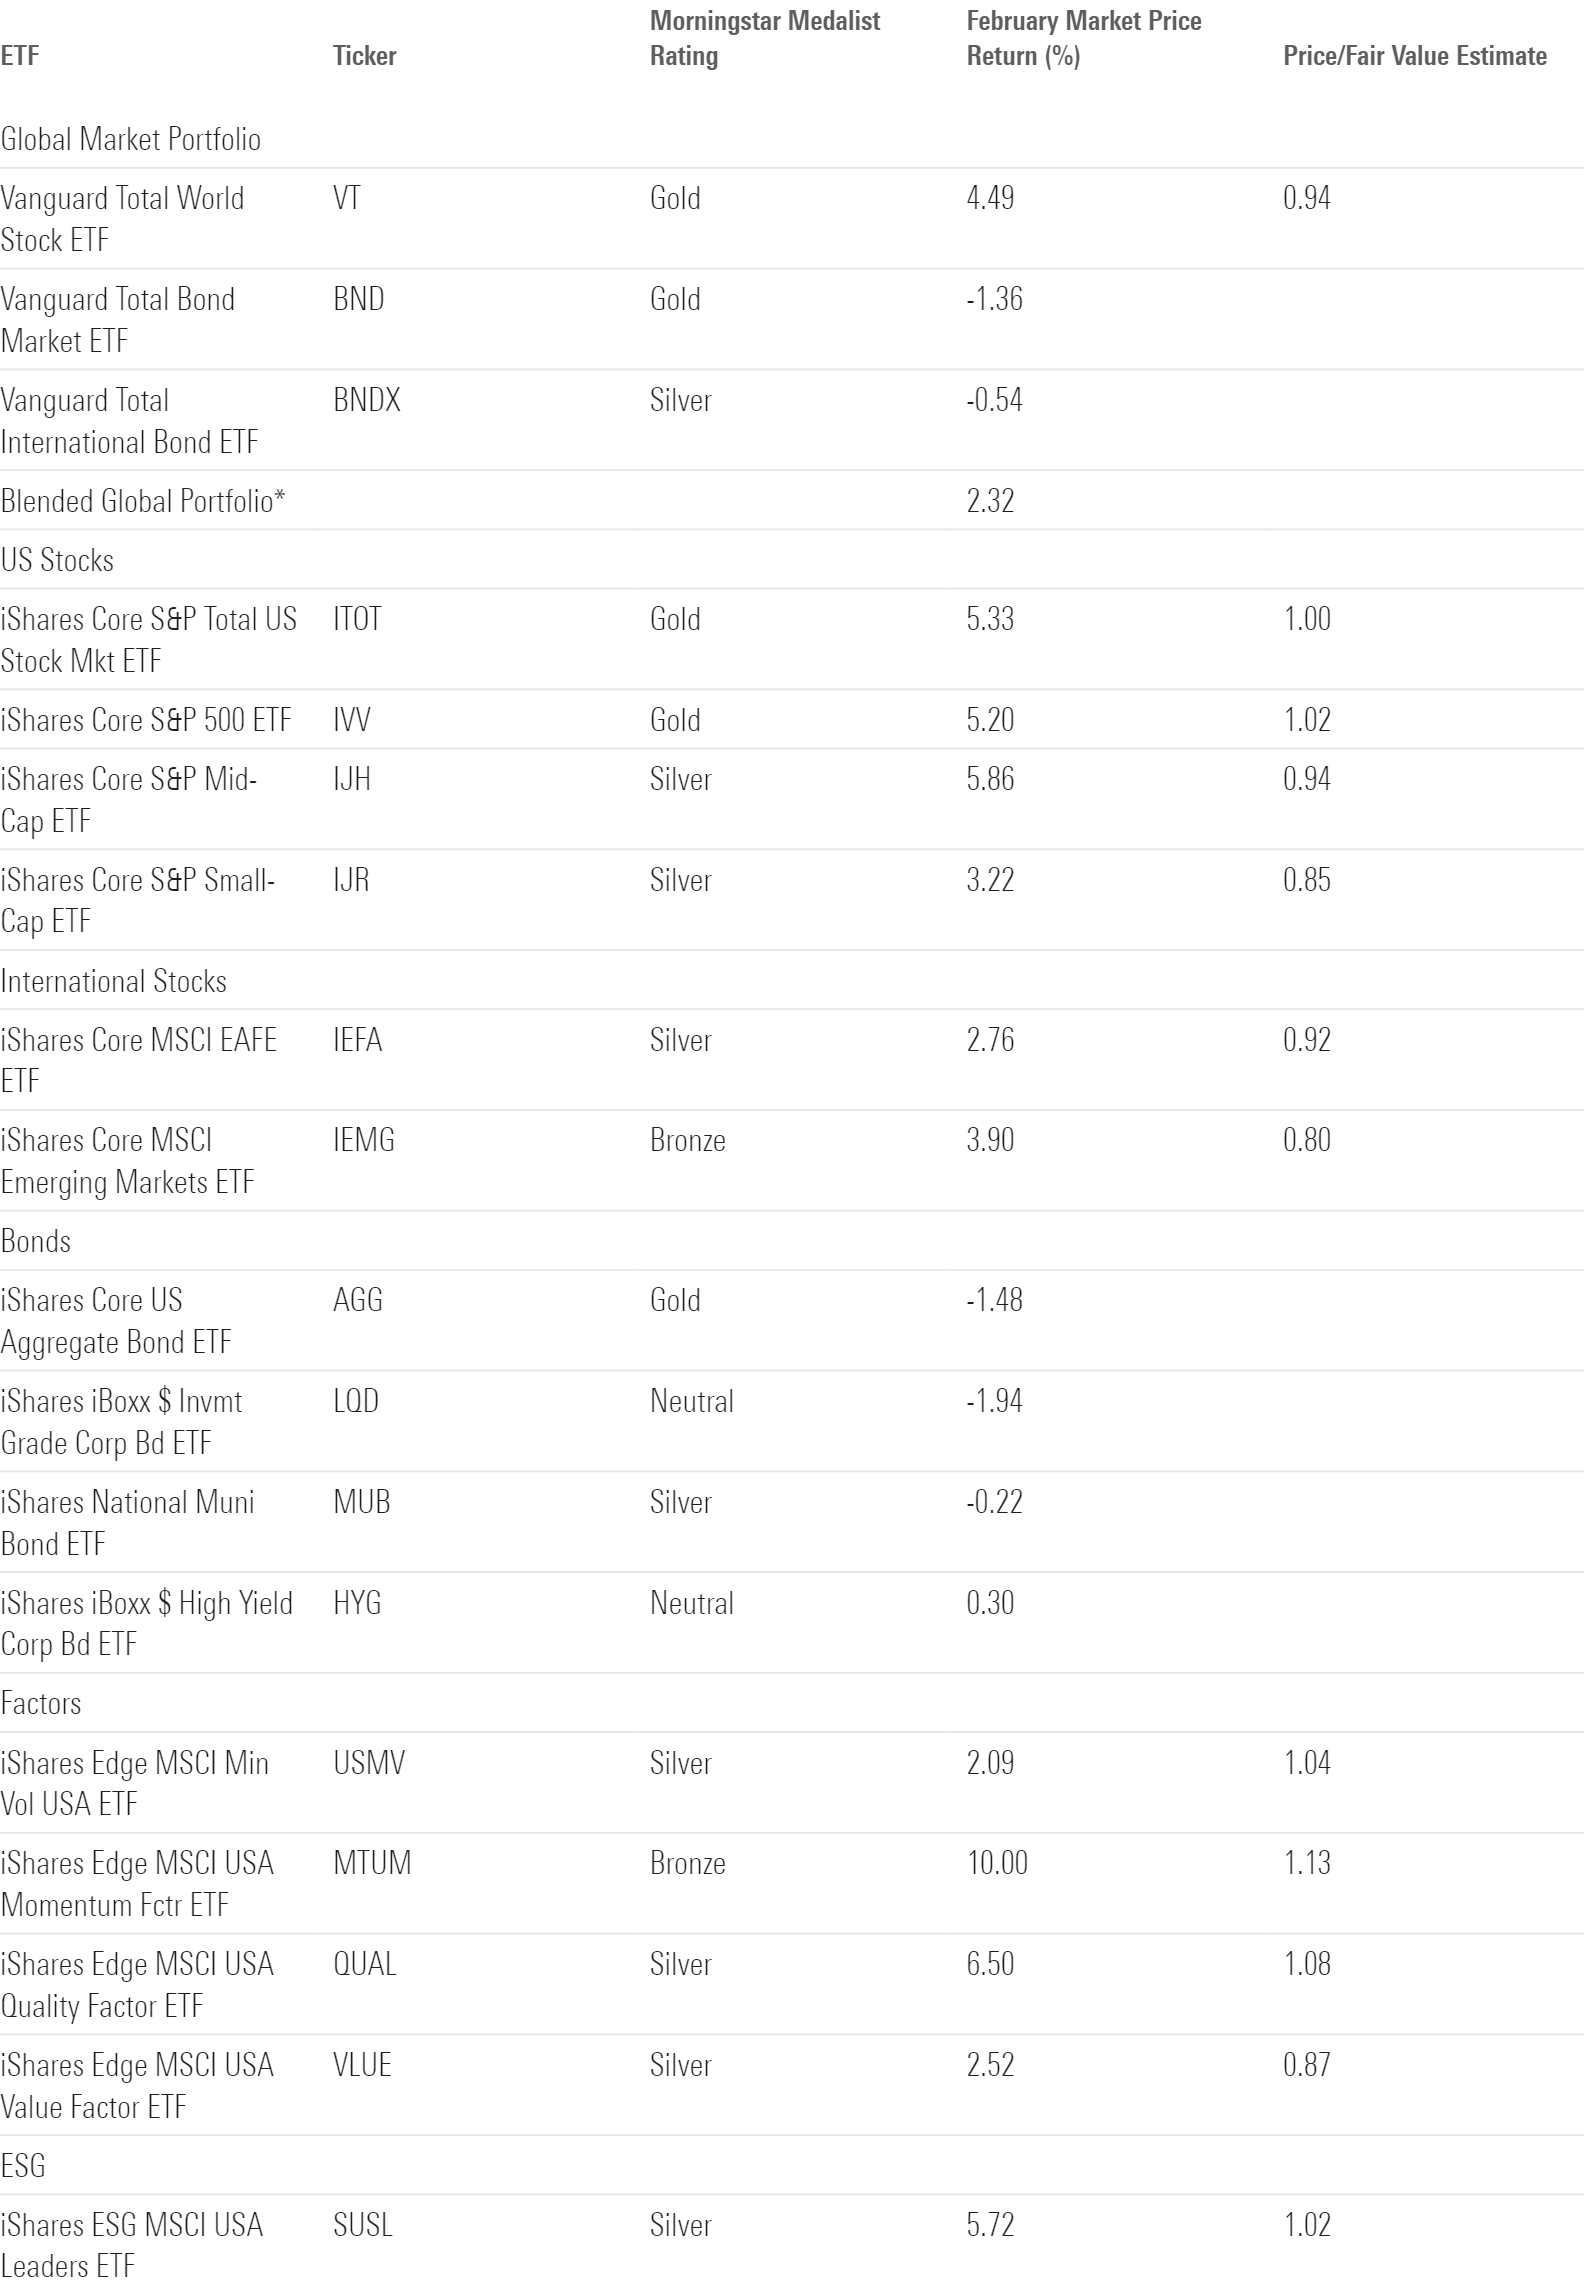
Many bond investors eager for interest-rate cuts are waiting longer than they anticipated. The economic data released in February did little to speed up the timeline. Warmer-than-expected manufacturing and labor data weighed on bond returns early in the month. And when January inflation data registered above expectations, any hopes that the Fed would slash rates at its March meeting all but evaporated. At the end of February, futures contracts implied just a 3% chance of March interest-rate cuts and a 25% chance of May reductions. Many investors banked on a barrage of 2024 rate cuts just a few months ago, but economic data has forced them to recalibrate expectations.
February’s economic data hit longer-dated bond portfolios the hardest. IShares 20+ Year Treasury Bond ETF TLT sank 2.3% on the month. A popular instrument for investors wagering on imminent rate cuts, this portfolio of long-term Treasuries has teetered in recent months. Over the final two months of 2023, it notched a 19.3% gain when rates looked destined for a downward trajectory. But 2024 threw cold water on that optimism, pushing the fund to a 4.5% drawdown over the year’s opening two months.
Stocks Take a Leap
Global equities leapt forward during the 29-day February, as Vanguard Total World Stock ETF VT notched a 4.5% gain after a flat January.
US stocks set the tone. Vanguard Total Stock Market ETF VTI advanced 5.3% in a slightly more balanced rally than the concentrated push it experienced last year. IShares Core S&P 500 ETF IVV gained 5.2% after 71% of its constituents finished the month in the black. Mid-cap stocks fared the best—iShares S&P Mid-Cap ETF IJH jumped 5.9%—but small caps trailed their larger peers. While long-maturity bond investors are surely rooting the hardest for interest rates to simmer, small-cap investors may not be far behind. Smaller companies tend to rely more heavily on floating-rate debt. That raises their cost of doing business, a gravity that may explain the lackluster performance of iShares S&P Small-Cap ETF IJR and other small-cap strategies.
A fresh chapter in the artificial intelligence story catalyzed US stocks in February. Semiconductor manufacturer Nvidia NVDA, whose earnings reports act as a referendum for AI demand, blew past very lofty expectations when it reported on Feb. 21. Its otherworldly results powered it to a 28.6% February gain, lifting the semiconductor industry and technology sector along with it. Huge February gains from fellow Magnificent Seven heavyweights Meta Platforms META (25.8%) and Amazon.com AMZN (13.9%) also helped propel the market.
Supercharged AI demand and other excellent earnings reports proved a useful formula for ETFs tracking growth indexes. Vanguard Growth ETF VUG climbed 7.1%, more than doubling Vanguard Value ETF’s VTV 3.4% February return. VUG has soared nearly 61% since the start of 2023. It should continue to dominate its value twin as long as mega-cap technology stocks dominate the market. At the end of February, it sported a $486 billion average market cap, about 4.5 times the size of VTV’s.
Few strategies have kicked off 2024 on a better note than iShares MSCI USA Momentum Factor ETF MTUM. The high-octane strategy ranked in the large-growth Morningstar Category’s cellar in 2023, 1,201st out of 1,206 funds. Bad luck had a lot to do with it: The ever-changing portfolio constantly found itself on the wrong side of changes in market leadership. But the market’s best-performing stocks in late 2023 have stayed hot into 2024, giving MTUM the time it needs to ride the wave. It gained an even 10% in February and 16.2% for the year to date, among the best 2% of large-growth funds. MTUM will rely on a similar playbook moving forward. When it rebalanced on Feb. 29, it boosted its technology stake to 45% but made only modest changes elsewhere.
Foreign stocks finished behind their domestic peers but managed a solid month. Vanguard bounced back from a January decline with a 2.9% return in February. Asia-Pacific stocks carried the day. China stocks provided a jolt—the Morningstar China Index advanced 8.3% after a dreadful January—and Japan stacked another strong effort. IShares MSCI Japan ETF EWJ gained 4.4%, its fourth consecutive month returning at least 3%. That came as Japanese stocks reached an all-time high for the first time since 1989, a cathartic milestone several decades in the making.
IShares Core MSCI Europe ETF IEUR added 2.3% behind solid growth from the “Granolas” stocks. The latest acronym to grace the exchanges describes 11 European mega-cap companies that have driven a disproportionate share of Europe stock-index gains, much like the Magnificent Seven stateside. Though these companies are scattered around Europe, eurozone stocks fared much better than the rest of the continent in February. IShares MSCI Eurozone ETF EZU advanced 4.0% on the month, while Morningstar indexes tracking UK and Switzerland stocks pulled back.
ETF Flows
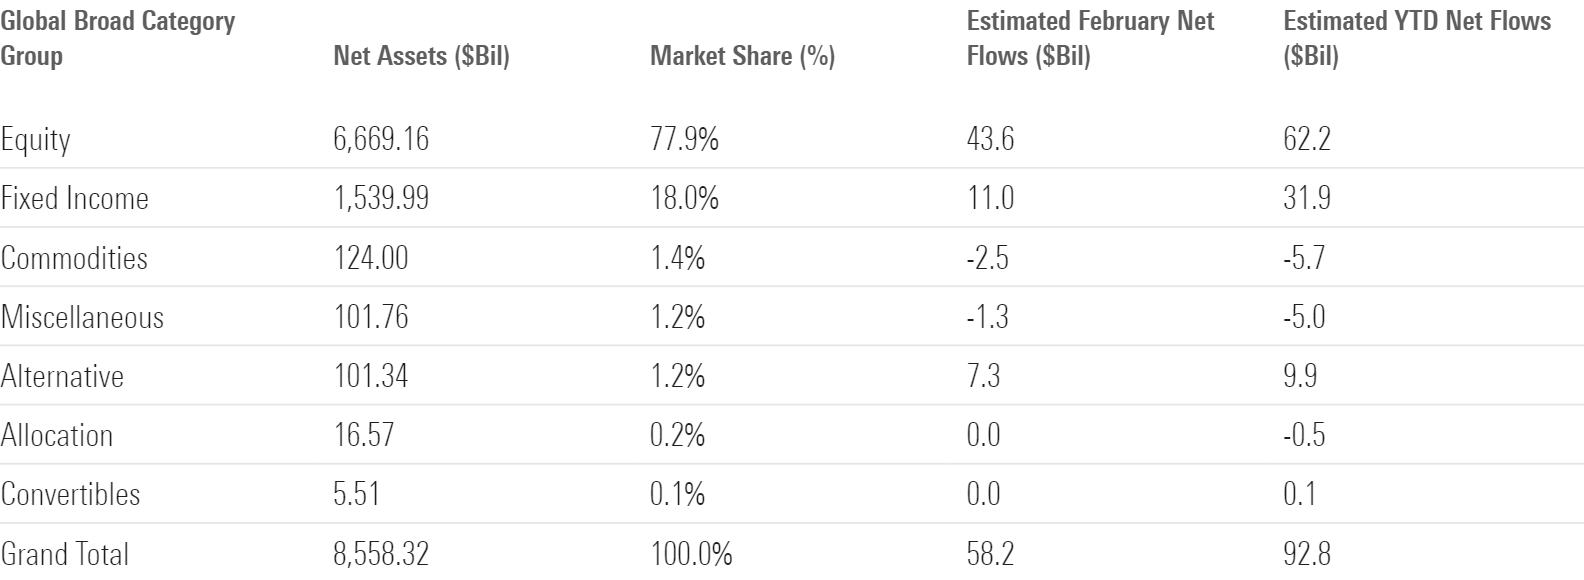
ETFs enjoyed solid inflows in February. Investors sank about $58 billion into them, roughly in proportion to each asset class’ starting size. Stock ETFs represent about 78% of the market and claimed 75% of the month’s net flows, while bond ETFs’ 18% market share nearly mirrored their 19% February flow share. Alternatives were the outlier. Outsize flows into bitcoin ETFs earned the alternative category group about 12% of the month’s net flows despite its 1% market share.
February Flows across Morningstar Broad Category Groups
Stock ETF Flows
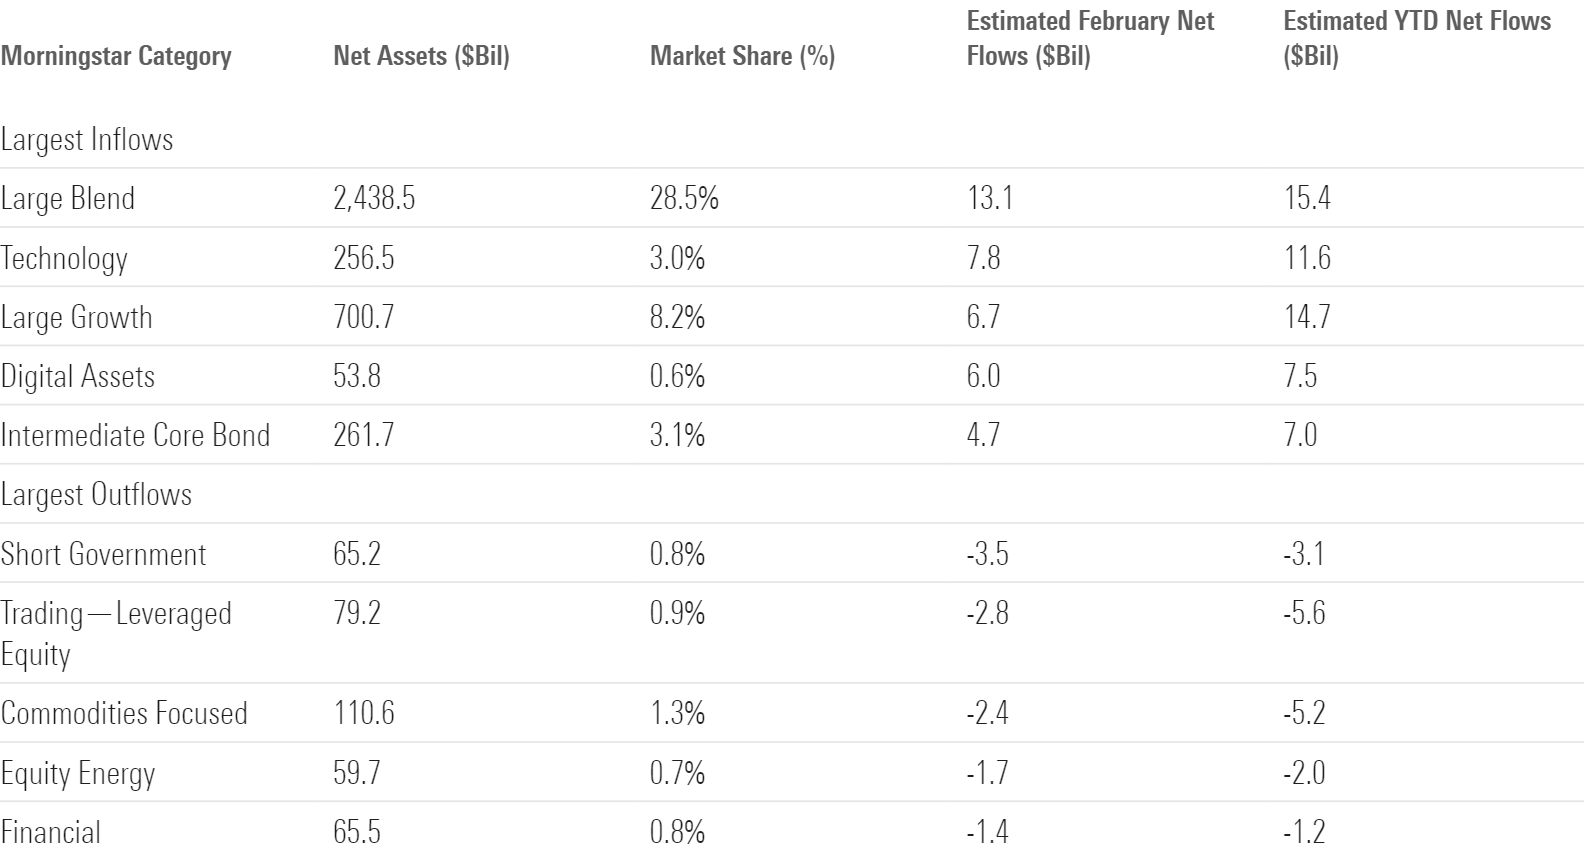
US equity funds pulled in a respectable $28 billion in February. Large-blend funds customarily led in terms of absolute net flows, but growth-oriented strategies provided a boost. The large-growth category reeled in $6.7 billion, about $2 billion of which went to the tech-heavy Invesco QQQ Trust QQQ. The large-growth category reeled in $35 billion, while large-value shed $6 billion in 2023, a stylistic divergence that continues to grow. In the opening months of 2024, large-growth funds racked up $14 billion of new money while large-value funds barely cracked inflows.
Investors’ desire for growth stocks spilled into the sector-equity arena. They piled more than $7.8 billion into technology ETFs in February, including $5.7 billion into Vanguard Information Technology ETF VGT alone, a whopping figure that raises the question of whether widely followed model portfolio changes were in play. Either way, investors don’t think it’s too late to join the AI-driven tech frenzy that Nvidia recently stoked. Fast-growing consumer cyclical funds pulled in $1.5 billion. Consumer Discretionary Select Sector SPDR ETF XLY, which allocates roughly 40% of its portfolio to Amazon and Tesla TSLA, led the way. Meanwhile, funds tracking cheaper sectors saw money leave their doors. Utilities, financials, and energy funds each shed north of $1 billion on the month.
International equity funds reeled in a tidy $9.8 billion in February. The foreign large-blend and diversified emerging-markets categories, by far the cohort’s two largest, paced the group in terms of absolute inflows, but some of the strongest organic growth came from two of 2023′s breakout segments: the Japan stock and India equity categories. The former gathered about $1.3 billion to seal back-to-back months of 10-digit flows, no small feat for the $36-billion category. The $14-billion India equity category hauled in $1 billion of its own, marking its 12th straight month of inflows. Its asset base more than doubled over that span.
Morningstar Categories with the Largest February Flows
Bond ETF Flows
It was a quiet month for fixed-income ETFs. They pulled in about $11 billion, their smallest monthly total since September 2023. No bond categories exceeded $5 billion in flows nor a 5% organic growth rate in February.
Investors dialed back credit risk after welcoming it in January. The high-yield and corporate bond categories both followed up strong January campaigns with outflows in February. Interest-rate risk hasn’t completely fallen out of fashion. Long government bond funds collected more than $3 billion, while their short-term peers lost roughly the same amount. That said, the magnitude of these flows pales in comparison to the wilder swings of 2023. With the timeline for interest-rate cuts as hazy as ever, ETF investors seem content to stand pat until the picture comes into focus.
ETFs with the Largest February Flows
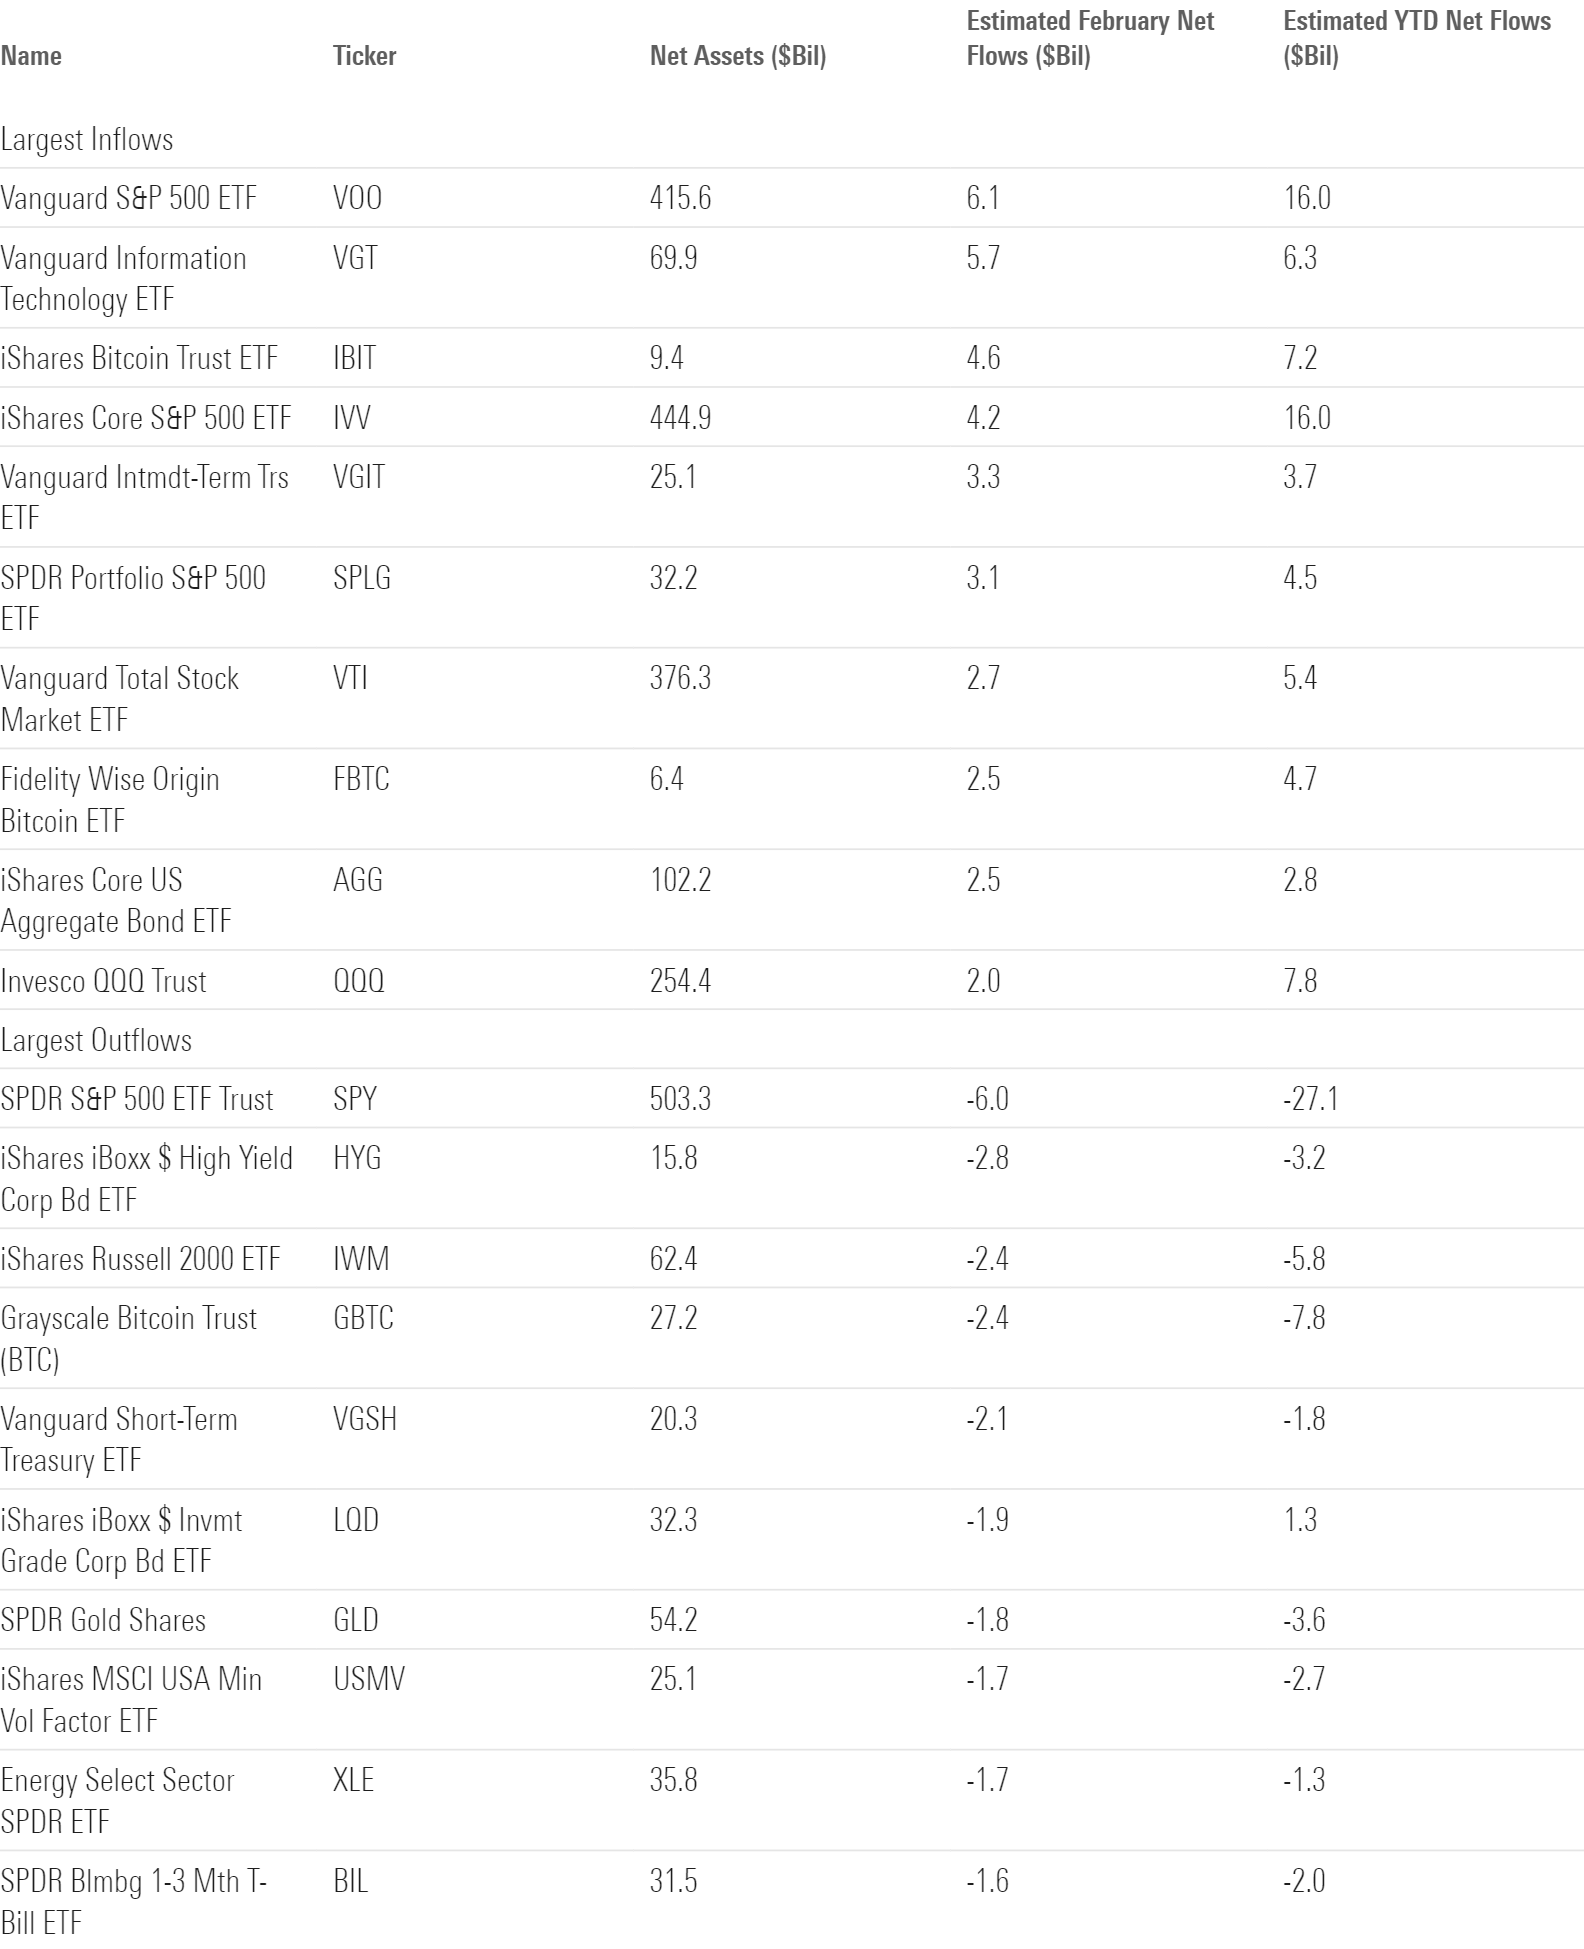
Bitcoin ETF Flows Pick Up Speed
Investors that long clamored for spot bitcoin ETFs have put their money where their mouth is: the digital assets category, which houses spot bitcoin ETFs, soaked up its best monthly flow since January 2021. Its $6 billion haul ranked fourth among all categories despite constituting just 0.6% of the market. It certainly didn’t hurt that bitcoin soared 44% during February, in part thanks to the demand the new ETFs generated.
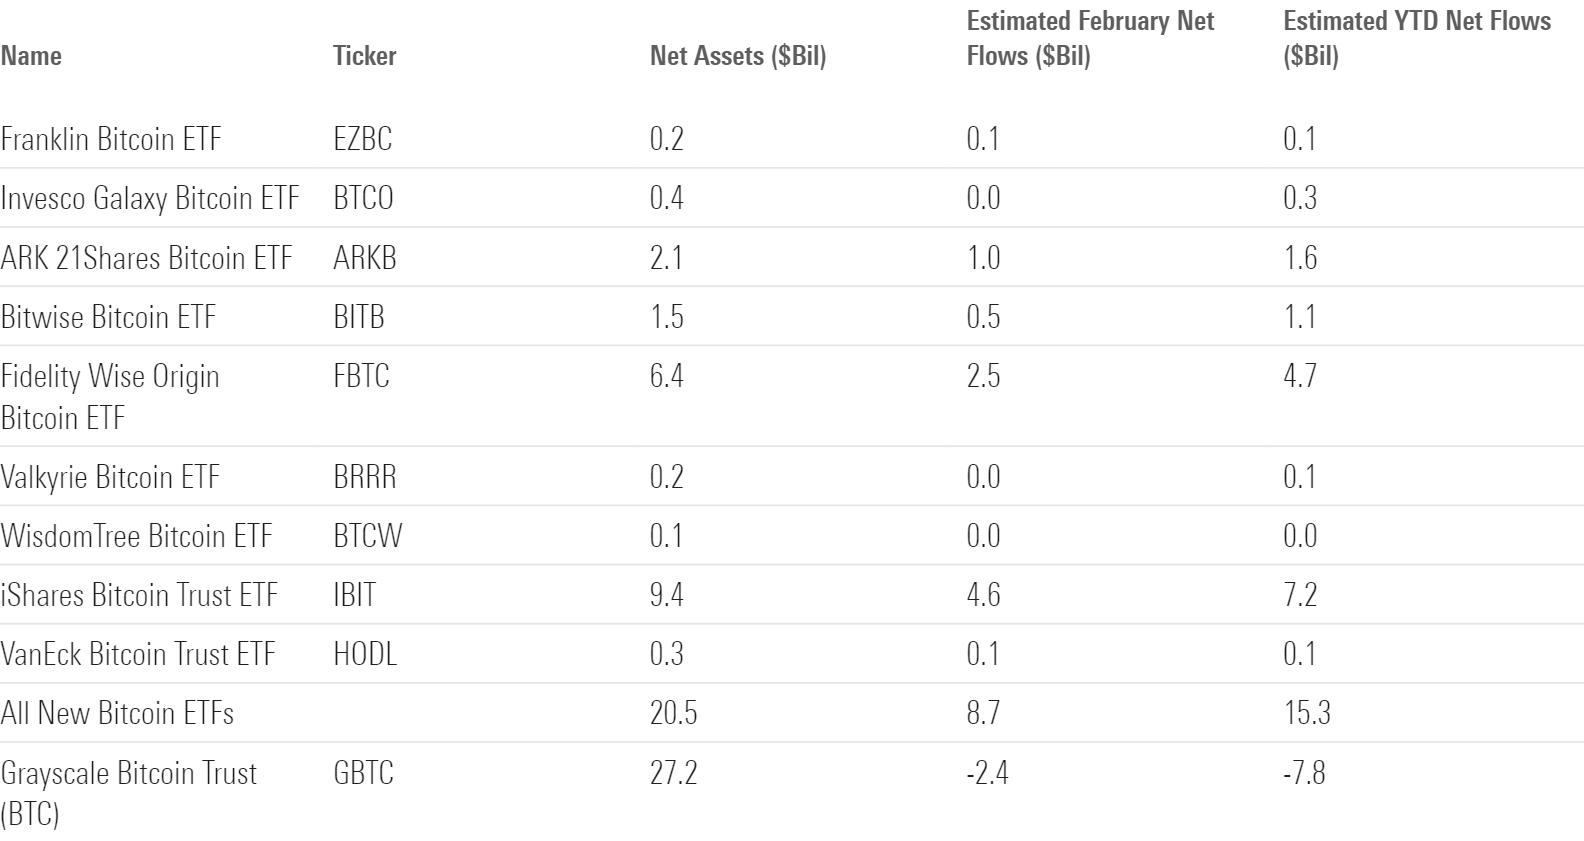
The new bitcoin ETFs that cannonballed into the marketplace in mid-January collectively inhaled $8.7 billion in February. Exhibit 6 shows their early results and contrasts them with Grayscale Bitcoin Trust GBTC, the trust-turned-ETF that lost its stranglehold on the market when the “New Nine” launched. IShares’ and Fidelity’s products have emerged as the top dogs early on. That’s no slight to the rest of the pack; the top two’s early success is remarkable. Consider that iShares Bitcoin Trust ETF IBIT boasted $9.4 billion in assets at February’s end. That made it larger than 95% of the ETF market after just seven weeks of trading.
The New Bitcoin ETFs Have Made a Splash
Top ETF Providers: A Closer Look at Fidelity
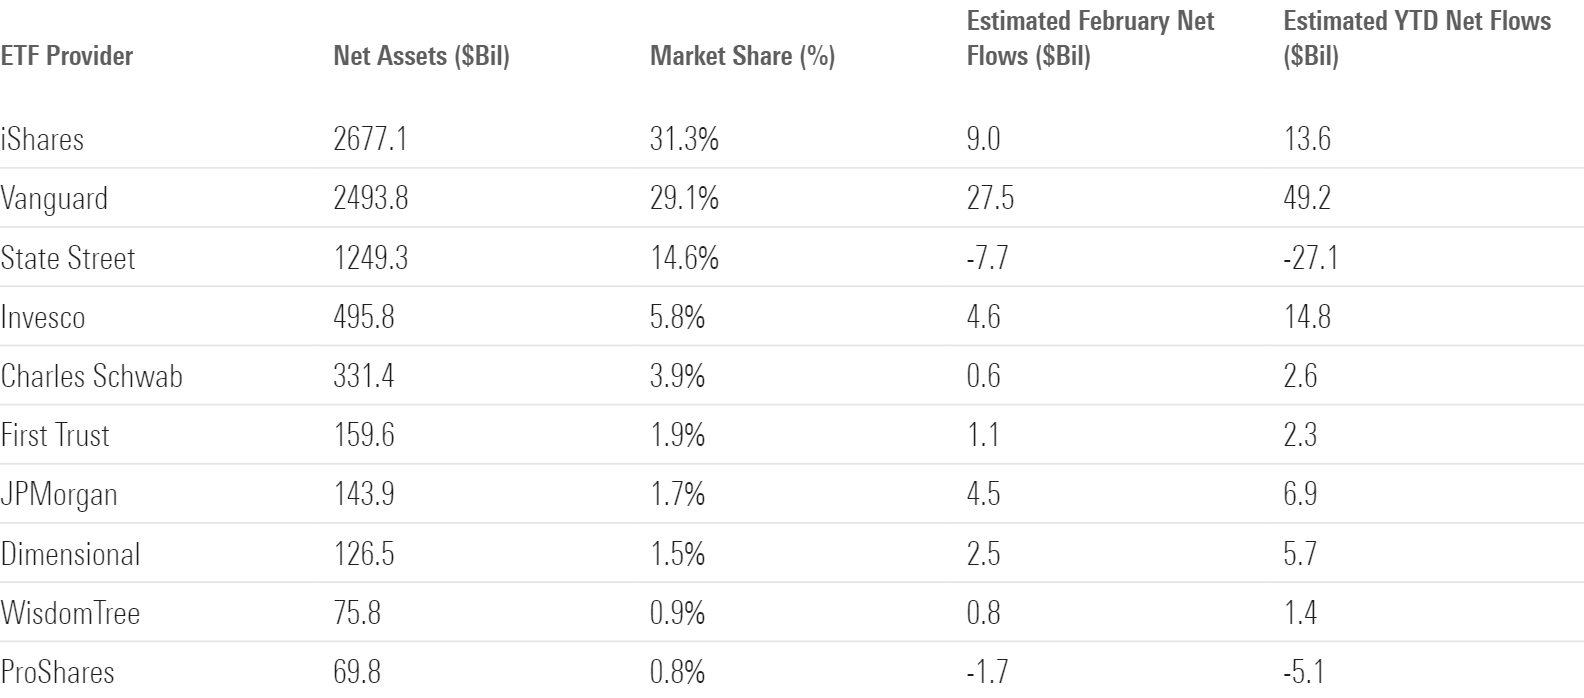
Vanguard made headlines at February’s end when it announced CEO Tim Buckley will retire by the end of 2024. It will make fewer headlines for leading all ETF providers, with more than $27 billion of February inflows, because that has become par for the course. The annual flows champion four years running, Vanguard has already distanced itself in the 2024 race: Its $48 billion haul through February was more than quadruple its next-closest competitor Dimensional.
February Flows for the 10 Largest ETF Providers
Instead, let’s take a closer look at Fidelity. The second-largest mutual fund provider in the US has quietly built a distinct ETF lineup that totaled $63 billion at the end of February.
Fidelity Wise Origin Bitcoin ETF FBTC has undoubtedly been the firm’s crown jewel in 2024. It amassed $4.7 billion since January 2024, when its launch made it the latest addition to Fidelity’s hodgepodge ETF roster. The firm’s first foray into ETFs came in 2003 with the launch of Fidelity Nasdaq Composite ETF ONEQ, now a $6 billion product. In 2013, Fidelity released a sector ETF lineup that has slowly grown into a $22 billion suite. It later found commercial success by sprouting fundamental active ETFs from some of its best mutual fund strategies, namely Fidelity Total Bond ETF FBND ($7.5 billion) and Fidelity Blue Chip Growth ETF FBCG ($1.2 billion). And in 2023, Fidelity injected a fresh $10 billion into its ETF treasure chest by converting a family of popular systematic-active strategies from mutual funds to ETFs.
In a market where most providers lean on one formula to build their ETF roster, Fidelity has stitched together a smorgasbord of traditional passive, strategic-beta, sector, fundamental active, systematic active, and thematic strategies via original launches, clones, and conversions. Its ETF lineup ranked 12th among all providers at February’s end. If FBTC sustains its early popularity, it could leapfrog into the top 10 soon.
What Looks Cheap?
The fair value estimate for ETFs rolls up our equity analysts’ fair value estimates for individual stocks and our quantitative fair value estimates for stocks not covered by Morningstar analysts into an aggregate fair value estimate for stock ETF portfolios. Dividing an ETF’s market price by this value yields its price/fair value ratio. This ratio can point to potential bargains and areas of the market where valuations are stretched.
The 10 Most Under- and Overvalued Analyst-Rated ETFs
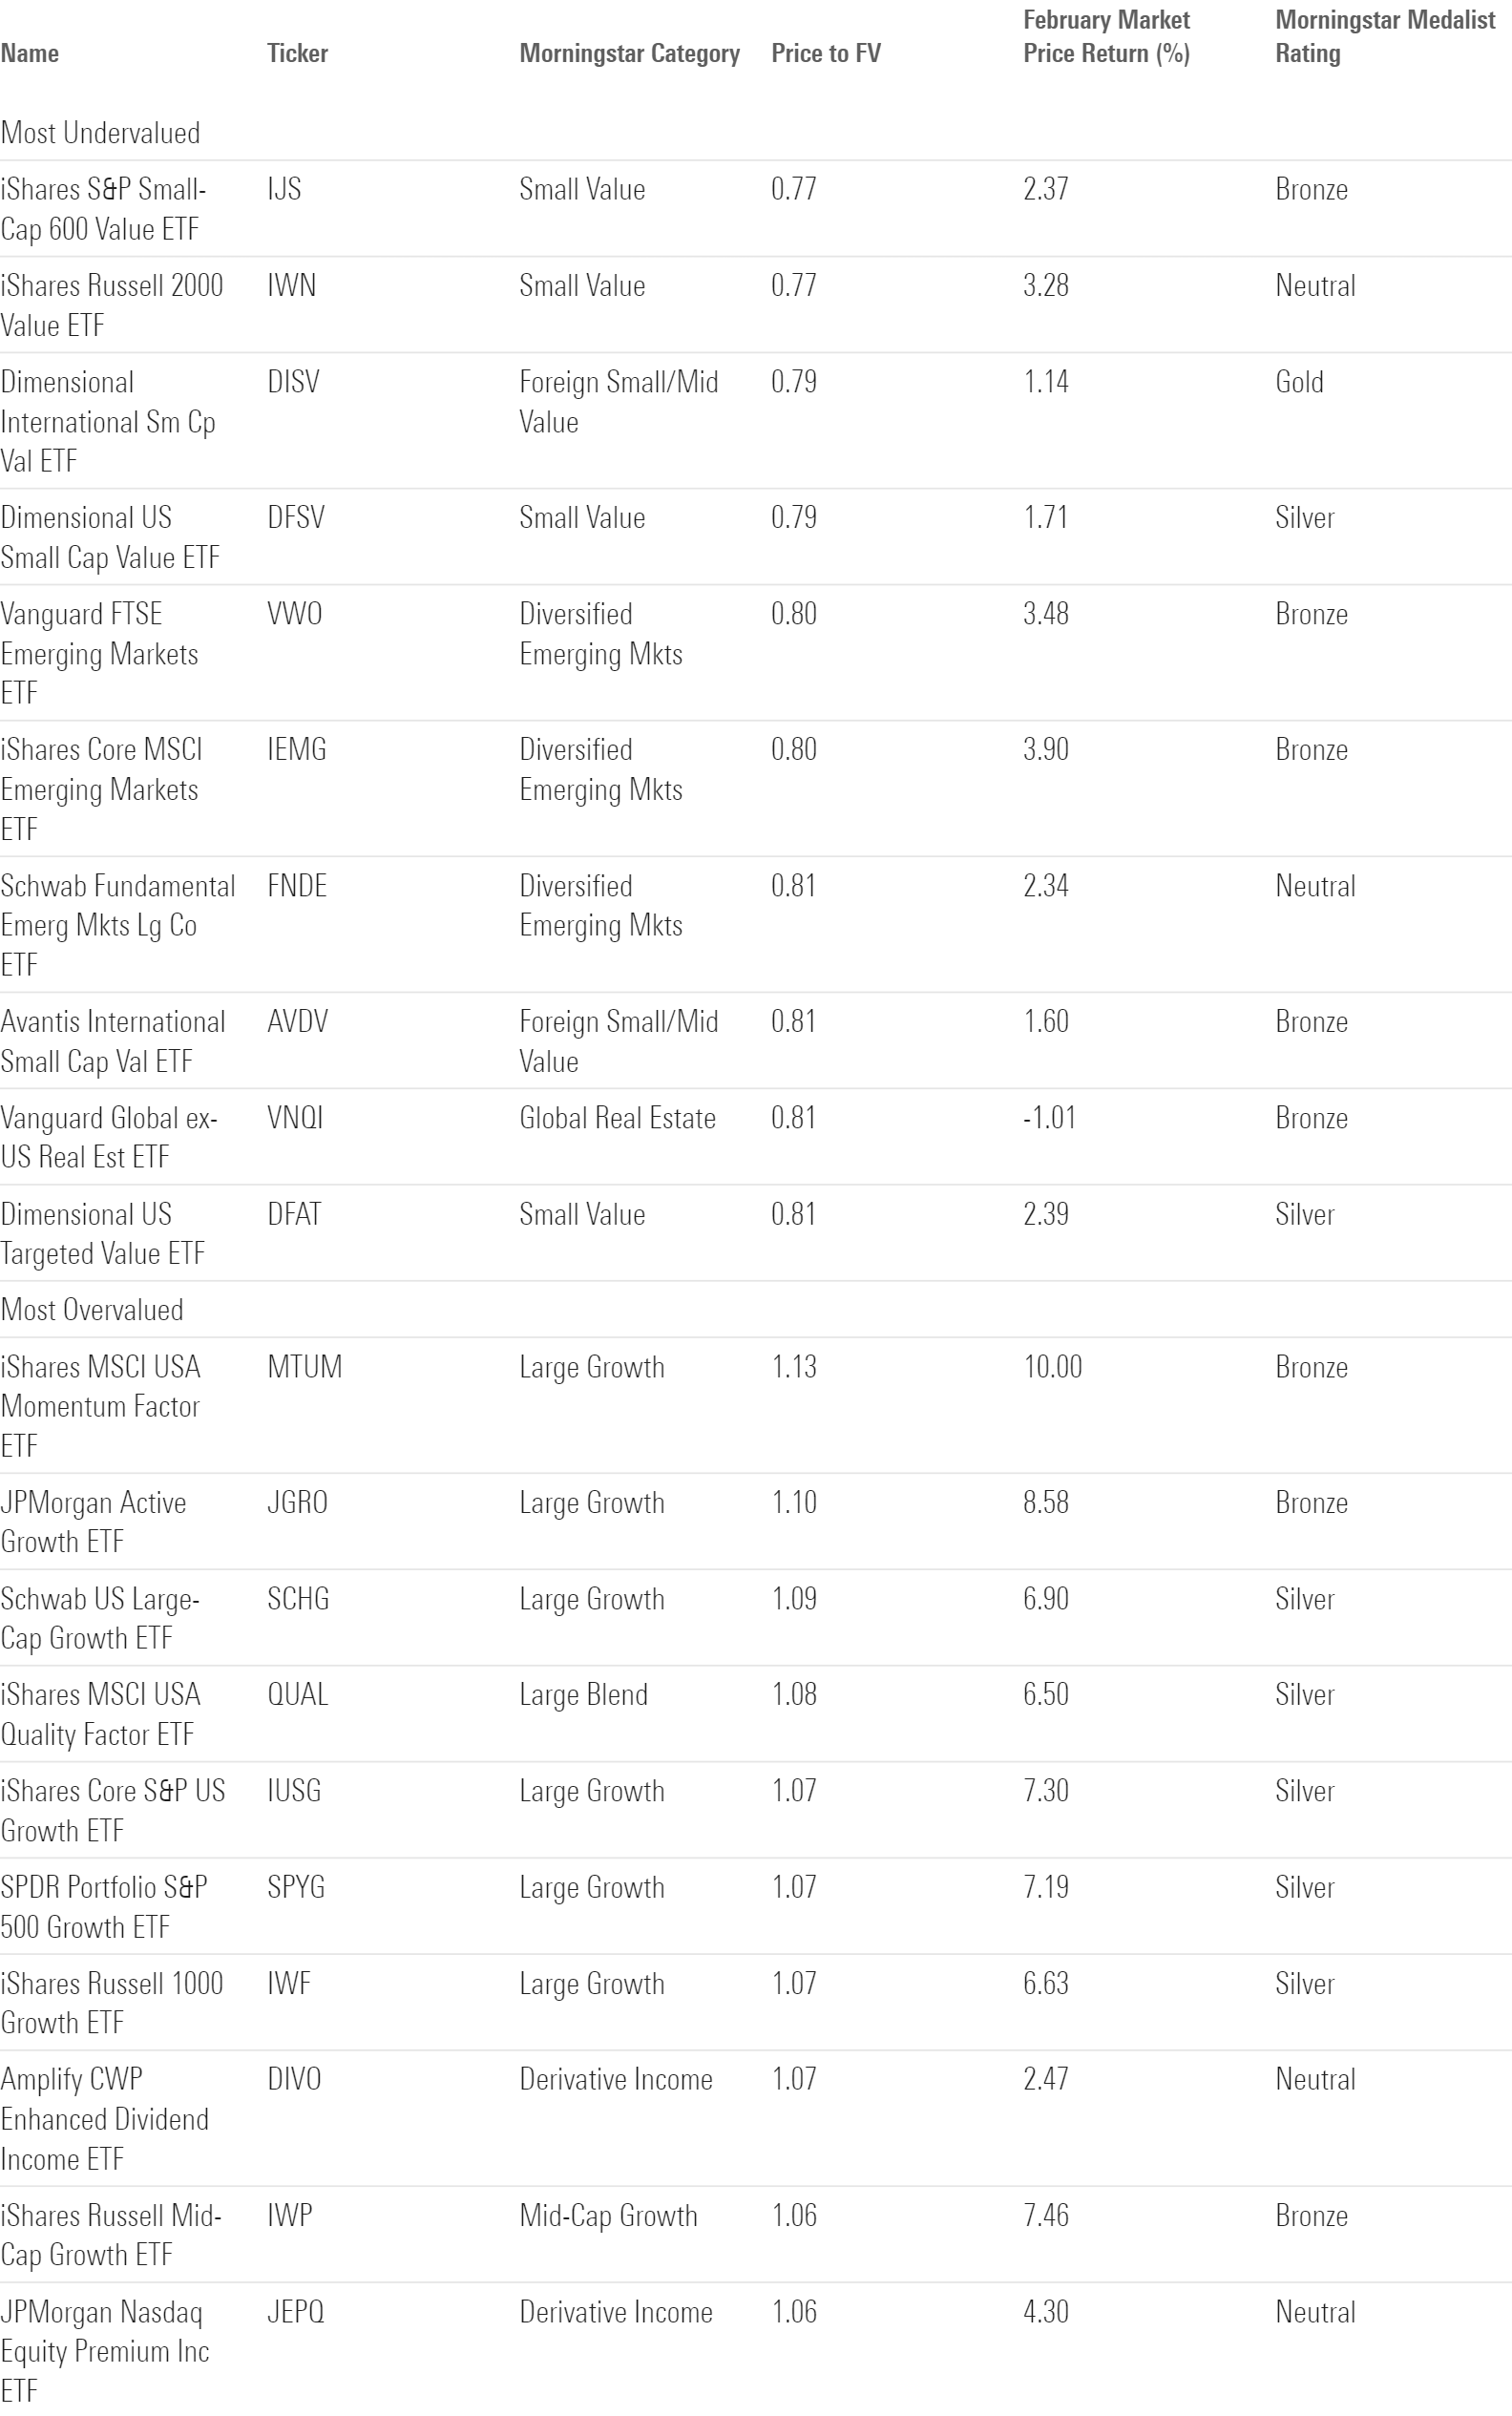
According to the price/fair value ratio, the US market officially crossed into overvalued territory in mid-January, its first extended stay there since 2021. Investors may find better value by venturing into smaller companies. Vanguard S&P Small-Cap 600 ETF VIOO traded 18% below its fair value at February’s end, and Vanguard Mid-Cap ETF VO offered a 4% discount. For those looking to go even cheaper, strategies that explicitly target undervalued stocks may be worth a look.
Overseas, some of the best value may lie in emerging-markets ETFs. As Morningstar’s Dan Lefkovitz explains, these stocks have long trailed their developed-market peers, both in and outside the US. They carry significant risks (many of which unfolded over the past 15 years) but may be ripe to bounce back.
The author or authors do not own shares in any securities mentioned in this article. Find out about Morningstar’s editorial policies.
/cloudfront-us-east-1.images.arcpublishing.com/morningstar/24UPFK5OBNANLM2B55TIWIK2S4.png)
/d10o6nnig0wrdw.cloudfront.net/04-25-2024/t_29c382728cbc4bf2aaef646d1589a188_name_file_960x540_1600_v4_.jpg)
/cloudfront-us-east-1.images.arcpublishing.com/morningstar/T2LGZCEHBZBJJPPKHO7Y4EEKSM.png)
:quality(80)/s3.amazonaws.com/arc-authors/morningstar/30e2fda6-bf21-4e54-9e50-831a2bcccd80.jpg)