
How to Cut Your Losses With Defined-Outcome ETFs
Investing in buffer funds comes with trade-offs and higher fees.
/s3.amazonaws.com/arc-authors/morningstar/c00554e5-8c4c-4ca5-afc8-d2630eab0b0a.jpg)
/s3.amazonaws.com/arc-authors/morningstar/0fa19b38-60f6-4a0f-9e06-9869d9c57d52.jpg)
/s3.amazonaws.com/arc-authors/morningstar/5db00d6b-9c2f-4da7-8f94-da4290cf3b4a.jpg)

Recent market volatility has increased investors’ appetite for strategies that lower risk. Enter defined-outcome exchange-traded funds, otherwise known as “buffer ETFs,” which claim to shield investors from losses on a given index.
These funds have seen rapid growth in the past few years. Assets have grown to more than $22 billion today from under $200 million in 2018, with 169 products currently on offer. But what exactly are these products, how do they work, and should you invest in them?
In the recently published “Defined Outcome ETF Primer,” we peel back the layers on these seemingly complex strategies. Most of these ETFs have supported their claims, but investors should understand how they function and the associated risks before diving in.
What Do Defined-Outcome ETFs Do?
Defined-outcome ETFs provide index returns with downside protection by giving up a portion of upside returns. This means investors can reduce losses during periods when the index drops but also miss out on a portion of returns when stocks rise.
These funds use a set of equity options on the underlying index, most commonly the S&P 500, to achieve this. Because of the nature of option contracts, the intended outcomes only apply when investors buy and hold the fund for the predetermined outcome period. This is one year for most funds on the market and usually begins on the first business day of a given month.
We introduce the three main types of options structures used by buffer ETFs below. Regardless of the setup, investors in all three types of funds must give up some of the index’s upside to afford downside protection. Generally, greater protection translates to less upside capture.
- Funds With Upside Cap: These funds insulate investors from a certain range of losses (the “buffer”) on the underlying index (for example, first 10%) but cap returns past a certain threshold (for example, 15%). This is currently the most common approach by defined-outcome ETFs.
- Funds With Partial Upside Exposure: This approach affords downside protection by capturing only a portion of all positive index returns instead of implementing a cap (for example, 80% of index gains). TrueShares is currently the only provider using this structure for most of its funds.
- Downside Floor: This approach provides a floor on the maximum loss for investors but caps return past a threshold. This is considerably more protection than what is provided by funds that employ a buffer, and often translates to a lower cap on gains.
Upside Cap ETFs fully replicate the index’s positive return up until the cap. On the other hand, Partial Upside Exposure ETFs increase at a slower rate but without a cap on returns. Once the index moves past the upside cap, the Partial Upside Exposure funds continue to capture a portion of the index returns, while the capped funds fully miss out. It’s also worth noting that Downside Floor funds expose investors to index losses up until the floor kicks in.
Do Defined-Outcome ETFs Work?
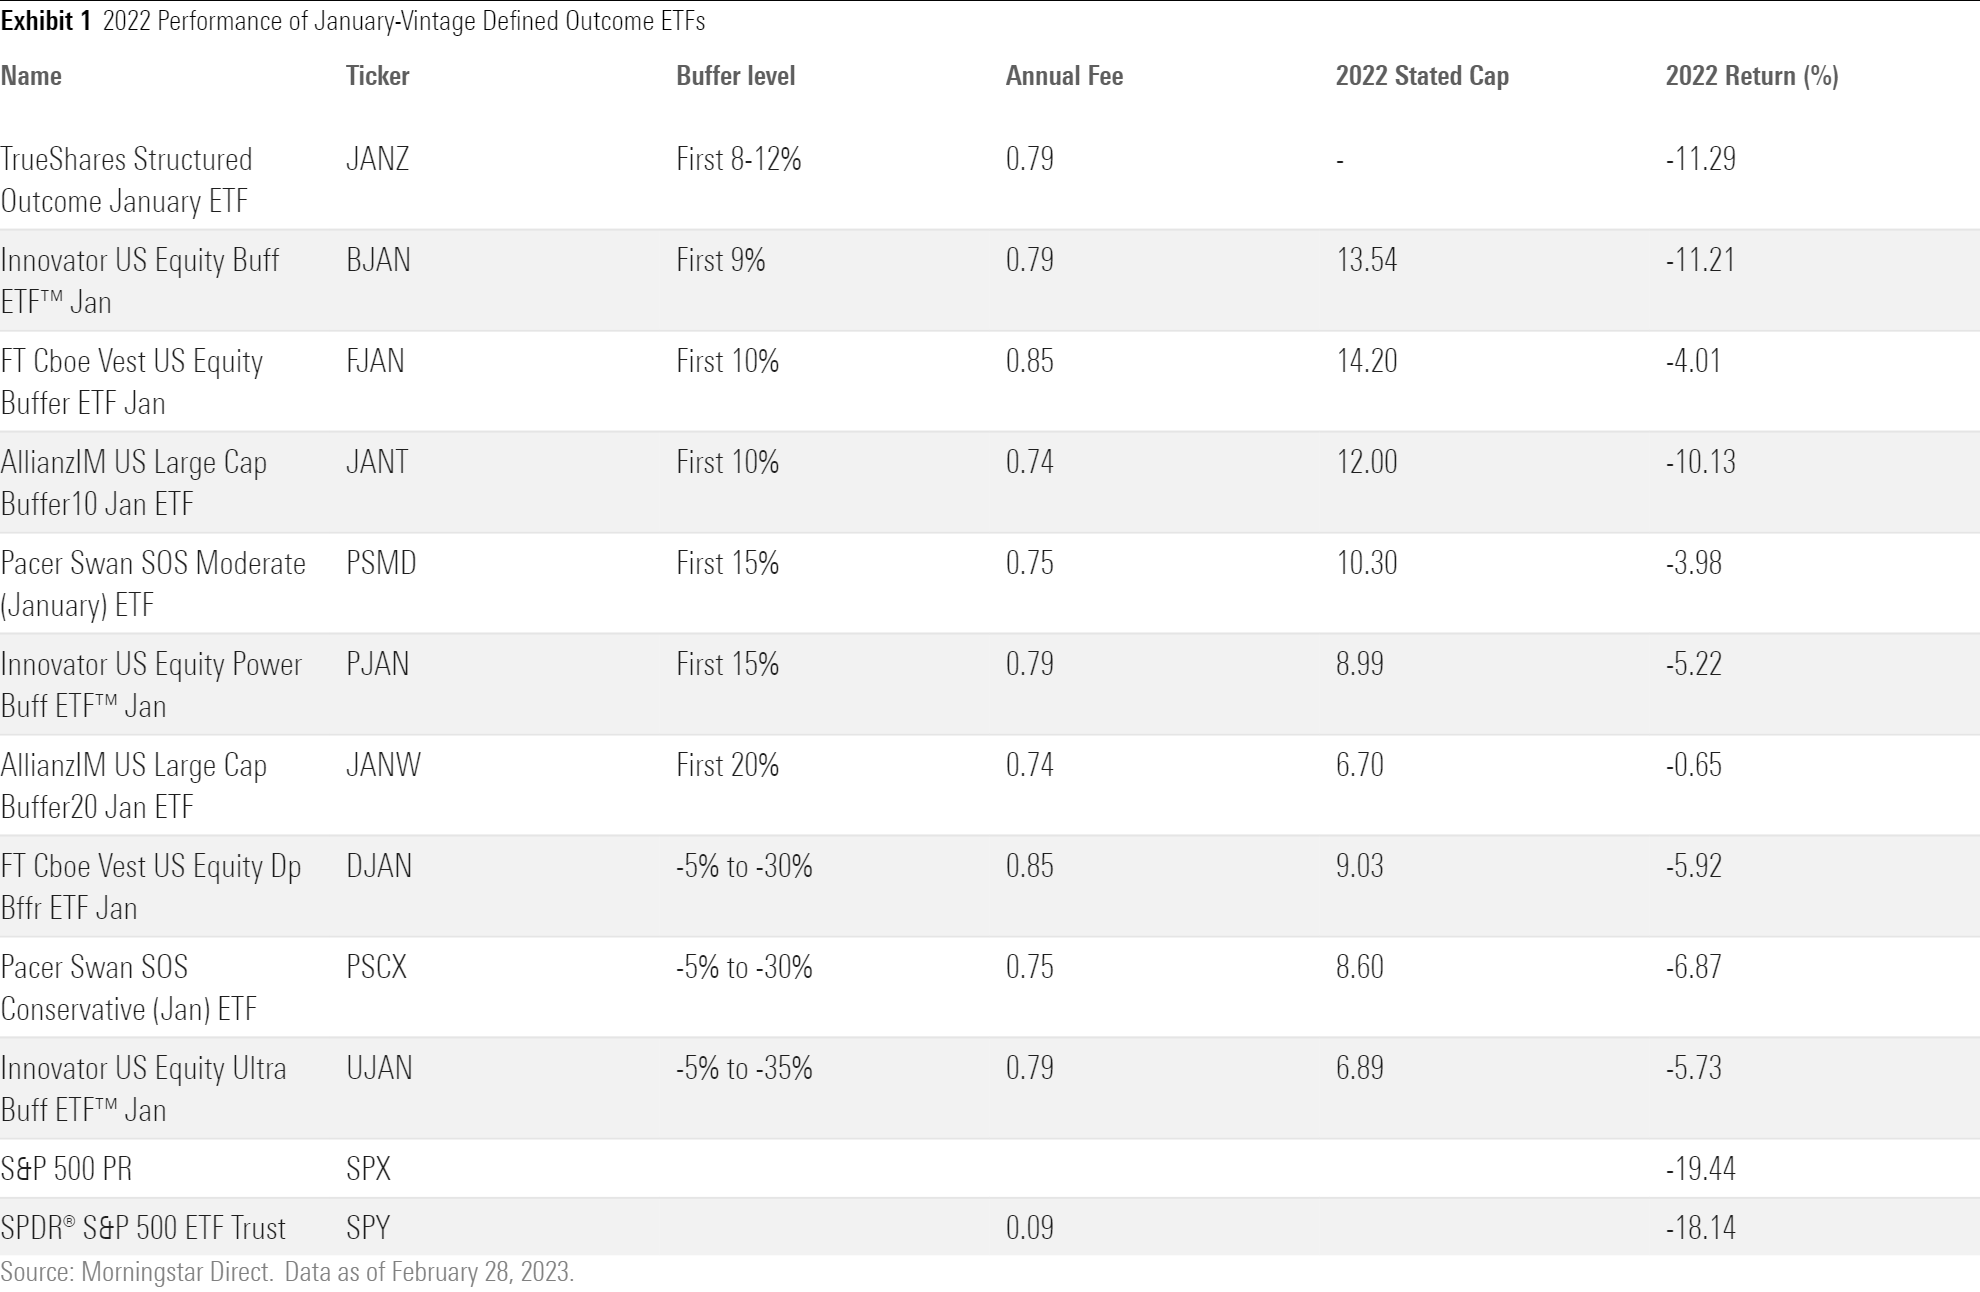
Most defined-outcome ETFs have walked the walk by helping investors avoid losses in down years at the expense of some gains when markets rallied. Exhibits 1 and 2 display net-of-fee performance and stated buffers and caps for the January series of buffer ETFs tracking the S&P 500.
All of them delivered better returns than the index’s 18% fall in 2022. But many also saw their buffer zones breached. Most ETFs shielded investors by an amount similar to their stated buffer, though not identically because of operational slippage and fees.
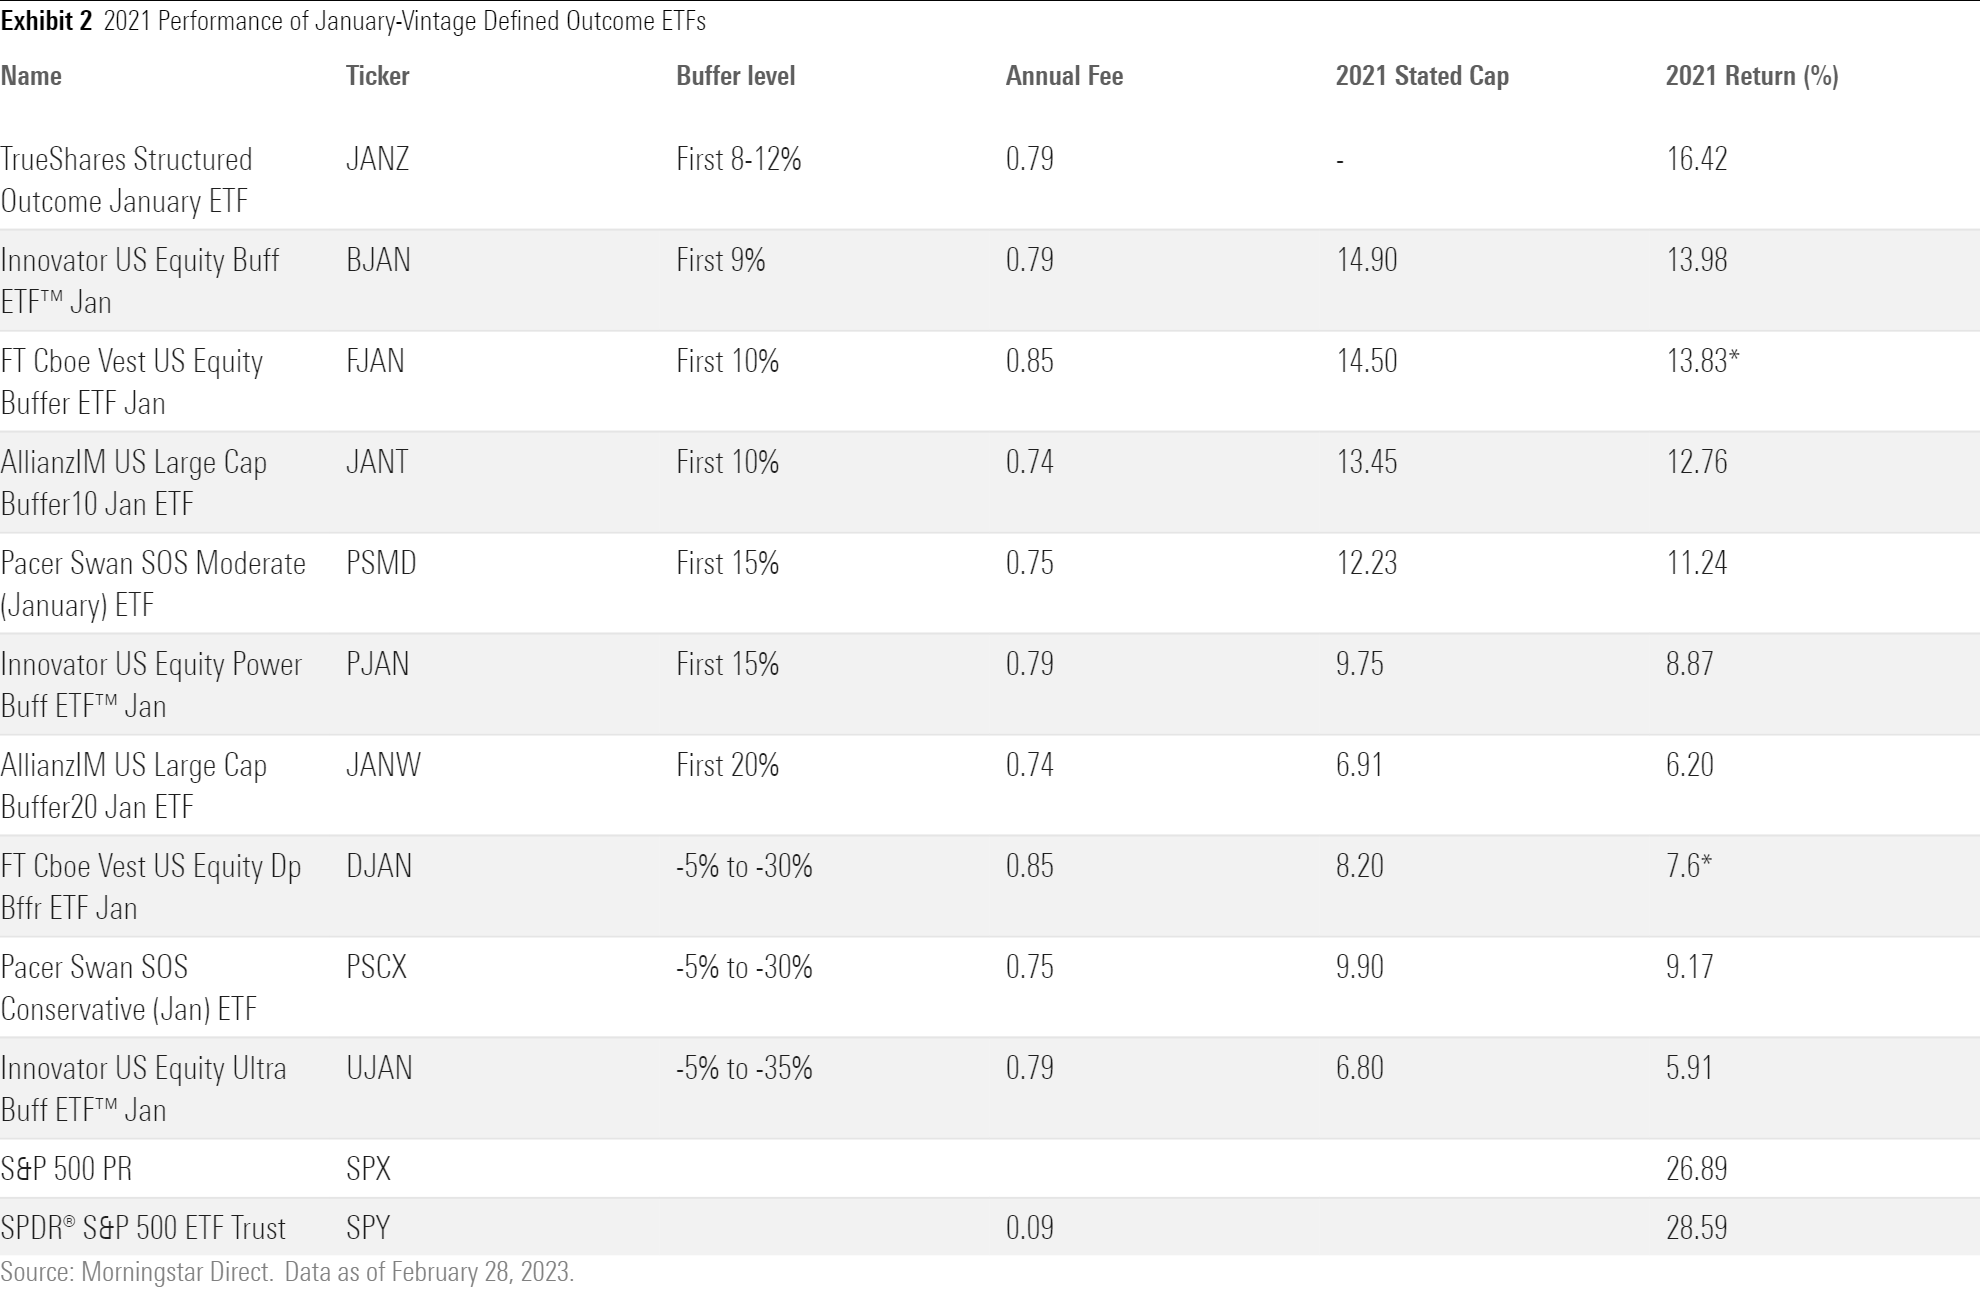
On the other hand, cap and participation limits can cause investors to lag the broad market by a wide margin in strong markets, like 2021.
In 2021, all upside caps were hit as the S&P 500 Price-Return Index SPX and SPDR S&P 500 ETF Trust SPY returned 26.89% and 28.59%, respectively. Funds with the most protection returned less than 10%, and those with the least protection barely eked out half of the index’s return. The rule holds: The more downside protection provided, the more upside these funds gave up.
It’s important to note that the “defined outcome” that these funds promise is only applicable to each fund’s specific holding period. By buying and holding a defined-outcome ETF off-schedule, investors lose the core tenet of the products—a reliable and defined outcome range. Investors who liquidate before the outcome period ends might not receive full upside exposure, while those who buy in midway will receive a different degree of downside protection and cap on the upside.
Are Defined-Outcome ETFs Suitable for Long-Term Investment?
There’s no free lunch in investing. These funds come with costs that fall in a few different groups:
- High Fees: “In investing, you get what you don’t pay for,” according to the late Jack Bogle. And investors pay a lot for defined-outcome ETFs. The difference in annual fee of an S&P 500 ETF and a defined-outcome ETF is roughly 70-80 basis points.
- Lost Dividends: An important, yet inconspicuous, quirk of defined-outcome ETFs is that investors do not receive dividends from the underlying stocks, except for the Downside Floor funds from Global X that hold the actual stocks. The annual dividend yield on the S&P 500 has historically hovered between 1.5% and 2%. Over the last 20 years, this added up to an annualized 2.2-percentage-point advantage for the S&P 500 Total Return Index over the Price-Return version.
- Opportunity Cost: Missing out on gains can seriously detract from long-term returns. Past performance does not guarantee future returns, but the historical return distribution for the S&P 500 can give investors an idea of their potential losses and gains.
Exhibit 3 displays the distribution of all rolling 12-month return periods for SPX since its inception in February 1928. This reflects the possible returns investors would have received if they invested in SPX in any given month and held it for a year, the same length as the outcome period for most buffer ETFs.
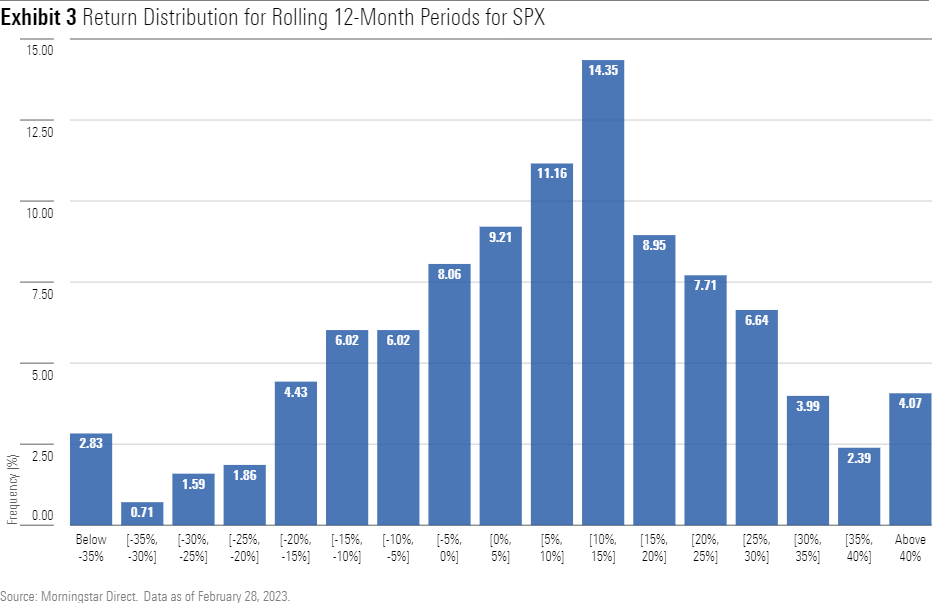
Defined-outcome ETFs with a 9%-10% buffer would seem to protect against typical down years without losing too much during most up years. But, as Eugene Fama proved in his doctoral thesis, the stock market doesn’t follow normal distributions—extreme moves happen with too great of a frequency. More than one sixth of the time, the S&P 500 lost more than 10% in 12 months—pushing returns through the most common buffer zone of 9% to 10%. Protection would further be dwarfed by the 2.83% of 12-month periods that SPX dropped by over 35%. Funds would have also missed out on most of SPX’s 25-plus percentage-point returns that occurred in 17% of observations. Limited protection and unlimited loss to the upside are not a strong mix for long-term investors.
Define Your Outcome?
Investors may use these funds to meet short-term goals or to prevent behavioral pitfalls. Investors close to the end of their investing horizon may be willing to trade long-term gains for short-term protection. These funds can also provide an alternative for investors who find it difficult to stay invested during market turmoil.
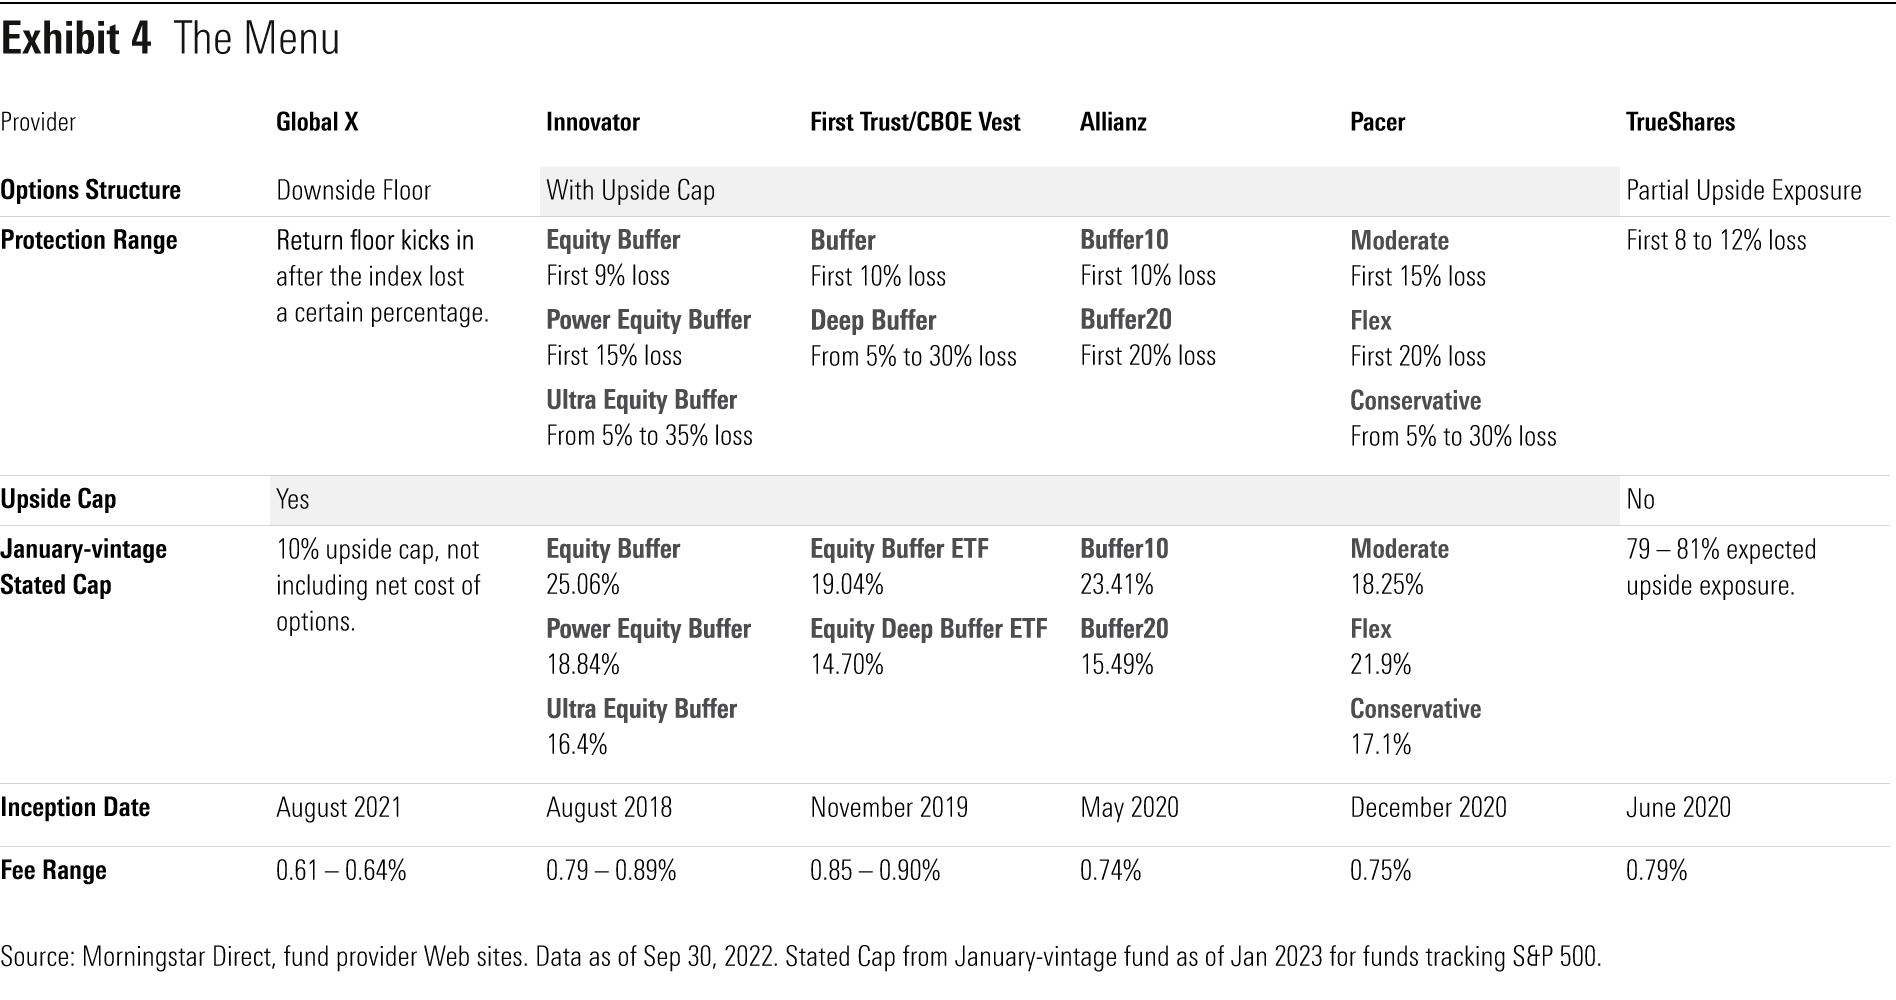
Exhibit 4 provides a snapshot of some of the current defined-outcome ETF providers and the strategies they offer. Most of these funds have a 12-month outcome period. Global X strategies reset their options every quarter.
The author or authors do not own shares in any securities mentioned in this article. Find out about Morningstar’s editorial policies.
/cloudfront-us-east-1.images.arcpublishing.com/morningstar/24UPFK5OBNANLM2B55TIWIK2S4.png)
/cloudfront-us-east-1.images.arcpublishing.com/morningstar/T2LGZCEHBZBJJPPKHO7Y4EEKSM.png)
/d10o6nnig0wrdw.cloudfront.net/04-18-2024/t_34ccafe52c7c46979f1073e515ef92d4_name_file_960x540_1600_v4_.jpg)
:quality(80)/s3.amazonaws.com/arc-authors/morningstar/c00554e5-8c4c-4ca5-afc8-d2630eab0b0a.jpg)
:quality(80)/s3.amazonaws.com/arc-authors/morningstar/0fa19b38-60f6-4a0f-9e06-9869d9c57d52.jpg)
:quality(80)/s3.amazonaws.com/arc-authors/morningstar/5db00d6b-9c2f-4da7-8f94-da4290cf3b4a.jpg)