
ETF Investors Play the Hits in Q3
Investors lean on Treasury and large-blend stock portfolios as markets slump in September to close out the quarter.
/s3.amazonaws.com/arc-authors/morningstar/30e2fda6-bf21-4e54-9e50-831a2bcccd80.jpg)

Key Takeaways
- September lived up to its billing as the calendar’s cruelest month for stock returns. The Morningstar Global Markets Index shed 4.11%.
- Persistent interest-rate concerns sparked a 2.48% drawdown for the Morningstar Core US Bond Index.
- U.S. exchange-traded funds collected $40.1 billion in September 2023, bringing their third-quarter haul to $112 billion.
- Investors leaned into broad market trackers, pouring over $25 billion into the large-blend Morningstar Category.
- Treasury-bond exchange-traded funds at the ultrashort and long ends of the yield curve continued to attract solid inflows.
- Vanguard’s $40 billion third-quarter inflow dominated the ETF provider landscape.
- A rough month in the market left most stock portfolios looking undervalued, especially those targeting the small-value segment.
Markets Slide in September
The exhibit below shows September returns for a sample of ETFs that serve as proxies for major asset classes. A blended portfolio lost 3.4% last month, as stocks and bonds pulled back across the globe.
September Market Performance Through the Lens of Analyst-Rated ETFs
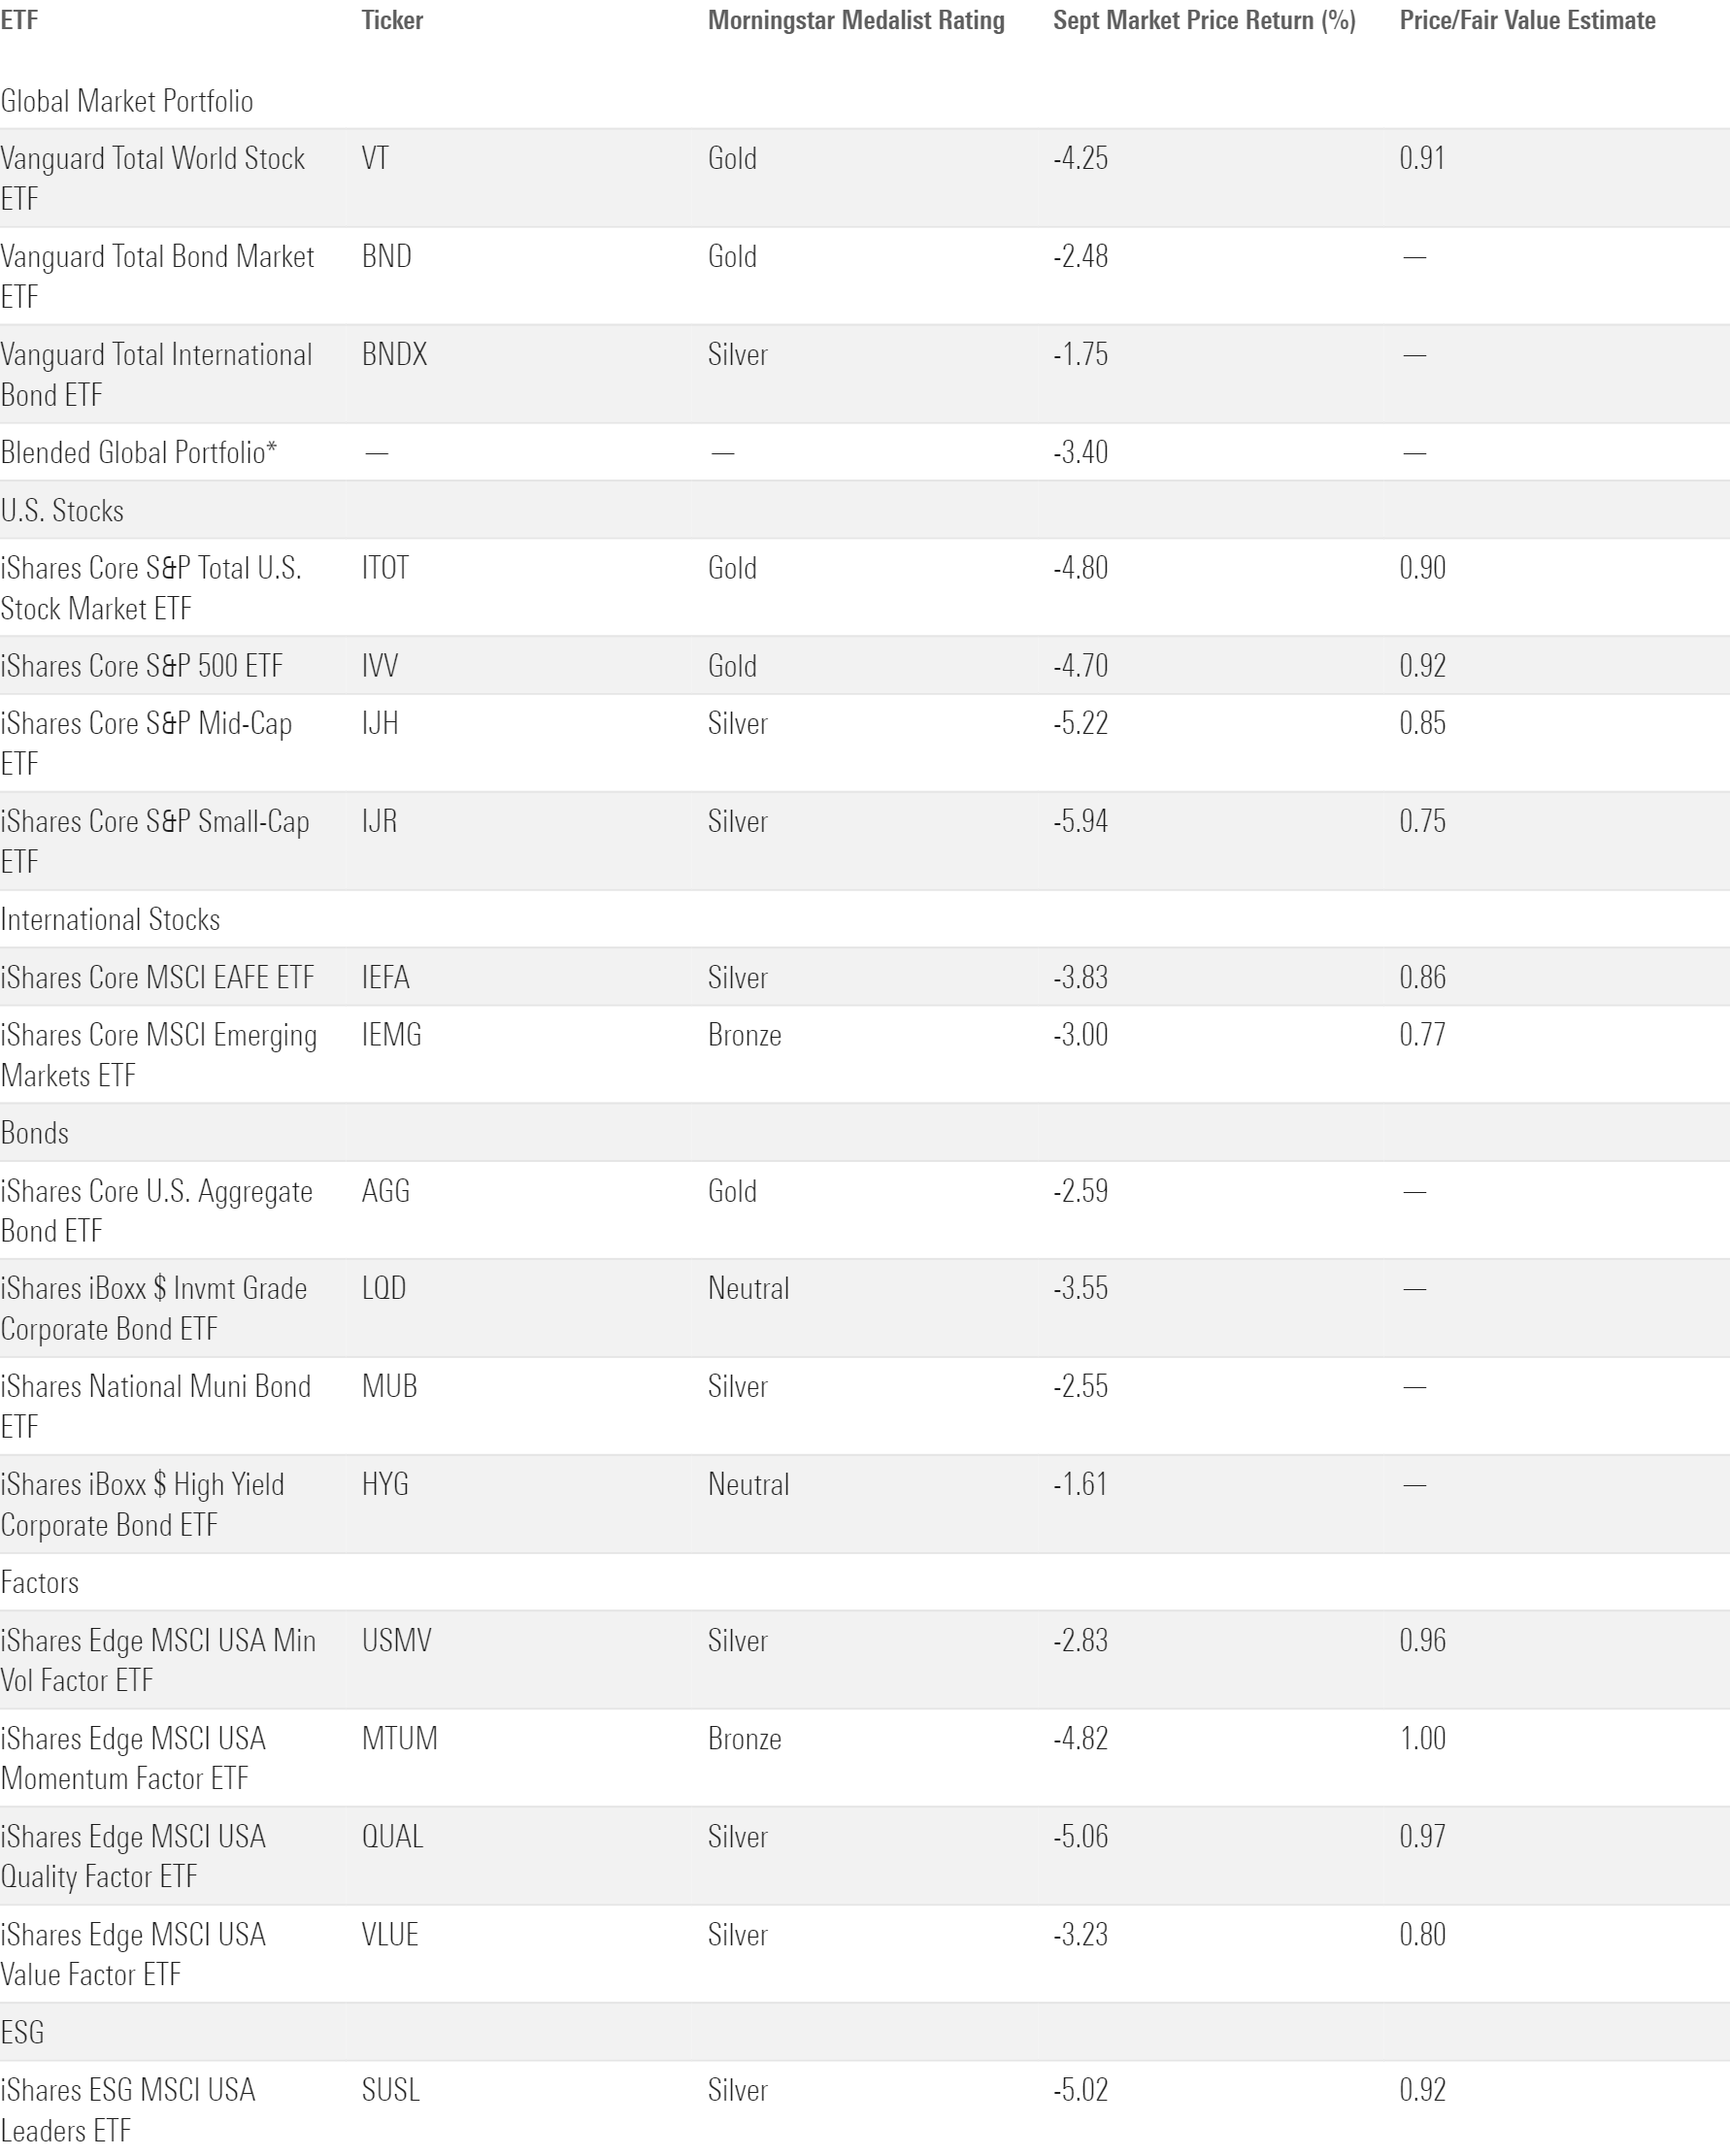
U.S. bonds suffered their fifth straight month of losses in September. The Federal Reserve elected to keep the federal-funds rate unchanged when it met last month, but the committee’s forecasts and commentary afterward signaled that interest-rate cuts may be further in the future than investors anticipated. This sentiment stung long-term bond portfolios, which are more sensitive to interest-rate fluctuations. IShares 20+ Treasury Bond ETF TLT sank 7.95%, its worst month since September 2022, pushing its year-to-date drawdown to 9%. Shorter-term bonds held up better; iShares Short Treasury Bond ETF SHV scratched out a 0.39% gain on the month.
Foreign bonds fell in September, too, though by a smaller margin. Vanguard Total International Bond ETF BNDX finished the month 1.75% lower than where it started. The European Central Bank raised rates for the 10th consecutive time at its September meeting, but the bank struck a softer tone for its look ahead, and that cushioned the fall for eurozone bonds.
September lived up to its billing as the worst month on the calendar for stocks. The same interest-rate concerns that hurt bond returns led to Vanguard Total World Stock ETF’s VT 4.25% decline, its worst month since last December. U.S. stocks, which constituted 61% of that portfolio entering September, were hit particularly hard. Vanguard Total Stock Market ETF VTI shed 4.79%, pushing it into the red for the third quarter.
The specter of “higher for longer” interest rates affected growth stocks more acutely than value. Since growth companies’ cash flow forecasts come further in the future, they tend to be more responsive to changes in the federal-funds rate—a central cog in the discount rates used to estimate their present value. Vanguard Growth ETF VUG slid 5.74% in September, about 2.5 percentage points further than Vanguard Value ETF VTV. Many of the mega-cap stocks that powered VUG’s excellent first half weighed on it in September. Weak months from top-five holdings Apple AAPL (negative 8.87% return), Amazon.com AMZN (negative 7.89%), and Nvidia NVDA (negative 11.86%) proved difficult to overcome. Even after its recent wobbles, VUG’s 28.37% year-to-date gain is well ahead of VTV’s modest 0.17% return.
Despite shaky months from many of the market’s largest firms, iShares Core S&P 500 ETF IVV managed to hold up a bit better than iShares Core S&P Small-Cap ETF IJR. Historically, small-cap stocks have been more cyclical than large-cap stocks, leading large caps in market rallies but trailing during downturns. But the past two years have brought the opposite. IJR held up better than IVV during the 2022 bear market but has not rebounded with the same gusto in 2023, notching just a 0.88% year-to-date return to its larger brethren’s 13.11%.
The energy sector was one of the market’s few bright spots in September. Energy Select Sector SPDR ETF XLE advanced 2.4%, making it the lone sector ETF in State Street’s suite to notch a September gain. Firms like Exxon XOM and Chevron CVX climbed alongside soaring oil prices, the result of limited supply and a global economy that continues to defy slowdown expectations. Expensive oil has nudged some alternative sources of energy into the limelight. Sprott Uranium Miners ETF URNM closed the third quarter with a 41.21% gain after jumping 22.46% in September, its best month since February 2021.
Foreign stocks pulled back in September, though by a slightly smaller amount than their domestic counterparts. Vanguard International Stock ETF VXUS peeled back 3.40% to VTI’s 4.79% loss. Asia stocks mostly turned in better-than-average returns. IShares MSCI Japan ETF EWJ lost just 2.19%, and the Morningstar China Index slid 2.83%. Meanwhile, a rough month for equities in the eurozone affected stock strategies that target Europe. Morningstar indexes that track France, Germany, and Netherlands stocks all drew down more than 5% in September.
Stock ETF Flows Chug Along
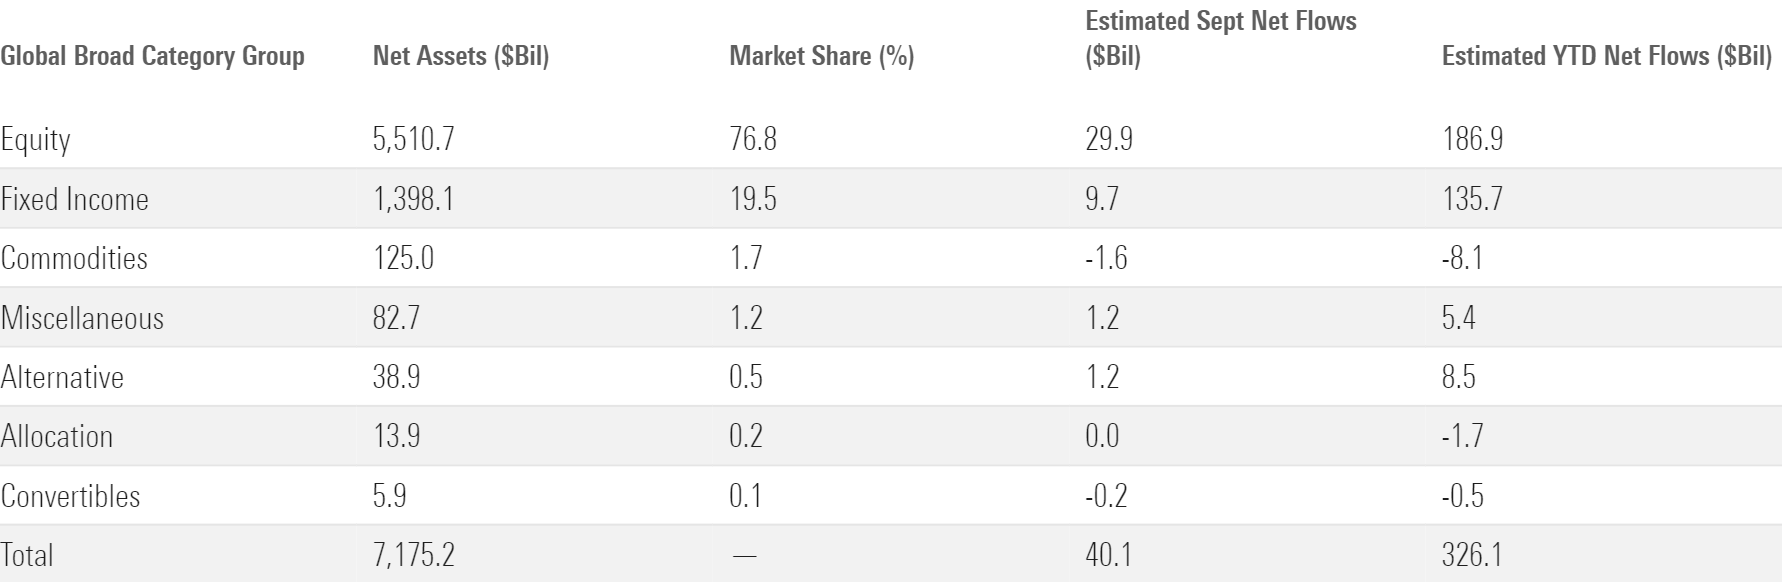
Stock ETFs hauled in nearly $30 billion in September, finishing off a solid quarter in which they took in nearly $80 billion of new money.
September Flows Across Morningstar Broad Category Groups
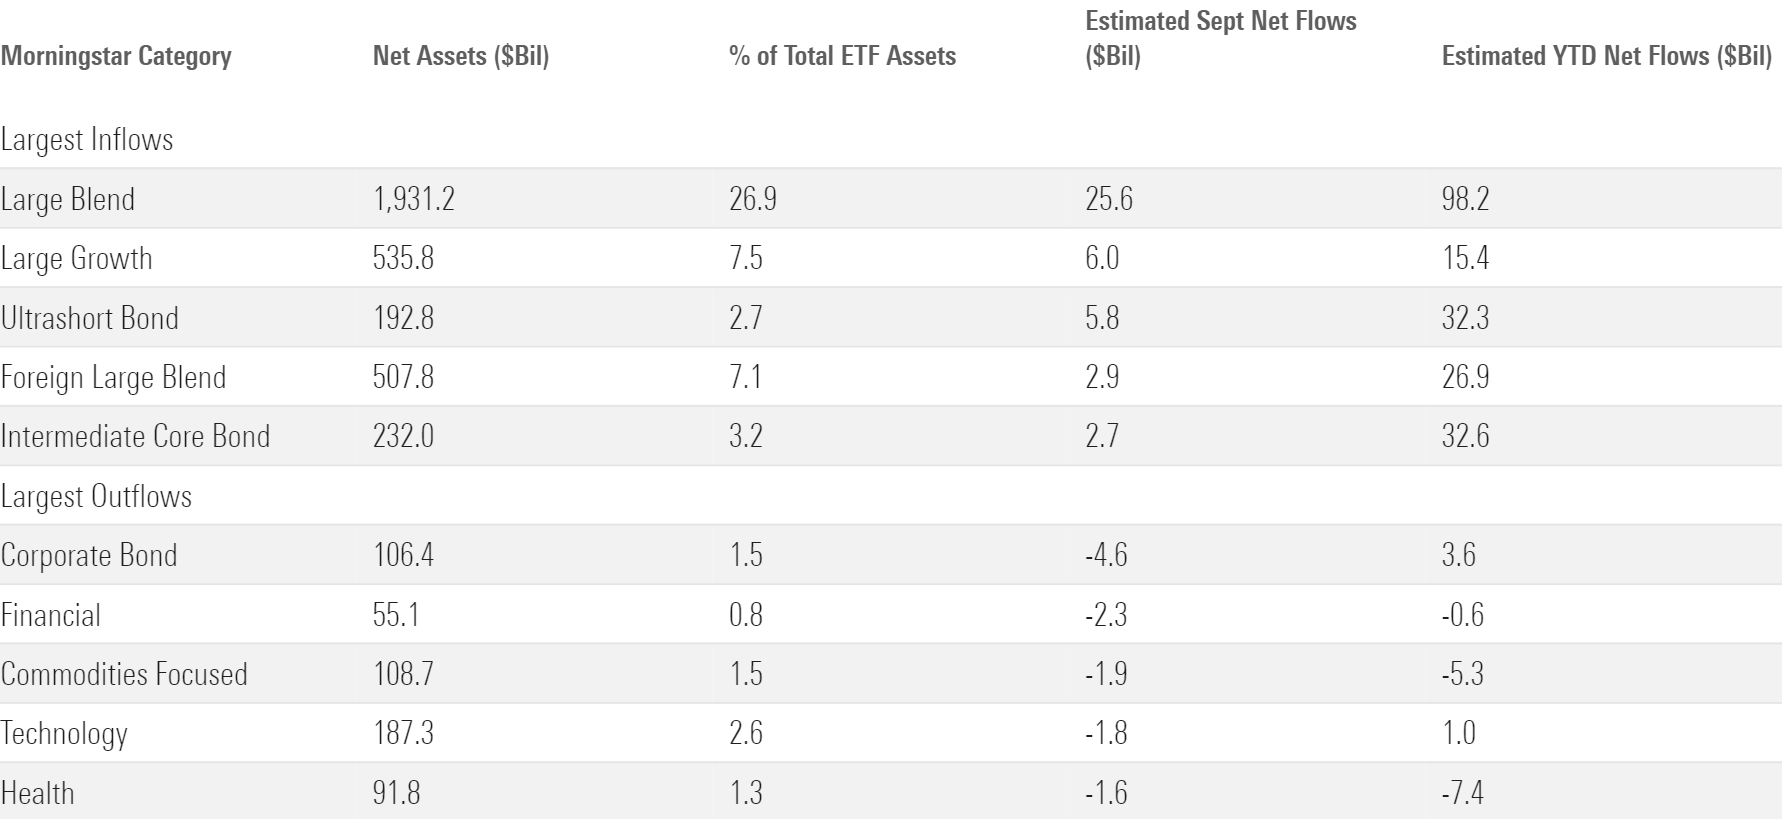
Large-blend funds collected over $41 billion in the third quarter of 2023, more than all other equity Morningstar Categories combined. They reeled in $25.6 billion in September. SPDR S&P 500 ETF Trust SPY, whose month-to-month flows are notoriously volatile, contributed $12.2 billion of inflows after bleeding roughly the same amount one month earlier. Other broad index trackers were steadier, including Vanguard S&P 500 ETF VOO, whose $2.6 billion September inflow pushed its year-to-date haul to nearly $30 billion—tops among the entire ETF market.
Large-value ETFs could not muster up much flow momentum in the third quarter. They closed it with $3.1 billion of inflows after a flat September—nothing to sneeze at, but not enough to offset the $15.8 billion they bled in the first half of 2023. No value fund has been hit harder than iShares Russell 1000 Value ETF IWD, whose year-to-date deficit sits at $6.5 billion after it lost $1.2 billion in the third quarter. A slow year for dividend strategies has also hurt the large-value category, their predominant home. Dividend funds gathered just $3.2 billion over the first three quarters after notching nearly $70 billion of inflows in 2022.
On the other hand, the $6 billion that large-growth funds grabbed made it their most lucrative month since last November. This coincided with the Morningstar US Growth Index’s worst month of performance this calendar year. Investors likely saw the September swoon as a buying window for faster-growing strategies like Invesco QQQ Trust QQQ, whose $2.7 billion haul paced the category.
Morningstar Categories With the Largest September Flows
Value strategies attracted more money when it came to foreign stocks. The foreign large-value category hauled in $3 billion over the third quarter. That translated into a respectable 5.27% organic growth rate, a measurement that scales flows for total assets. IShares MSCI EAFE Value ETF EFV led the way there with $2.2 billion of inflows in the quarter. Foreign large-blend funds’ $7.5 billion third-quarter intake was larger in absolute terms, but that equated to a more modest 1.42% organic growth rate. The real star of the international-equity show in the third quarter was the India equity category, which corralled $1.6 billion of fresh investment from July through September. That ranked third-most among the international-equity cohort for the category that entered the quarter with the 14th-largest asset base. IShares MSCI India Equity ETF INDA carried the day with nearly $874 million of inflows.
The nontraditional-equity category continued to cruise in September, welcoming $1.5 billion of new money to its ever-expanding coffers. Flows into these funds have been remarkably consistent, exceeding $1 billion in 26 of the past 27 months. The meteoric rise of covered-call funds has powered this run. As my colleague Katherine Lynch details, exceptional yield and downside protection have made strategies like JPMorgan Equity Premium Income ETF JEPI a sensation.
Bond ETF Flows Cool off in Q3
After a blazing hot start to 2023, flows into fixed-income ETFs cooled off a bit in the third quarter. They collected $31 billion for the quarter after a mild September, though their 2023 haul remained stellar at $133 billion.
Investors have taken a barbell approach to fixed-income investing, eyeing the ultrashort and long ends of the yield curve but neglecting some of the middle ground. The ultrashort bond category led all fixed-income segments with $5.8 billion of inflows in September, crystallizing an excellent quarter in which it racked up $17.3 billion of new money. These funds, which normally sport durations under one year, offer a combination of attractive yields and virtually zero risk that investors have had a hard time resisting. IShares 0-3 Month Treasury Bond ETF SGOV offered a yield north of 5% at September’s end—the loftiest level of its existence and the driving force behind its $4.6 billion third-quarter collection.
ETFs With the Largest September Flows
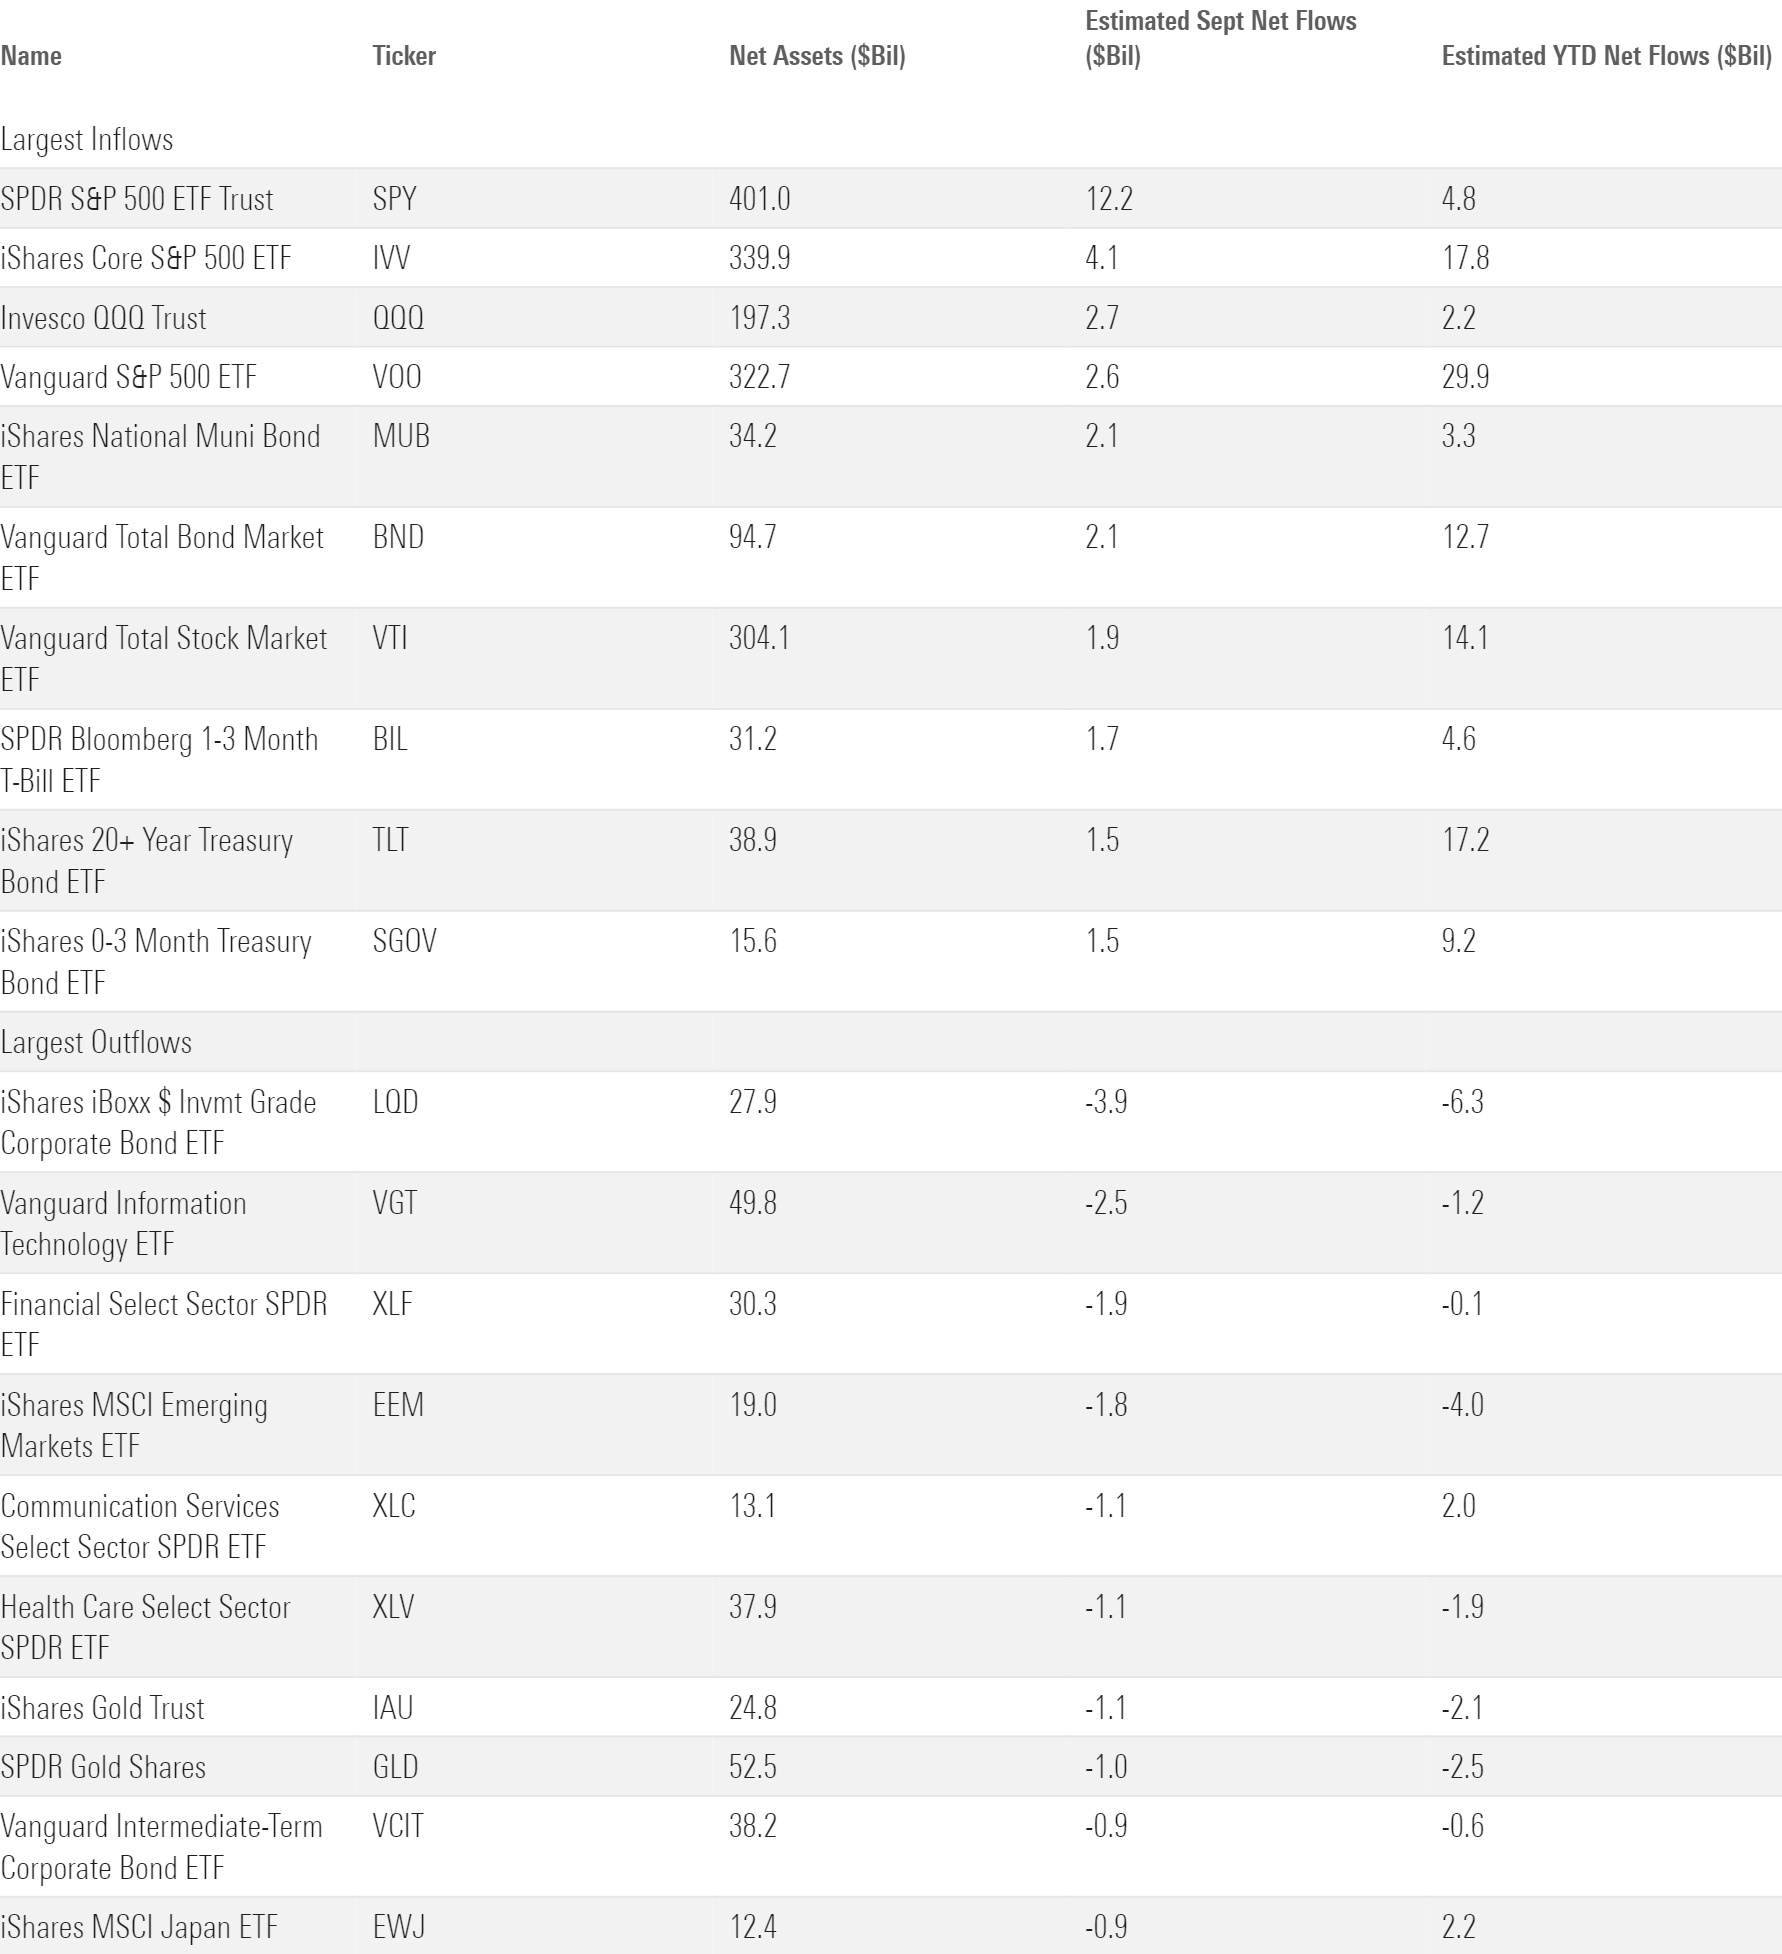
Other bond investors have opted to lock in higher rates with intermediate- or long-term offerings. The intermediate core bond and intermediate government categories both expanded between 3% and 4% on an organic basis in the third quarter. Long-government bond funds tacked on a fresh $7.7 billion in the third quarter, bringing their year-to-date haul to a gaudy $33.4 billion (a 48.6% organic growth rate). Over half that money filed into iShares 20+ Year Treasury Bond ETF, whose asset base has ballooned to nearly $40 billion.
The mad dash into fixed-income funds has not benefited everyone. Short-term bond funds shed $1 billion in September, their eighth consecutive month of outflows. Investors’ preference to jump on higher ultrashort-term rates or lock in longer ones has left the short-term bond category out in the cold. Riskier segments of the bond market also fell out of favor in the third quarter. High-yield and corporate bond ETFs shed $1.4 billion and $4.6 billion, respectively, though bank-loan strategies righted the ship with over $700 million of inflows. Credit risk is no longer a requirement for palatable yield, a reality that has likely hurt flows for high-yield bond, corporate-bond, and perhaps dividend-stock portfolios.
Bond ETFs Bolster Vanguard
Vanguard reeled in $40 billion in the third quarter, well ahead of any potential challengers to the flows crown. So far this year, Vanguard has collected more than $105 billion—a figure greater than the next three closest firms combined. Broad-market behemoths like VOO and VTI have predictably done the heavy lifting. But Vanguard’s fixed-income roster has also been instrumental to its runaway lead. Over the year’s first three quarters, Vanguard’s bond ETFs commanded about one third of all inflows despite representing just 18% of its total assets. Vanguard would still lead the field if its bond ETF flows were flat, but the growth of Vanguard Total Bond Market ETF BND and its more narrowly focused bond sidekicks has lifted the firm to another level.
September Flows for the 10 Largest ETF Providers
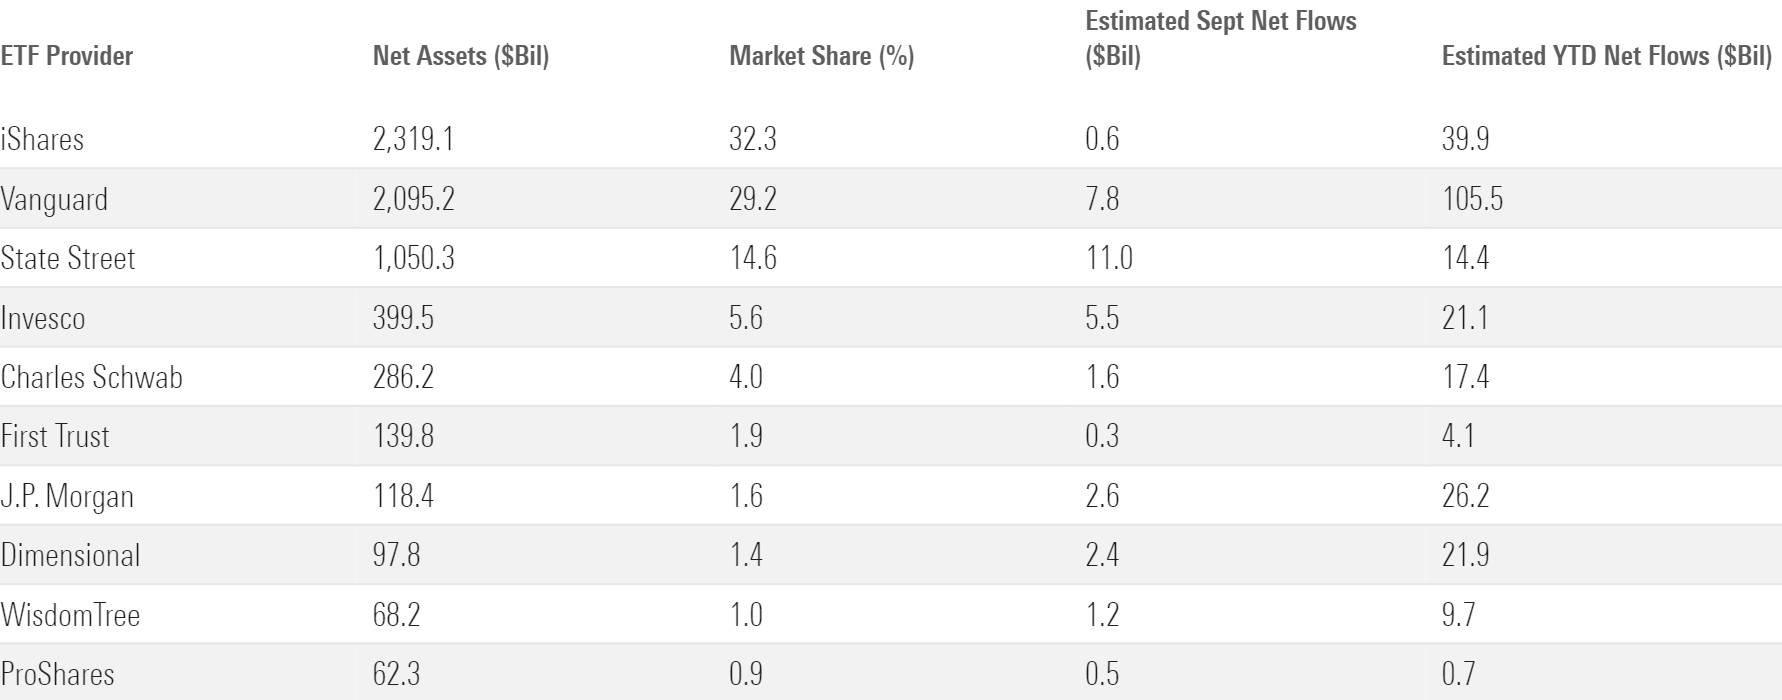
Invesco notched a strong quarter of flows as well, bouncing back from a slow first half to the tune of $12.3 billion of inflows, third-most among all ETF providers. Invesco S&P 500 Equal Weight ETF RSP corralled $3.6 billion, pushing its 2023 intake to $8.2 billion (a 25.1% organic growth rate). The fixed-income lineup chipped in $1.7 billion for the quarter. Invesco’s defined-maturity corporate-bond funds, designed to form bond ladders, fared well. So did Invesco Senior Loan ETF BKLN, absorbing nearly $800 million in September alongside a broader flows rebound for the bank-loan category.
Small Value Tests Investors’ Patience
The fair value estimate for ETFs rolls up our equity analysts’ fair value estimates for individual stocks and our quantitative fair value estimates for stocks not covered by Morningstar analysts into an aggregate fair value estimate for stock ETF portfolios. Dividing an ETF’s market price by this value yields its price/fair value ratio. This ratio can point to potential bargains and areas of the market where valuations are stretched.
The 10 Most Under- and Overvalued Analyst-Rated ETFs
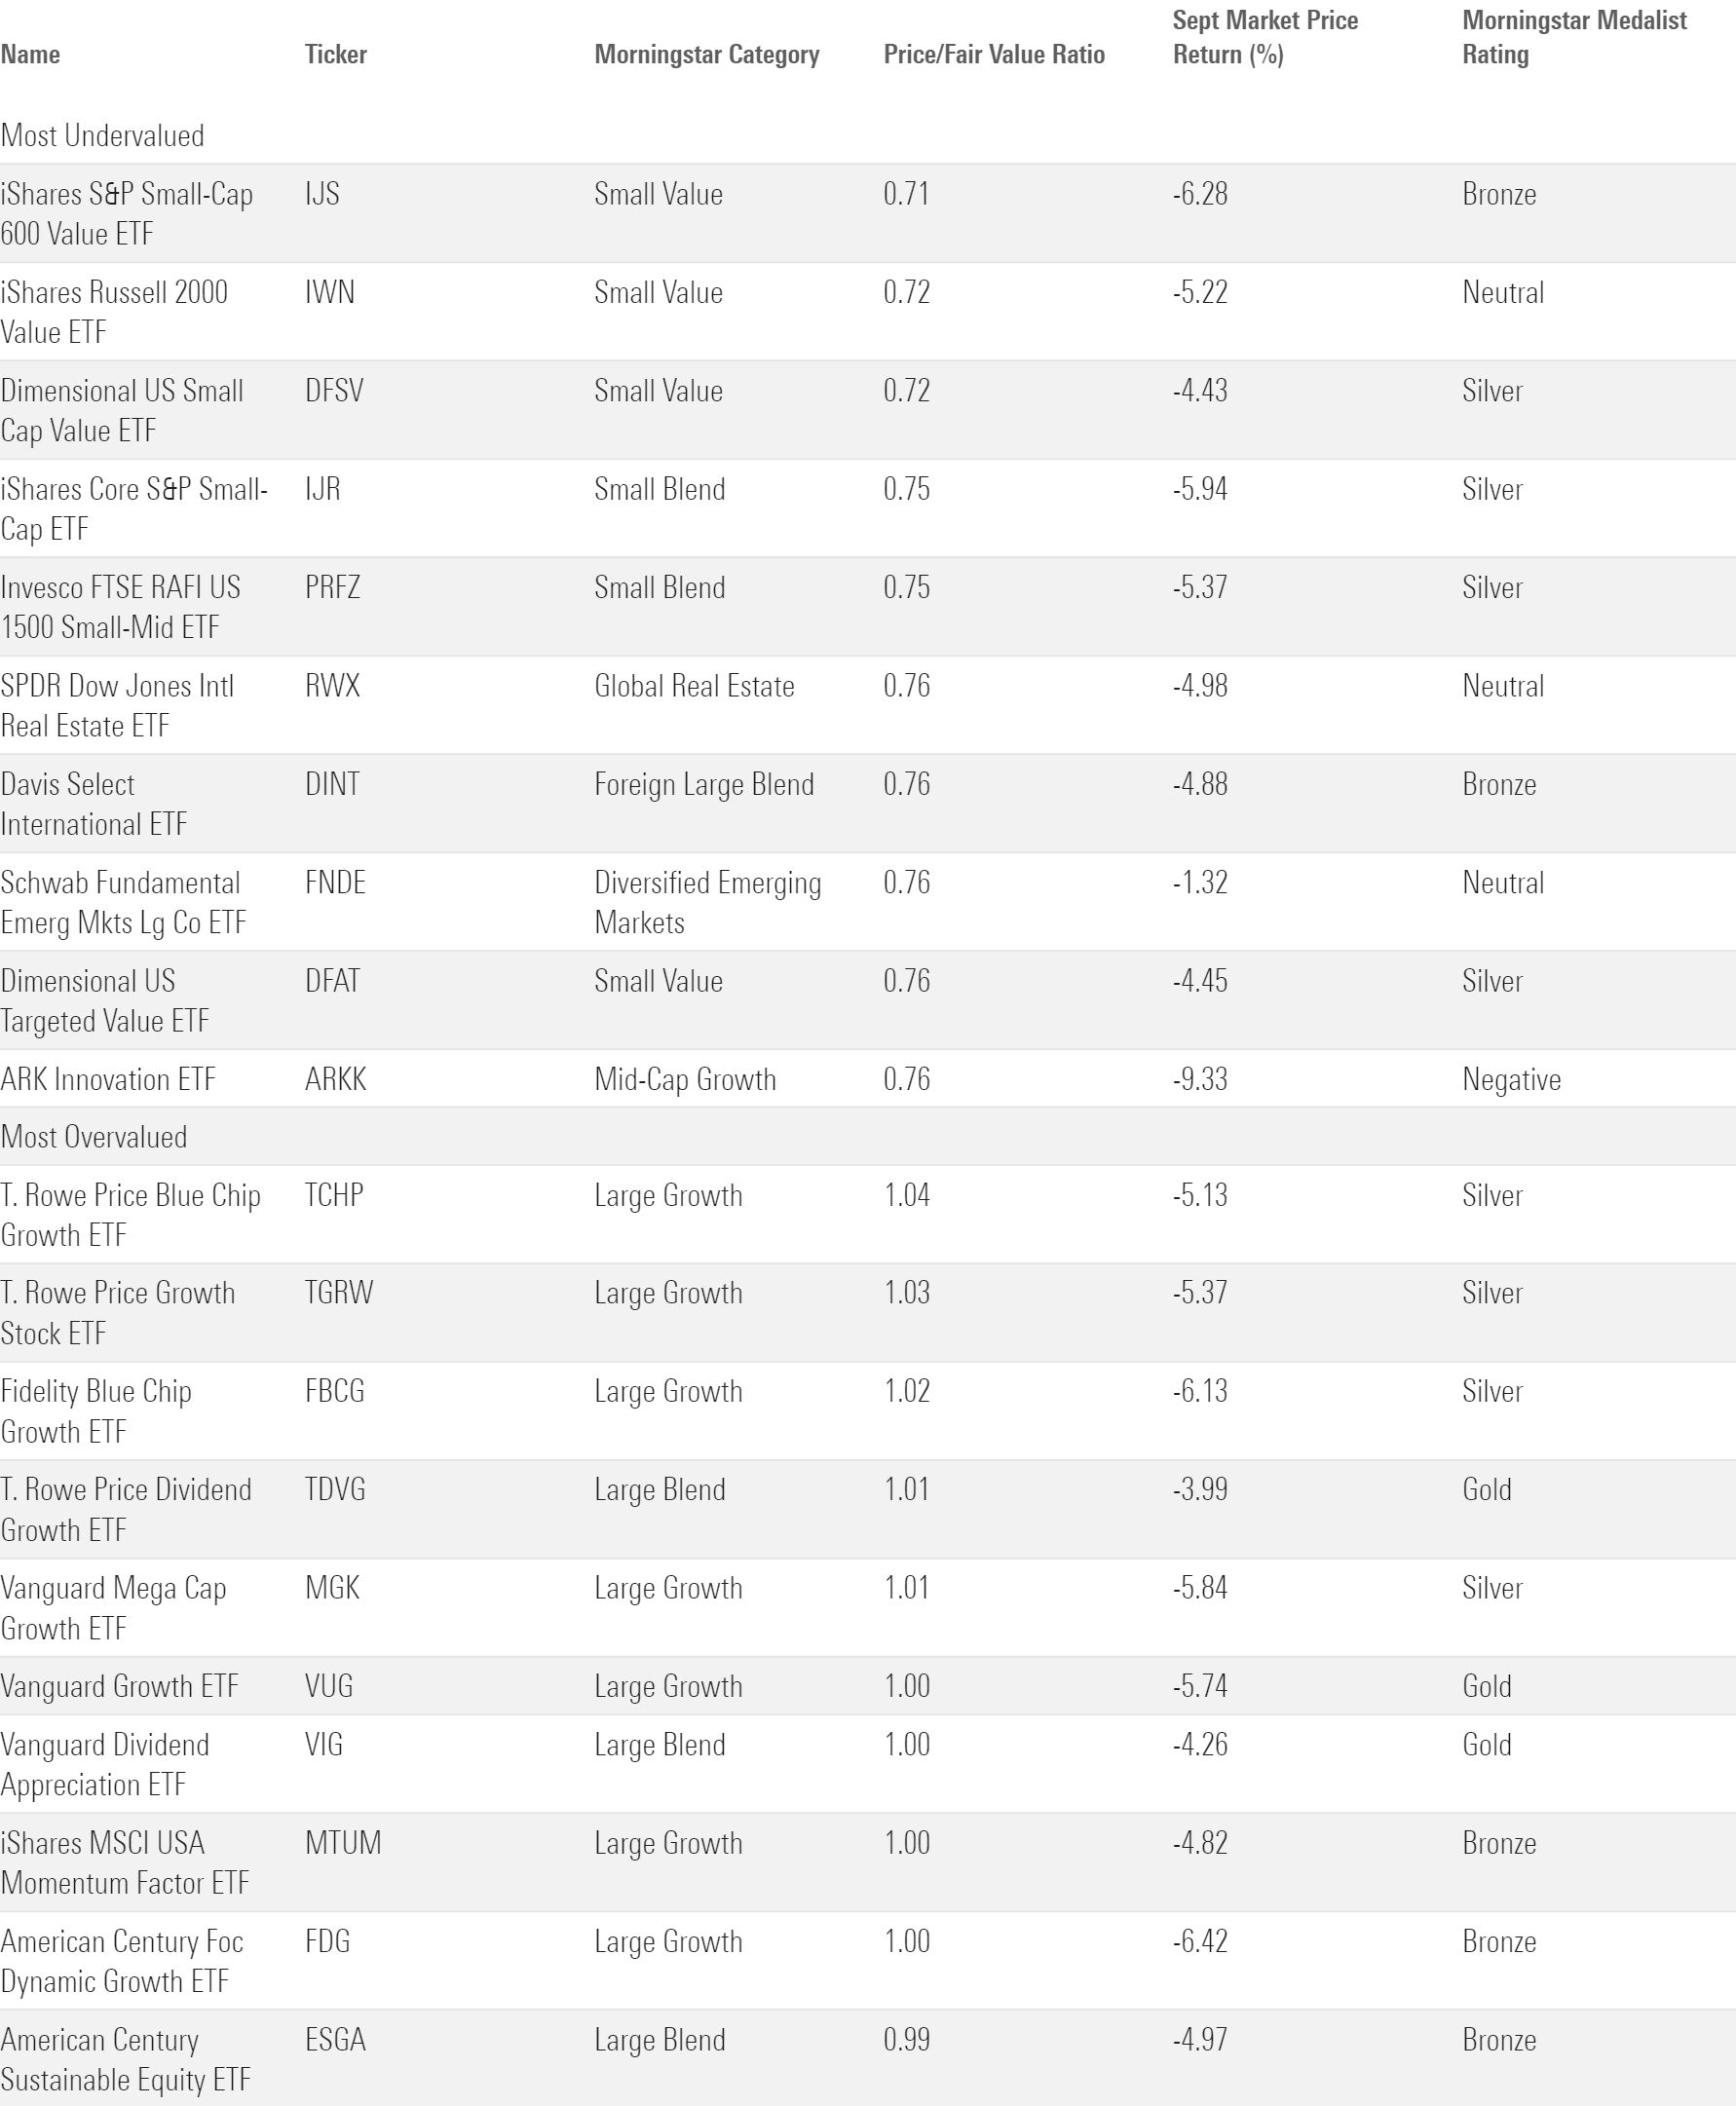
Investors hunting for bargains may find themselves sorting through the small-value category. U.S. small-value funds rated by Morningstar analysts came at a 25% discount on average—the cheapest among all categories. Small-value investors who subscribe to the “no pain, no premium” philosophy have felt plenty of the former this year. IShares S&P Small-Cap 600 Value ETF IJS, whose 29% discount was the widest among rated ETFs, shed 0.93% for the year to date through September—over 14 percentage points worse than IVV. The small-value ride has been turbulent, but these funds’ attractive valuations paint an encouraging picture for the days ahead.
Broad U.S. market trackers traded near their fair value at the end of August, but a pullback in September left them slightly undervalued. VTI sported a price/fair value ratio of 0.95 at the end of the third quarter. Investors can find better discounts overseas; VXUS traded 15% below its fair value instead of 5%. Foreign stocks have traded at cheaper valuations than their domestic peers over the past two decades, and that hasn’t translated into any performance edge. But a valuation spread of this magnitude may signal a bright future for investors willing to expand their horizons.
The author or authors do not own shares in any securities mentioned in this article. Find out about Morningstar’s editorial policies.
/cloudfront-us-east-1.images.arcpublishing.com/morningstar/T2LGZCEHBZBJJPPKHO7Y4EEKSM.png)
/cloudfront-us-east-1.images.arcpublishing.com/morningstar/ZHTKX3QAYCHPXKWRA6SEOUGCK4.png)
/cloudfront-us-east-1.images.arcpublishing.com/morningstar/MNPB4CP64NCNLA3MTELE3ISLRY.jpg)
:quality(80)/s3.amazonaws.com/arc-authors/morningstar/30e2fda6-bf21-4e54-9e50-831a2bcccd80.jpg)