
Why Do Bond Yields Keep Rising?
‘Higher for longer’ is Wall Street’s newest catchphrase.
/s3.amazonaws.com/arc-authors/morningstar/ed529c14-e87a-417f-a91c-4cee045d88b4.jpg)
By this time of the year, bond yields were supposed to be heading lower.
Instead, the opposite is happening. Yields on long-term U.S. Treasury bonds—which serve as a benchmark for many home mortgages and other key consumer and business borrowing rates—have risen to their highest level since October 2007.
On Thursday, the U.S. Treasury 10-year note hit a new recent high of 4.49%—up from 4.09% at the end of August and 3.79% at the start of 2023.
Not only that, but bond market pros are now saying that these higher rates could persist for some time. The hottest phrase in the markets has been “Higher for longer” since the Federal Reserve’s policy-making meeting last week.
Several issues have been driving bond yields higher over the last two months. Most prominent is the continued strength of the U.S. economy, especially the jobs market, which is seen as the reason the Fed will keep interest rates at or near current levels for longer than what had been expected. In addition, the market is adjusting to a flood of new government bond issuance.
Long-Term U.S. Treasury Yields
That’s translated into falling prices and rising yields for long-term bonds. For example, the Morningstar US Core Bond Index is down 0.6% in 2023, and the Morningstar US Treasury Bond Index is down 1.2%.
Notably, this movement is lessening the degree to which short-term yields are higher than long-term yields. Such a dynamic is known as an inverted yield curve, and it’s often seen as a precursor to a recession.
That’s a far cry from the first half of the year, when many investors and market strategists expected an economic slowdown (including a potential recession) to take rates lower and boost returns on bond investments.
“So many people were talking about 2023 being the year for bonds, but we just haven’t gotten out of this rate-hiking cycle,” says Alfonzo Bruno, an associate portfolio manager at Morningstar Investment Management.
Strong Economy Leading Rates Higher
The primary cause of the push higher in long-term bond yields is the resiliency of economic data, according to Steve Bartolini, who manages T. Rowe Price’s U.S. core bond strategy.
He notes that initial job claims for the most recent week came in at 201,000, which is “surprisingly low for where we are in the [economic] cycle.” As he explains, “You can see that the economy is slowing, but it’s just not slowing at a pace that we would have expected six, nine, or 12 months ago.”
In fact, the economy appears to have picked up steam in the third quarter. The Federal Reserve Bank of Atlanta’s GDPNow measure—a running assessment of the current pace of gross domestic product growth—suggests third-quarter GDP will clock in at a 4.9% rate, which would be up from the 2.1% posted for the second quarter and the strongest rate since the end of 2021.
This economic strength is leading to caution from the Fed, which doesn’t want to cut interest rates too quickly.
“Inflation has come off its peak as the headline [Consumer Price Index] has come down quite a bit,” says Bruno. “But there are pockets of inflation that are worrying for the Fed. “ He continues: “What the Fed doesn’t want to do is prematurely start paring back their hawkish stance when the labor market is as tight as it is.”
With a strong jobs market, if interest rates start to come down (especially on mortgages, autos, and other consumer borrowing), then demand could quickly flow back into the economy. That “could reignite inflation,” Bruno says.
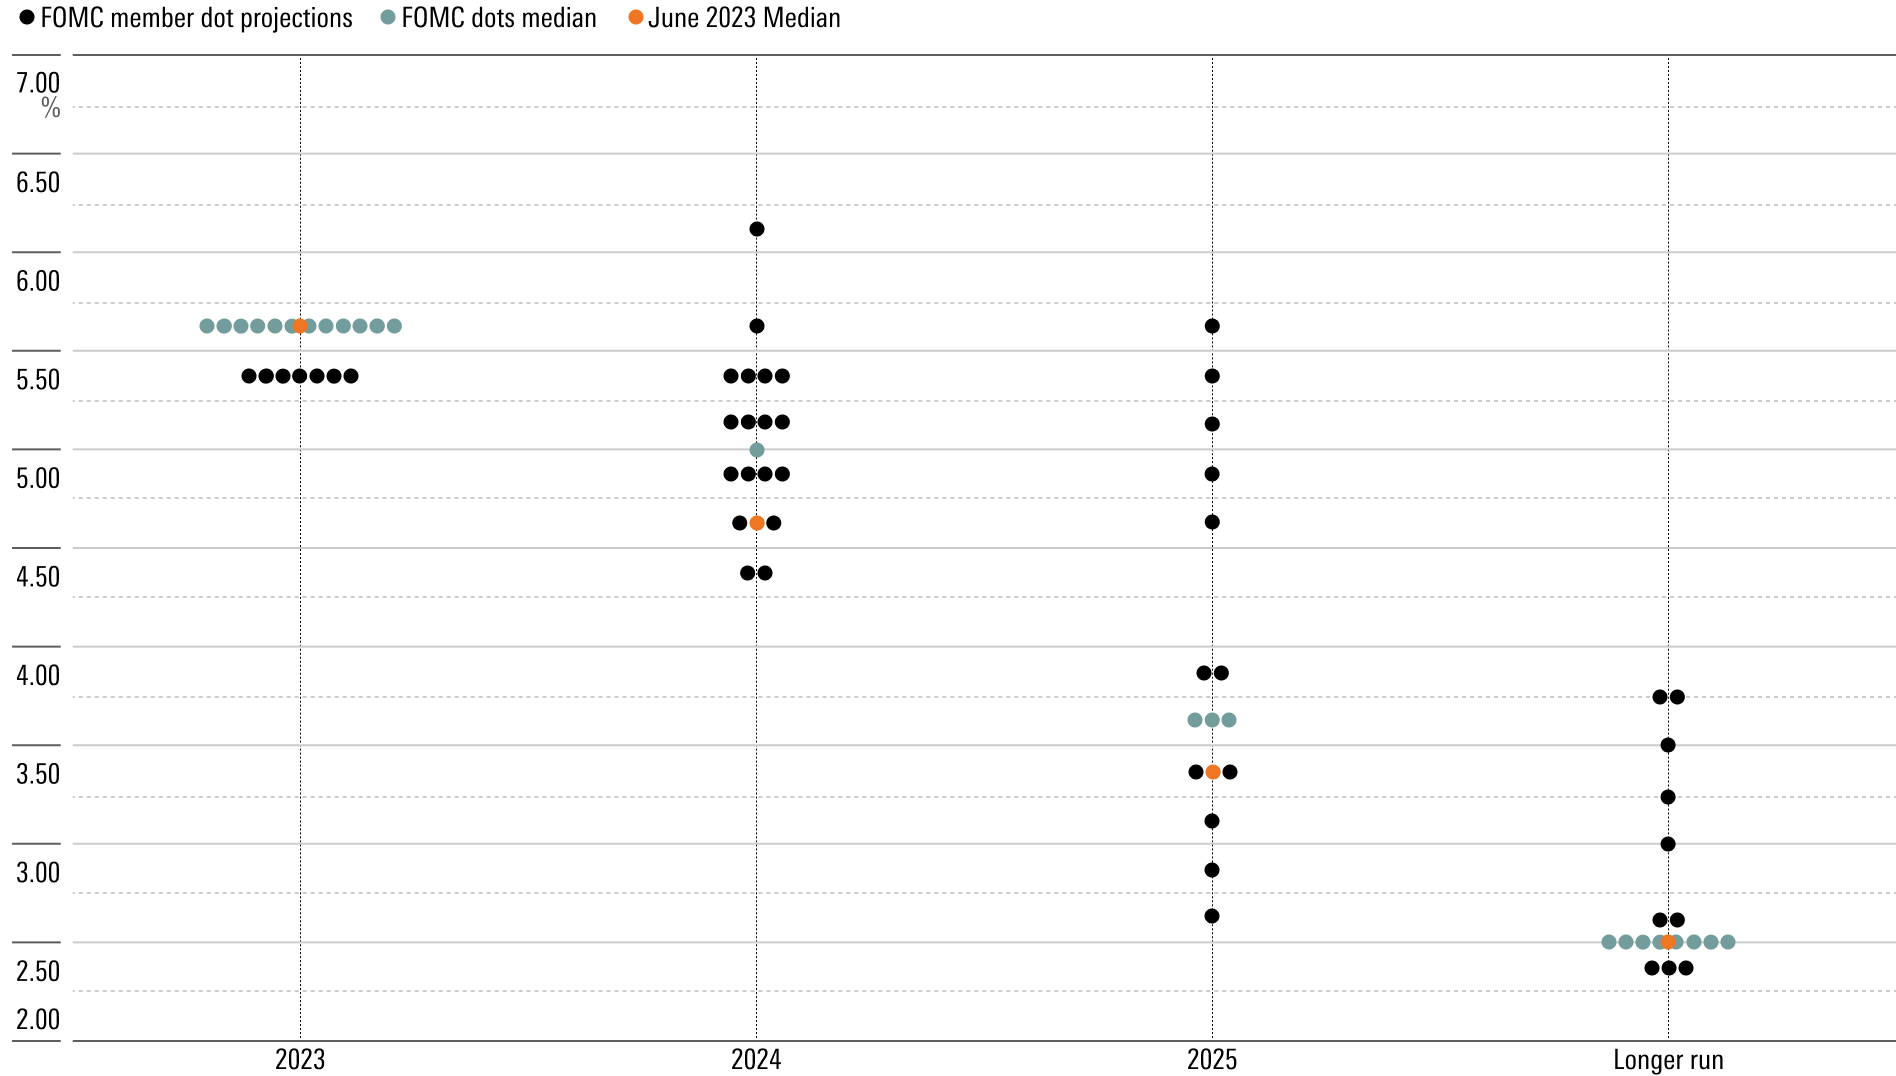
Fed’s Dot Plot Signals
Another factor contributing to the bond sell-off is messaging from the Fed at last week’s meeting that officials expect less in the way of interest rate cuts in 2024.
The current federal-funds rate target is 5.25%-5.50%. In March, the median expectation for where the rate would be at the end of 2024 was 4.3%, while in June it was 4.6%. With the Fed still forecasting another rate hike of 0.25 percentage points this year, that would have meant at least a full 1-percentage-point reduction next year. But the forecasts the Fed released last week show the funds rate at 5.1% at year-end 2024, which would imply a half-percentage-point cut at most. And the rate is expected to be 3.9% by the end of 2025.
“Some of the discussion around 2024 was slightly more hawkish than what had been expected,” Bartolini says. The Fed “went to two cuts next year after having shown four back in June, and 50 basis points is pretty big.”
The Dot Plot: Federal-Funds Rate Target Level
In addition, Bartolini points to discussions around the need for the Fed’s so-called neutral rate (the level of interest rates at which policy isn’t tight or loose) to be higher in the short run.
“Those are the fundamental components—better data, higher for longer—that have put pressure on the longer end,” he says.
As a result, bond traders have pushed back when they expect the first Fed rate cuts until sometime in the third quarter of 2024, according to the CME FedWatch Tool.
New Treasury Bond Issuance
A third factor contributing to the continued push higher in bond yields is the U.S. Treasury’s heavy pace of new debt issuance. At the end of July, bond investors were caught off-guard when the Treasury announced a significantly larger need to raise money than what they expected. The U.S. government now anticipates raising a net $1.007 trillion through bond sales in the third quarter—the largest-ever cash raise during a third quarter.
With this announcement, the supply/demand dynamic of the bond market was thrown off balance as bond dealers and investors factored in the additional amount of bonds entering the market at the same time that the fundamental backdrop was worsening.
This week, for example, the Treasury is scheduled to auction a hefty $134 billion of 2-, 5-, and 7-year notes.
The government’s stepped-up borrowing needs are adding to the weight on the longer end of the bond market, Bartolini notes. The issue, he explains, is that investors can still pick up 6-month Treasury bills yielding 5.5%, while a 5-year note is yielding around 4.6% and a 10-year note is yielding roughly 4.5%.
Treasury Yield and Federal-Funds Rate
While some investors might argue that this is a good time to lock in longer-term rates, Bartolini is cautious. “A 4.5% 10-year nominally sounds pretty attractive,” he says, “but you need to have high confidence in the economy rolling over.”
Yield Curve Inversion Lessens
One side effect of the rise in long-term yields is the lessening of the yield curve’s inversion.
The Treasury yield curve is a way to depict yields across the maturity of bonds issued by the U.S. government, from short-term debt to long-term debt. The most common way to look at the curve is to chart yields from Treasury 2-year notes out to those on 10-year bonds.
Most of the time, yields from longer maturities are higher than those of shorter-dated bonds, reflecting the greater risks of holding bonds for longer periods (particularly inflation). But under certain circumstances, like now, the shape of the curve is flipped, with short-term yields rising above long-term yields. In July, the gap between the 2-year and 10-year notes hit 1.08 percentage points—its greatest inversion since 1981.
But lately, that gap has been narrowing, falling back toward 0.6 percentage points. Bruno notes that the normal pattern is for an inversion to be unwound by short-term interest rates falling as the Fed cut rates—a process known as curve steepening. Instead, we’ve seen long-term yields rising while short-term rates stay locked in place.
“In periods of going from peak inversion to peak steepness, almost every single time this has occurred, the short end has come down much faster than the long end, which gets you to that steepening,” Bruno explains. “Never have we seen that long end come up to meet the short end.”
U.S. Treasury Yield Curves
The author or authors do not own shares in any securities mentioned in this article. Find out about Morningstar’s editorial policies.
/cloudfront-us-east-1.images.arcpublishing.com/morningstar/GJMQNPFPOFHUHHT3UABTAMBTZM.png)
/cloudfront-us-east-1.images.arcpublishing.com/morningstar/ZYJVMA34ANHZZDT5KOPPUVFLPE.png)
/cloudfront-us-east-1.images.arcpublishing.com/morningstar/LDGHWJAL2NFZJBVDHSFFNEULHE.jpg)
:quality(80)/s3.amazonaws.com/arc-authors/morningstar/ed529c14-e87a-417f-a91c-4cee045d88b4.jpg)