
It’s Too Soon to Say the Value Premium Is Dead
Investors face a choice: the comfortable path or the diversified one.
/s3.amazonaws.com/arc-authors/morningstar/8c5d95ea-6364-418e-82fc-473134024ece.jpg)

The underperformance of U.S. value stocks since the Great Recession has received much attention from the financial media, and prompted at least some investors to conclude that value investing is dead. That has led to papers being written, such as AQR’s May 2020 article, “Is (Systematic) Value Investing Dead?” Because the value premium has been much larger in small stocks than in large, we’ll review the performance of small-value stocks compared with broad market indexes. From 2008 through July 2023, while the S&P 500 returned 9.8% per year, the Fama-French small-value research portfolio returned 8.6%, an underperformance of 1.2 percentage points annually. (Fama-French data is from Ken French’s website.)
A Cautionary Tale
We heard the same argument about the death of the value premium in 2000. From 1994 to 1999, the S&P 500 returned 23.6%, annually outperforming the Fama-French small-value research portfolio by 7.2 percentage points. However, the declaration of the death of the value premium was premature. From 2000 to 2007, while the S&P 500 returned 1.7%, the Fama-French small-value research portfolio returned 16.2%, outperforming by 14.5 percentage points annually. Such performance should be a cautionary tale for those declaring the death of value.
If the underperformance of the value premium in U.S. stocks since 2008 was a sign that value was dead, we should see similar underperformance outside the U.S. From 2008 through July 2023, the MSCI EAFE Index returned 3.2%, but the Dimensional International Small Cap Value Index returned 5.2%, outperforming by 2.0 percentage points annually. In emerging markets, while the MSCI Emerging Markets Index returned 1.7%, the Dimensional Emerging Markets Targeted Value Index returned 4.1%, outperforming by 2.4 percentage points. Thus, outside the U.S., investors who diversified their portfolios to include small-value stocks benefited.
We can now examine how a globally diversified small-value-oriented portfolio performed over this 15-year-plus period relative to a market-based portfolio. Roughly allocating to the global market capitalization, we can assign a 50% weighting to U.S. stocks, a 37.5% weighting to non-U.S. developed stocks, and a 12.5% weighting to emerging-markets stocks. This hypothetical, globally diversified, market-based portfolio with those weights would have returned 5.84% annually, underperforming the return of 6.33% of a globally diversified small-value portfolio. And this was perhaps the worst 15-year period for value stocks, ending with the spread in valuations between growth and value stocks being about as wide as they were at the end of the dot-com boom—which foreshadowed the largest outperformance ever for small-value stocks.
It’s All About Valuations
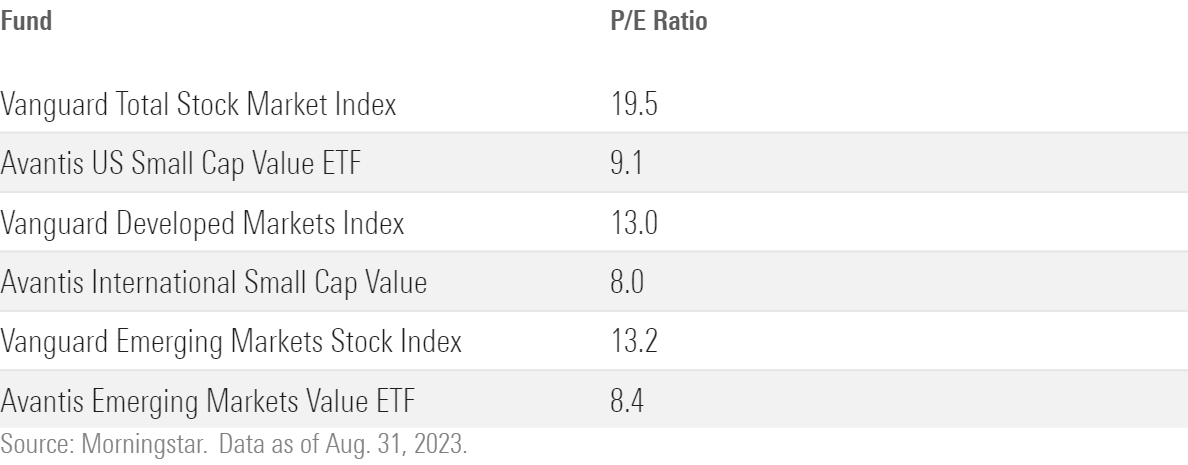
While all crystal balls are cloudy (we cannot know the future), valuations are the best predictor we have of future returns. And small-value stocks are trading at historically cheap valuations relative to their market counterparts, indicating the likelihood of a large premium going forward. The table below shows the relative valuations of Avantis US Small Cap Value ETF AVUV and Avantis International Small Cap Value ETF AVDV, along with Avantis Emerging Markets Value ETF AVES, compared with Vanguard’s broad market index funds, Vanguard Total Stock Market Index VTSMX, Vanguard Developed Markets Index VTMGX, and Vanguard Emerging Markets Stock Index VEIEX.
Valuations of Selected Indexes
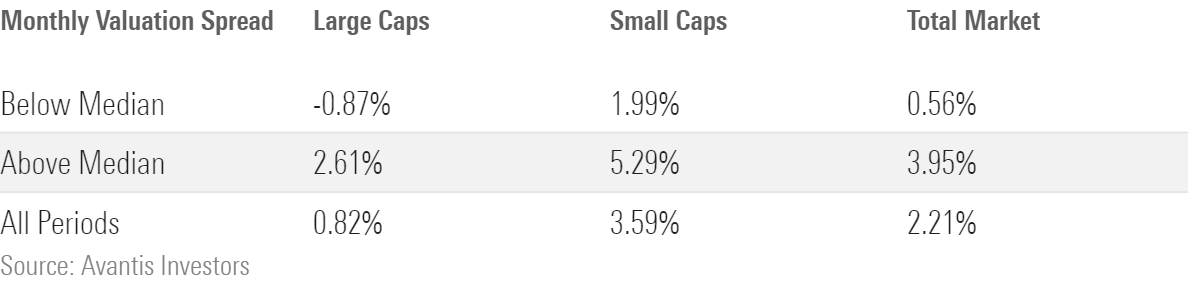
The increase in relative valuations has left the value spread at historically high levels. That raises the question: Does the value spread contain information about future returns? To answer that question, Avantis examined the historical data from Dec. 31, 1979, to Dec. 31, 2019. The table below shows the subsequent five-year return difference between value and growth when the valuation spread is below the median and above the median. It makes clear that the valuation spread does contain information about future returns—the future value premium tends to be much higher after periods when the valuation spread is above the median spread—and it is well above the median today.
Monthly Valuation Spreads
Investor Takeaways
While there are no crystal balls, there doesn’t seem to be any strong evidence that the value premium is dead. The poor recent performance has been due to changes in what John Bogle called the “speculative return” (the change in relative valuations). In support of this idea, consider the following.
Let’s go back in time to the end of 2016 and ask if the value premium was dead based on the out-of-sample returns (after the publication of the original Fama-French research on the value premium) over the 25-year period 1992 through 2016. During this period, the Russell 1000 Growth Index returned 8.2% per year, underperforming the Russell 1000 Value Index return of 10.1% per year, or by 1.9 percentage points; and the Russell 2000 Growth Index returned 7.4% per year, underperforming the Russell 2000 Value Index, which returned 11.5% per year, by 4.1 percentage points. The annual average value premium was 4.5%, not much different from the 5.1% premium for the period 1927 through 1991. I don’t think anyone would have declared the value premium dead based on those figures.
Yet, just a few years later, we hear a clarion cry that the publication of the Fama-French research and cash flows have killed the value premium. Does anyone seriously believe that 25 years was not enough time for publication of the research to kill the premium, but just a few more years did the trick? And if cash flows had killed the premium, 25 years of them should have been enough to accomplish the task.
In addition, as David Blitz demonstrated in his study “Are Exchange-Traded Funds Harvesting Factor Premiums?,” while some ETFs are specifically designed for harvesting factor premiums, such as the size, value, momentum, and low-volatility premiums, other ETFs implicitly go against those factors. Specifically, Blitz found that “from a factor investing perspective, smart-beta ETFs tend to provide the right factor exposures, while conventional ETFs tend to be on the other side of the trade with the wrong factor exposures. In other words, these two groups of investors are essentially betting against each other.” Despite what many investors believe, there has not been a massive net inflow into value stocks relative to growth stocks.
The Comfortable Path or the Diversified One?
The takeaway is that investors face a choice. They can either own a traditional 60% market-like equity/40% bond portfolio, which has most of its risk (as much as 90% or more depending on the maturity and quality of the bond holdings) concentrated in the single factor of market beta, or they can choose to diversify across as many unique sources of risk and return as they can identify that meet all their established criteria.
The first path is the comfortable one in the sense that the portfolio will not cause any tracking error regret—investors won’t be underperforming popular benchmarks that are reported on a daily basis by the financial media. On the other hand, that strategy will likely be highly uncomfortable during periods like 1973-74, 2000-02, and 2008, when the single factor (market beta) that dominates their portfolio’s risk suffers from severe bear markets (and also over long periods, such as the 15-year period 1929-43, the 17-year period 1966-82, and the 13-year period 2000-12, when the S&P 500 underperformed riskless one-month Treasury bills).
With that said, failing conventionally is always easier than failing unconventionally (misery loves company). And while based on the historical mean and volatility that the market beta premium should be expected to be negative about 9% of the time over 10-year periods, it seems likely that the odds have risen.
According to data from Ken French’s website, from 1927 through 2022 the market beta premium was 8.6%. However, most financial economists expect it to be much smaller going forward, perhaps by half. The reason is that valuations are now much higher—in 1927 the CAPE 10 (cyclically adjusted P/E ratio) was about 13, whereas today it is more than double that, at about 30. Higher valuations forecast lower future returns. A smaller premium with the same volatility means greater odds of negative returns for U.S. stocks.
The second path—diversification—is more likely to lead to successfully achieving goals. However, it does mean having to live with the fact that the portfolio will perform very differently than traditional portfolios, creating the risk of tracking variance regret. In that sense, diversification is not a free lunch. It means living through uncomfortable periods, even long ones. And during periods of failure, it means failing unconventionally, which is much harder to deal with.
Given that investors must accept that they will have to live through uncomfortable times on whichever path they choose, it seems logical to pick the one with the highest odds of achieving their goals. And that is choosing the more efficient portfolio—the one that is more diversified across factors that provide exposure to unique sources of risk such as size and value—and saying to oneself, “I don’t care about tracking variance regret because relativism [how you performed relative to some popular index] has no place in investing.”
The views here are the author’s. Larry Swedroe is head of financial and economic research with Buckingham Strategic Wealth. The opinions expressed here are their own and may not accurately reflect those of Buckingham Wealth Partners, collectively Buckingham Strategic Wealth and Buckingham Strategic Partners.
For informational and educational purposes only and should not be construed as specific investment, accounting, legal, or tax advice. Certain information is based on third party data and may become outdated or otherwise superseded without notice. Third party information is deemed to be reliable, but its accuracy and completeness cannot be guaranteed. By clicking on any of the links above, you acknowledge that they are solely for your convenience, and do not necessarily imply any affiliations, sponsorships, endorsements, or representations whatsoever by us regarding third-party websites. We are not responsible for the content, availability, or privacy policies of these sites, and shall not be responsible or liable for any information, opinions, advice, products or services available on or through them. Indices are not available for direct investment. Their performance does not reflect the expenses associated with the management of an actual portfolio nor do indices represent results of actual trading. Information from sources deemed reliable, but its accuracy cannot be guaranteed. Performance is historical and does not guarantee future results. All investments involve risk, including loss of principal. Mentions of specific securities are for informational purposes only and should not be construed as a recommendation to implement or use these funds in a portfolio. Neither the Securities and Exchange Commission (SEC) nor any other federal or state agency have approved, determined the accuracy, or confirmed the adequacy of this article. LSR-23-526
Larry Swedroe is a freelance writer. The opinions expressed here are the author’s. Morningstar values diversity of thought and publishes a broad range of viewpoints.
/cloudfront-us-east-1.images.arcpublishing.com/morningstar/6ZMXY4RCRNEADPDWYQVTTWALWM.jpg)
/cloudfront-us-east-1.images.arcpublishing.com/morningstar/URSWZ2VN4JCXXALUUYEFYMOBIE.png)
/cloudfront-us-east-1.images.arcpublishing.com/morningstar/CGEMAKSOGVCKBCSH32YM7X5FWI.png)
:quality(80)/s3.amazonaws.com/arc-authors/morningstar/8c5d95ea-6364-418e-82fc-473134024ece.jpg)