
Bond-Fund Investors Are Going Long. Should They?
For once, they are not choosing the highest-paying option.
/s3.amazonaws.com/arc-authors/morningstar/1aafbfcc-e9cb-40cc-afaa-43cada43a932.jpg)

Extending Maturities
It’s no surprise that money market funds have received $600 billion of net new moneys this year. With the Federal Reserve Bank continuing to raise interest rates, many money market funds now yield over 5%. That’s a far cry from essentially nothing, which they paid until recently.
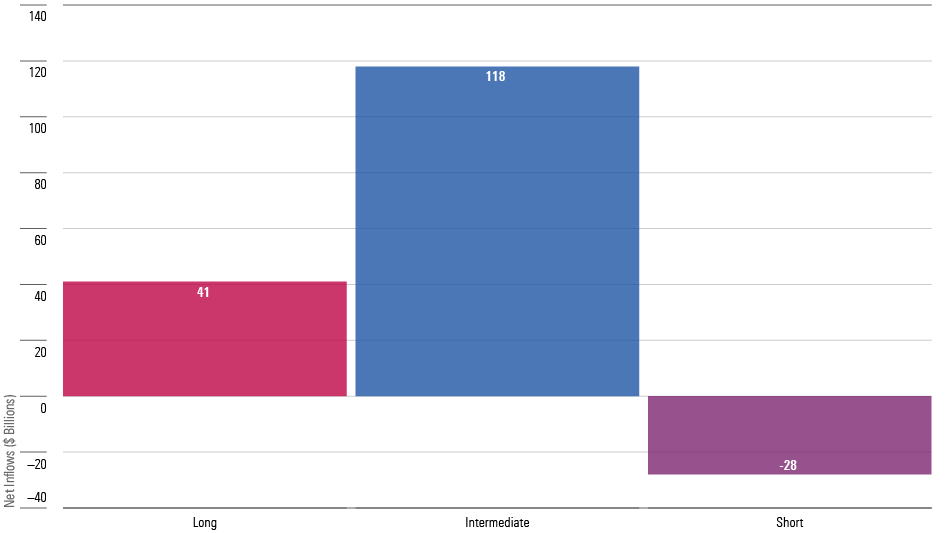
Curiously, though, taxable short-term bond funds have suffered net redemptions, despite enjoying similar conditions. Meanwhile, taxable intermediate- and long-term funds have registered impressive inflows.
Longer Bond Funds are Popular
Against the Grain
That behavior is remarkable for two reasons. First, intermediate- and long-term funds have posted feeble recent returns. Intermediate-term funds are in the red over the trailing one-, two-, and three-year periods, and are barely positive for the year to date. Long funds have fared even worse, being down in 2023 as well. Investors usually exit categories that have performed poorly rather than reward them.
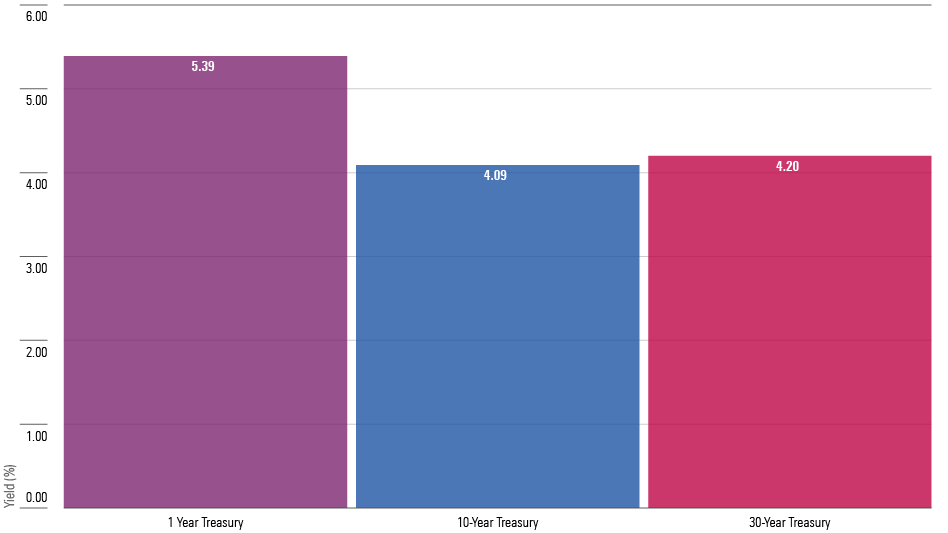
The other oddity is that, for once, bond-fund shareholders have not flocked to the highest-paying option. Although yields on intermediate- and long-term securities have also increased—thus causing their negative total returns—they nevertheless trail those of shorter securities. As the next chart demonstrates, one-year Treasuries now yield substantially more than do the government’s longer-term offerings.
Although Shorter Notes Have Higher Yields
The Trade-Offs
Short-term notes are almost riskless. If issued by the U.S. government, they offer the best credit quality found on the planet, save for gold, guns, and canned goods. And while they along with all fixed-income securities are vulnerable to inflationary shocks, their susceptibility is only temporary. Soon they will mature, allowing their holders to reinvest the proceeds at higher rates. When, then, have investors chosen more risk for less return?
The answer, of course, is that short-term rates ebb as well as flow. If the Federal Reserve has judged correctly, inflation will continue to subside, permitting the Fed to reduce interest rates. If so, yields on short-term bond funds will drop below those of their longer rivals. That process occurred in the early 2000s, and then again five years later, and then once more at the end of the past decade. Such is the nature of conventional business cycles.
Bond-fund investors have thus accepted lower current income, accompanied by greater volatility, in exchange for potentially higher future yields. Put succinctly, they have opted to forgo today for the sake of tomorrow.
It may be objected that this logic applies to bonds that are held directly, but not to bond funds, which become diluted by incoming investors. After all, should fixed-income yields decline, funds receiving new assets will be forced to buy lower-paying securities. True, but those latecomers will receive fewer shares for the dollars than did their predecessors, owing to the funds’ capital appreciation. The math will equalize. (This commentary provides further explanation.)
History’s Judgment
The question then becomes, Is this a sound decision? Only those who know the future of interest rates can answer for certain. Unfortunately, such sages are in very short supply. But history can be a useful guide. While it can offer no guarantees, it should at least be able to offer rough odds for the wager.
The Federal Reserve has demonstrated its commitment to fighting inflation by inverting the yield curve. The greater the inversion, the greater the likelihood that inflation will in fact retreat, thereby enabling intermediate- and long-term securities to prosper. A reasonable inquiry is therefore: 1) to see how today’s amount of yield-curve inversion compares with those of the past, and 2) to measure how bonds then performed, after those inversion peaks were reached.
The next chart addresses the first item. It depicts the highest level of yield-curve inversion for each decade (the data series begins in 1962), as computed by subtracting the yield on 10-year Treasuries from that of one-year securities. (Note: The number for the 2020s does not match that from the previous chart because that figure occurred in June.)
The Highest Inverted Yields, by Decade
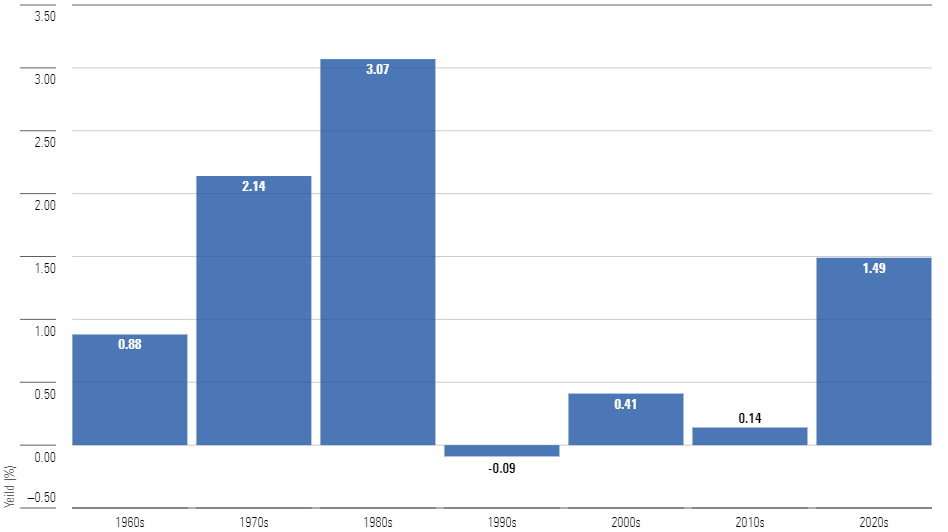
Although not unprecedented, today’s conditions are clearly uncommon. In fact, as the inversions reported for the 1970s and 1980s were related, occurring in late 1979 and then in 1980, one can fairly say that since the Kennedy Administration, only once before have short-term securities enjoyed such a yield advantage over their longer siblings. These are unusual times.
(In truth, the situation is even rarer than the illustration implies, as short-term yields were consistently low during the 1930s, 1940s, and 1950s.)
Future Returns
The next exhibit shows the relative performances of 10-year Treasuries when compared with those of one-year Treasuries, for the decade after the peak inversions occurred. A positive result indicates that the 10-year notes posted higher total returns for the period, while a negative result indicates the opposite.
A Bullish Sign?
A clean slate! To be sure, the results carry some caveats. There are only five data points, and as previously mentioned, the outcomes for the 1970s and 1980s are effectively the same observation. Also, while 10-year Treasuries did outgain short notes after achieving being inverted during the 1960s, their victory margin was slight and their volatility severe. I would not rate that showing as a triumph.
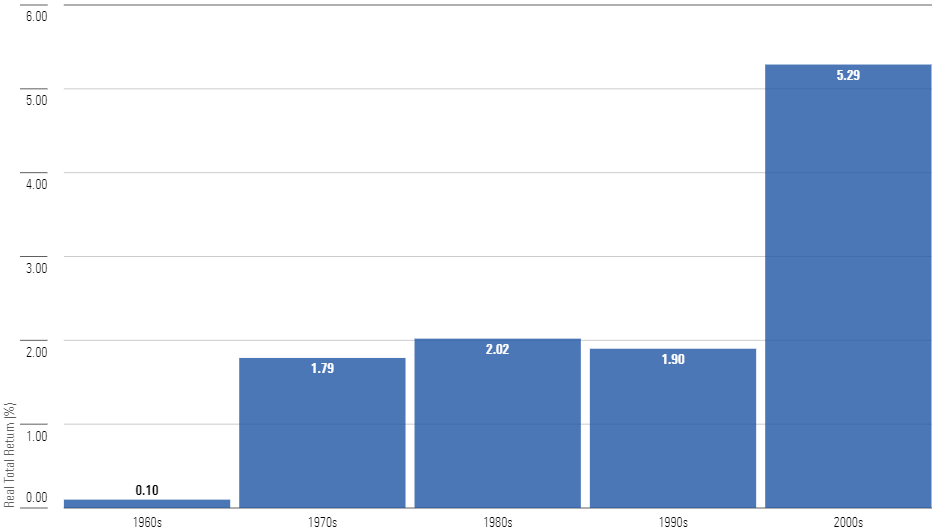
Thus far I have talked about relative returns. However, what ultimately matters for investors is absolute results. Did the investments outpace inflation? The final chart provides that information, by displaying the real total returns for 10-year Treasuries for each of the five periods. Also shown is their historic average over the entire study timeline, from January 1962 through July 2023.
Real Total Returns
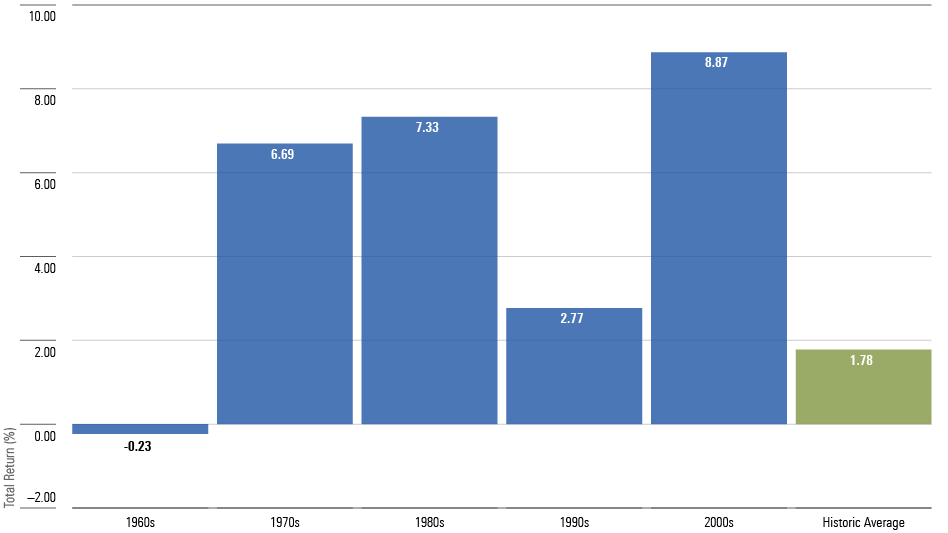
Once again, buying when the yield curve was inverted in the 1960s proved disappointing. While that approach fared no worse than holding cash, neither was it profitable. Since then, though, extending maturities during yield-curve inversions has been a reliably profitable strategy. Indeed, it twice (counting the 1970s and 1980s experiences as a single item) delivered some of the highest real returns that 10-year Treasuries have ever recorded.
Conclusion
There is a significant catch to this study: Investors can only know after the fact when inversion-curve peaks have occurred. It’s quite possible that the Federal Reserve will continue to increase short-term interest rates, which would likely generate additional losses for intermediate- and long-term securities. If so, this analysis is premature. Nevertheless, the exercise does suggest that today’s bond-fund investors have sound reasons for their actions. They are not flying blind.
The opinions expressed here are the author’s. Morningstar values diversity of thought and publishes a broad range of viewpoints.
The author or authors do not own shares in any securities mentioned in this article. Find out about Morningstar’s editorial policies.
/cloudfront-us-east-1.images.arcpublishing.com/morningstar/AGAGH4NDF5FCRKXQANXPYS6TBQ.png)
/cloudfront-us-east-1.images.arcpublishing.com/morningstar/G3DCA6SF2FAR5PKHPEXOIB6CWQ.jpg)
:quality(80)/s3.amazonaws.com/arc-authors/morningstar/1aafbfcc-e9cb-40cc-afaa-43cada43a932.jpg)