
Markets Brief: These Funds Fared the Worst In the Bond Market Selloff
A brutal three months put some funds on track for their third consecutive annual decline.
/s3.amazonaws.com/arc-authors/morningstar/8b2e267c-9b75-4539-a610-dd2b6ed6064a.jpg)

Investors appear to be out of the woods with the rebound in bond prices over the last two weeks, but many bond funds are still flirting with an unprecedented third consecutive year of losses.
As recently as Oct. 19, many of the largest bond funds were solidly in the red for 2023. The $91.5 billion iShares Core US Aggregate Bond ETF AGG was down 3.3% for the year through Oct. 19, while the $54.7 billion Metropolitan West Total Return Bond Fund MWTSX was down 4.1%. Overall, the average fund in the Morningstar Intermediate Core Bond Fund category—a key building block of just about every investor’s diversified portfolio—was down 3.1% at that point.
These declines came on the heels of 2022′s bear market, during which most bond funds experienced their biggest losses in history, as well as a year of smaller declines in 2021.
Fueling this most recent batch of losses was a selloff in the bond market that took yields sharply higher. The yield on the U.S. Treasury 10-year note hit a 16-year high near 5.00% on Oct. 19, up from 3.97% on July 31. During that time frame, the average intermediate core bond fell 5.12%.
However, bonds have bounced since then, and while returns may be uninspiring, the picture isn’t as bleak. The average intermediate core bond fund is down only 0.8% for the year as of Nov. 9.
Year-to-Date Performance
An exception comes with funds focused on long-term bonds, which are most sensitive to rate changes. With the yield on the 10-year note still higher by 74 basis points since the beginning of the year, the average long government bond fund is down 8.1% in 2023 and down an average of 14.8% over the past three years.
Sparking the rebound in bond prices was an example of the adage that “good news comes in threes.” First, the U.S. Treasury announced it would issue less debt than expected in the fourth quarter. For weeks, large Treasury auctions have pushed up the supply of bonds, which depressed prices. On Wednesday, the Federal Reserve elected to keep interest rates steady. Then the Friday jobs report showed slower job growth than expected in October, supporting the idea that the Fed won’t raise rates at its December meeting.
Fed chair Jerome Powell has cautioned that officials are still keeping the door open for rate hikes to ensure inflation has been tamed. The belief that the Fed is done raising rates faces a key test in the coming week with Tuesday’s release of the October Consumer Price Index report. A hotter-than-expected reading on inflation could renew expectations for another hike.
Better News for Bond Funds
The bounce in the bond market came after investors endured the steepest drawdown since last year. Bond prices started to steadily slide in August after the Treasury announced it would need to issue a large amount of debt in the fourth quarter. “There were multiple factors that caused the 10-year Treasury to cross 5%,” says Morningstar analyst Saraja Samant. She points to inflation proving to be stickier than expected, as well as investors accepting that interest rates would need to stay “higher for longer.”
During the almost three-month period of decline that began in August, the iShares Core US Aggregate Bond ETF fell 5.21%, the biggest decline among the 10 largest bond funds. Among the largest actively managed funds, the Metropolitan West Total Return Bond Plan fell the hardest with a 6.14% loss.
Funds Hurt in the Drawdown
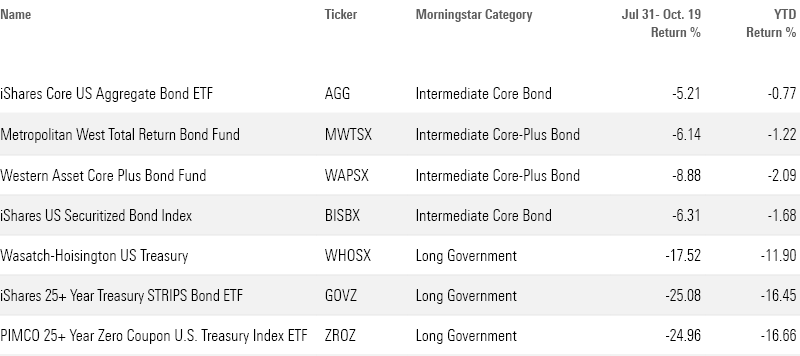
This year’s drawdown wasn’t as severe as the losses many funds endured in 2022. The iShares Core Us Aggregate Bond ETF lost 13.1%, making for its worst year on record.
Similarly to last year’s selloff, long-government funds took the largest losses due to their exposure to Treasury bonds with long durations, a measure of interest rate sensitivity. The average long-government fund fell 9.3% in this year’s drawdown. “Most of the selloff has been due to duration,” says Samant.
Funds focused solely on U.S. Treasury bonds, like Wasatch-Hoisington US Treasury WHOSX, experienced the largest losses during this year’s selloff. The $231 million fund declined 17.52%. Samant says that’s not surprising because the fund only holds long-term Treasury bonds and doesn’t invest in other bonds backed by government agencies, like mortgage-backed securities, which could carry less duration risk.
A handful of passively managed funds took larger losses. The $144.5 million iShares 25+ Year Treasury STRIPS Bond ETF GOVZ fell 25.1%, and the $1.1 billion PIMCO 25+ Year Zero Coupon US Treasury ETF PEDIX declined 25%.
Losses for core bond funds were less severe due to their shorter durations and more diversified portfolios. In addition to U.S. Treasury bonds, core bond funds hold a mix of corporate and securitized debt. The $21.8 billion Western Asset Core Plus Bond WAPSX fell 8.9%. The fund’s “persistent long-duration bet” was to blame, according to Morningstar senior research analyst Mike Mulach. Last year the fund declined 34%, which put it in the 99th percentile of intermediate-term core plus funds.
Among passive intermediate core funds, the $4.3 billion iShares US Securitized Bond Index BISBX fell the hardest, with a 6.31% loss during the period.
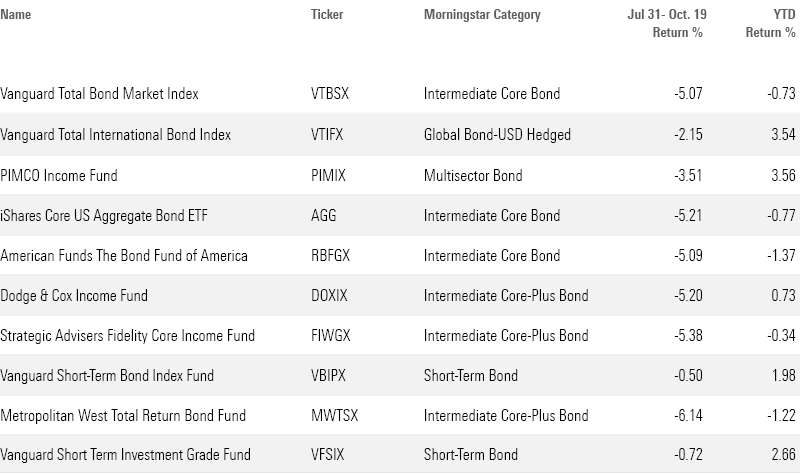
Widely-Held Bond Funds’ Performance
When it comes to the largest bond funds, the drawdown put many funds on track for their third annual loss, which would be unprecedented. The $533.8 billion Vanguard Total Bond Market Index VTBSX - the largest bond fund - is down 0.7% as of Nov.9.
While intermediate-term core and short-term bonds are close to breaking even for the year, losses for long-term bond funds are near double digits. The largest long government fund, the $41.8 billion iShares 20+ Year Treasury Bond ETF TLT, is down 9.3% for the year. This comes after the fund lost 31.2% last year.
International and short-term bond funds though, on average, are on track to end the year in positive territory. The $185 billion Vanguard Total International Bond Index VTIFX is up 3.5% through Nov. 9 and the $57.3 billion Vanguard Short-Term Bond Index VBIPX is up 2%.
Largest Bond Funds
For the Trading Week Ended Nov. 10
- The Morningstar US Market Index rose 1.1%.
- The best-performing sectors were technology, up 4.4% and communication services, up 1.1%.
- The worst-performing sector was energy, down 4.2%.
- Yields on 10-year U.S. Treasury notes rose to 4.61% from 4.52%.
- West Texas Intermediate crude prices fell 4.15% to $77.17 per barrel.
- Of the 849 U.S.-listed companies covered by Morningstar, 328, or 39%, were up, and 521, or 61%, were down.
What Stocks Are Up?
The RealReal REAL, Datadog DDOG, and TripAdvisor TRIP.
What Stocks Are Down?
The author or authors do not own shares in any securities mentioned in this article. Find out about Morningstar’s editorial policies.
/cloudfront-us-east-1.images.arcpublishing.com/morningstar/MQJKJ522P5CVPNC75GULVF7UCE.jpg)
/cloudfront-us-east-1.images.arcpublishing.com/morningstar/ZYJVMA34ANHZZDT5KOPPUVFLPE.png)
/cloudfront-us-east-1.images.arcpublishing.com/morningstar/S7NJ3ZTJORFVLCRFS2S4LRN3QE.png)
:quality(80)/s3.amazonaws.com/arc-authors/morningstar/8b2e267c-9b75-4539-a610-dd2b6ed6064a.jpg)