
14 Charts On New Bull Market for Stocks, Mixed Returns for Bonds in Q2
A look back at the market’s second-quarter performance as investors wrestled with a changing outlook for the Fed.
/s3.amazonaws.com/arc-authors/morningstar/ba63f047-a5cf-49a2-aa38-61ba5ba0cc9e.jpg)
This article is part of Morningstar’s Q2 market review and outlook.
As investors grew increasingly confident that any recession is still far off on the horizon, stocks extended their gains during the second quarter, potentially kicking off a new bull market in the process. But in the bond market, it was a mixed picture, with expectations growing that the Federal Reserve will be taking interest rates still higher and holding them there longer.
Under the hood of the stock market rally, for much of the quarter only a handful of stocks—the largest, growthiest tech names, including Apple, Microsoft, and Nvidia—were responsible for nearly all gains through May. Prior to June, without the supersized returns from these stocks, the overall market would have been flat, making for the most concentrated market in history. By quarter’s end, however, the rally did broaden thanks to gains in Eli Lilly LLY, JPMorgan JPM, and Adobe ADBE.
As the Federal Reserve brought interest rates to a pause—while signaling that it may continue to raise rates again as long as inflation remains elevated—volatility smoothed for the stock market. But bonds stayed turbulent.
U.S. Stock Market Performance
Key Stats: Q2 2023 Market Performance
- Stocks rose 8.5% for the second quarter and 16.5% for the calendar year as measured by the Morningstar US Market Index.
- The leading contributors were tech giants Apple AAPL (up 17.8% for the quarter and 49.6% for the first half of the year), Microsoft MSFT (up 18.4% for the quarter and 42.6% for the first half), Nvidia NVDA (up 52.3% for the quarter and a whopping 189.5% for the first half), and Amazon AMZN (up 26.2% for the quarter and 55.2% for the first half).
- In 2023 through May, the top 10 stocks were responsible for 9.3 percentage points, or 97%, of the U.S. market’s overall 9.6 percentage-point gain. In June the concentration broadened, with stocks like Eli Lilly and Adobe also contributing to the gains.
- Nvidia’s 189.5% gain makes for the stock’s best performance in the first half of any year since the company went public in January 1999.
- 2023 has seen the best first-half performance for the Morningstar US Technology, Communication Services, and Consumer Cyclical Indexes in their entire tracked histories (since 1999).
- In June, stocks entered a new bull market, up more than 20% from their October 2022 low.
- The Federal Reserve held rates steady at its June policy meeting, its first pause in hiking rates in 15 months.
- The yield curve remained inverted for the fifth quarter in a row, indicating the possibility of a recession.
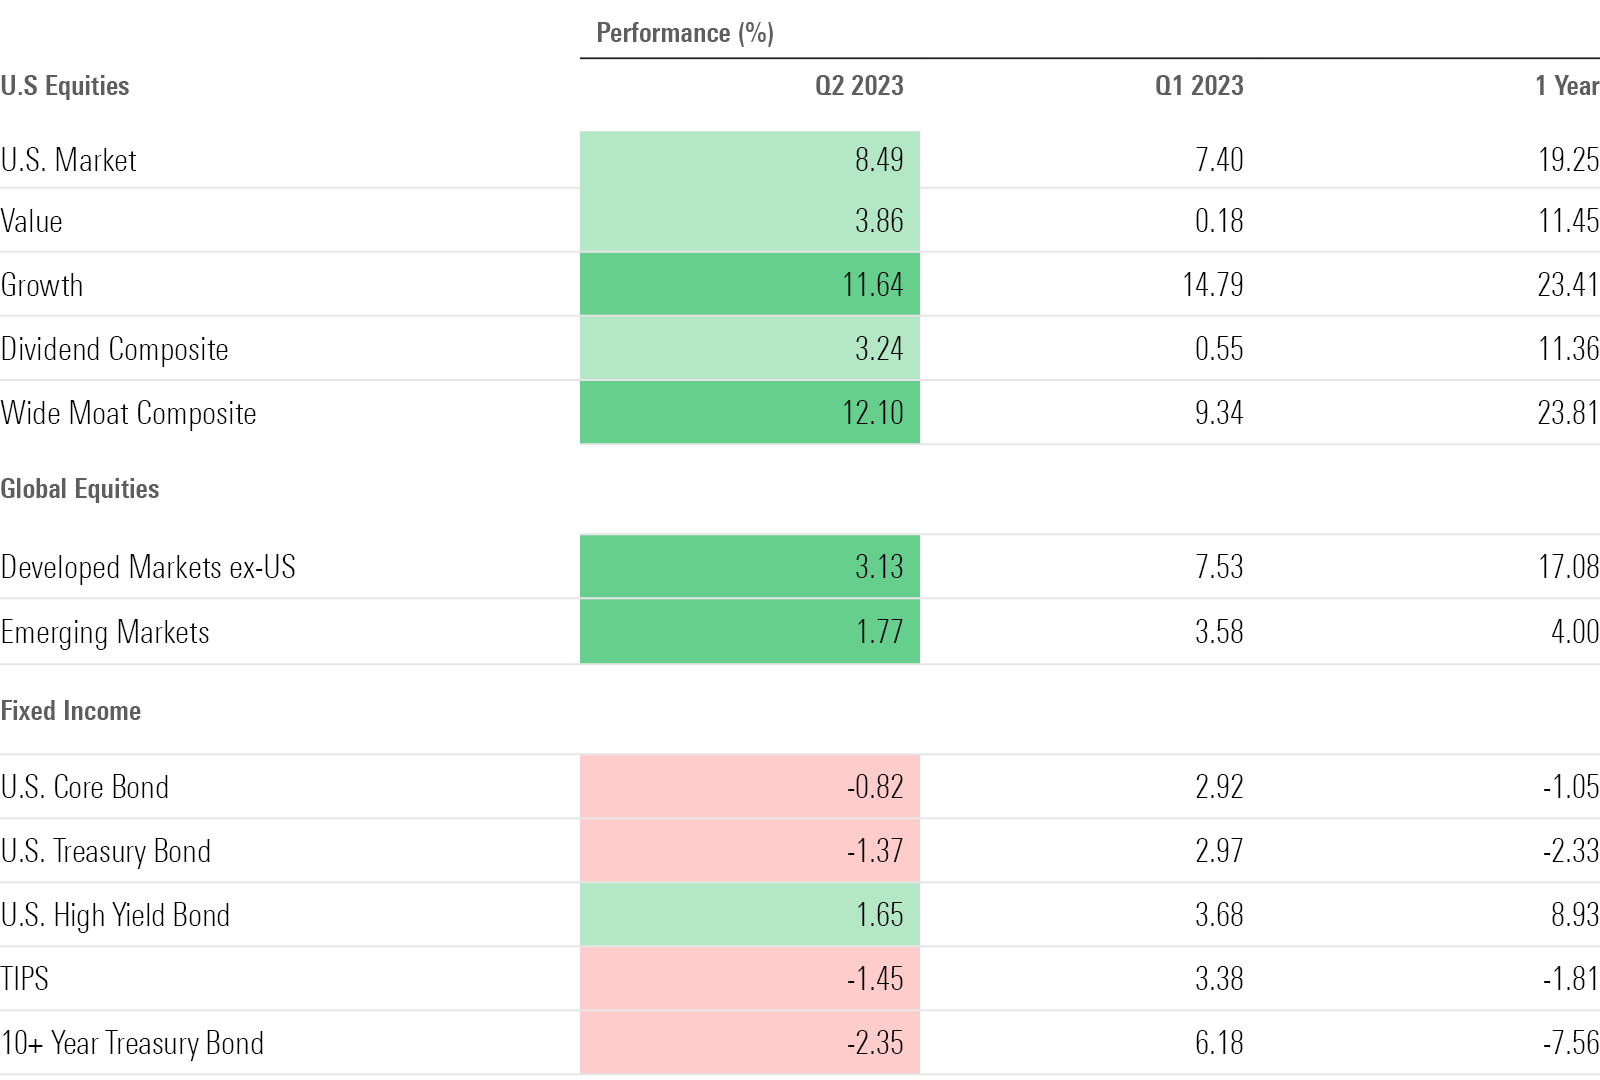
Quarterly Market Performance Barometer
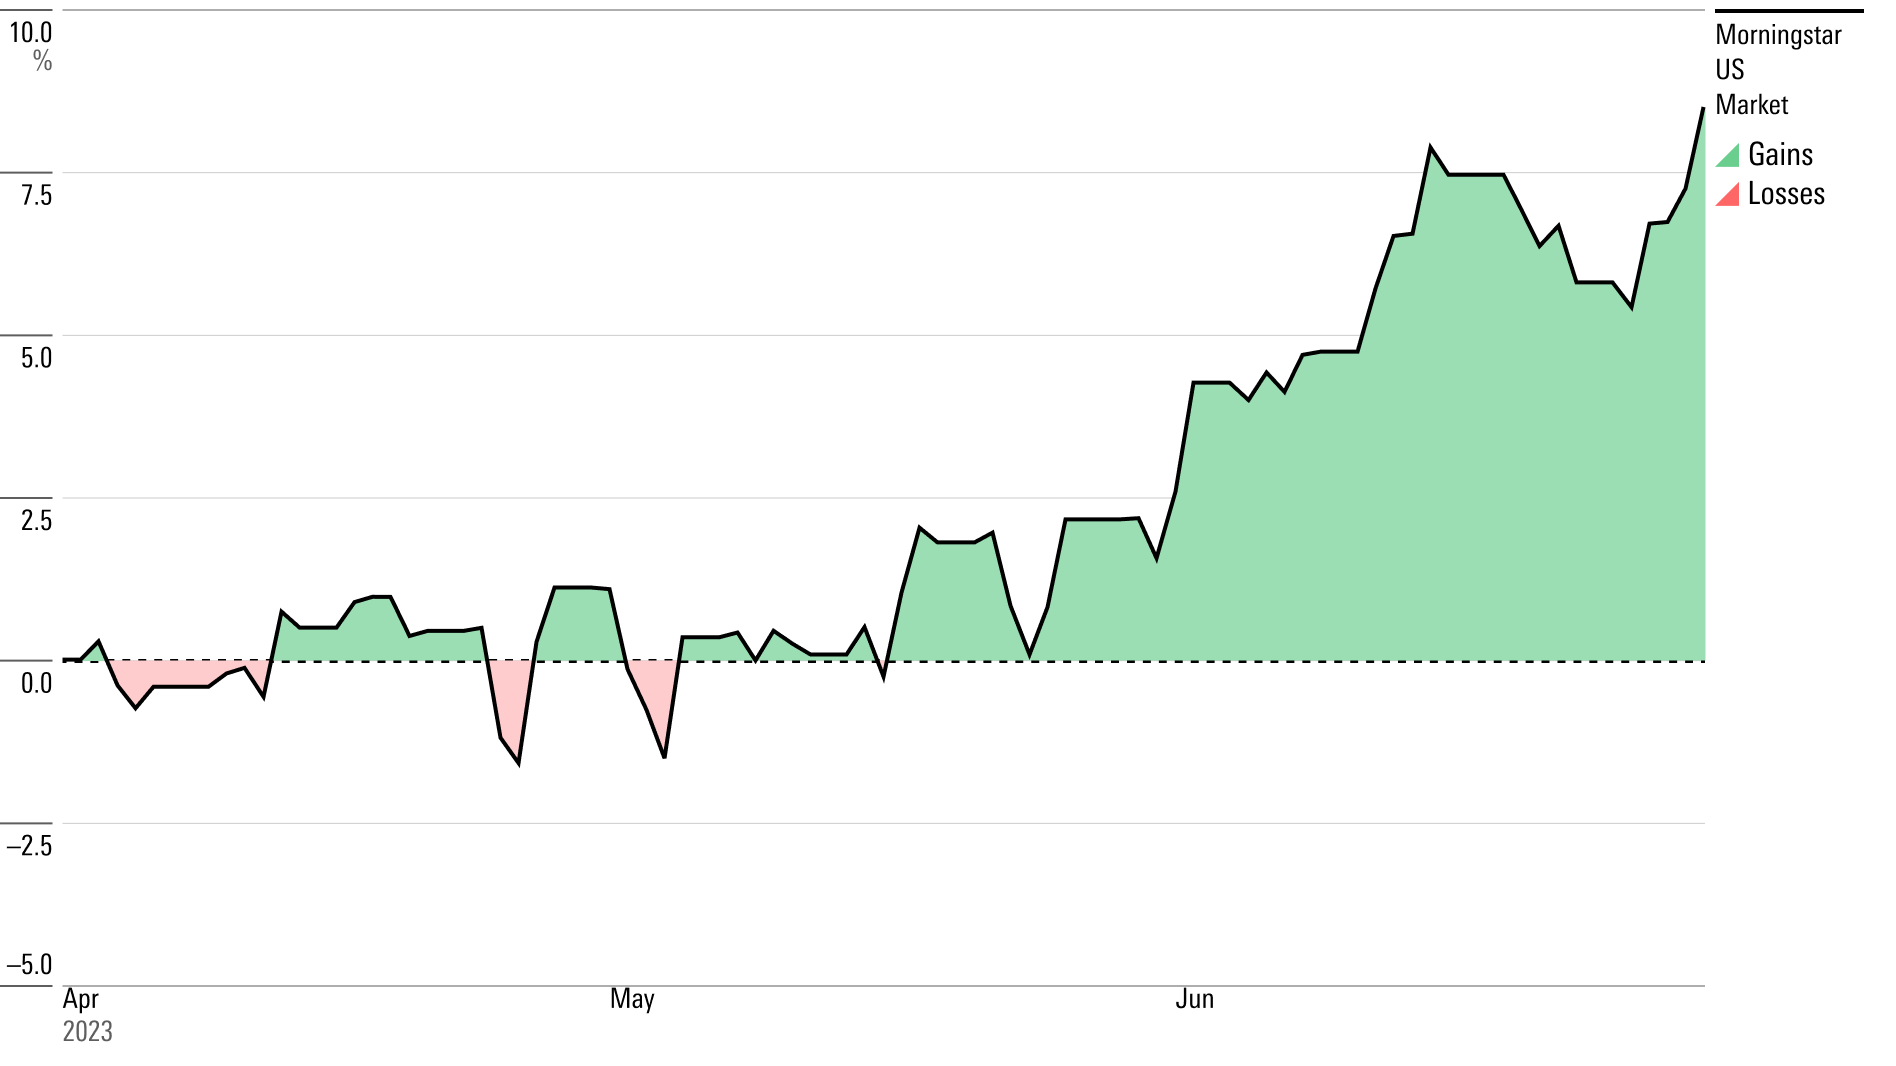
Stock Market Performance
Over the second quarter, the U.S. stock market gained roughly 10%, potentially landing it in a new bull market and leaving it up about 16% from where it started the year.
In June, the Morningstar US Market Index finally crossed into bull territory—up more than 20% from its most recent low—after 2022′s abysmal bear market. Gains were driven by the same fast-growing names that led stocks into that bear market, such as Microsoft and Apple.
Stocks have broadly pushed higher from their October low. While there is no official scoring of what constitutes a bear market, many consider a rise of 20% from a market trough to be the start of a bull period. The rally in the Morningstar US Market Index crossed that threshold on June 6, 2023, when the index closed 20.4% above its October trough.
The second quarter’s gains were concentrated in June, when the US Market Index rose roughly 4%, following smaller steps forward in April and May.
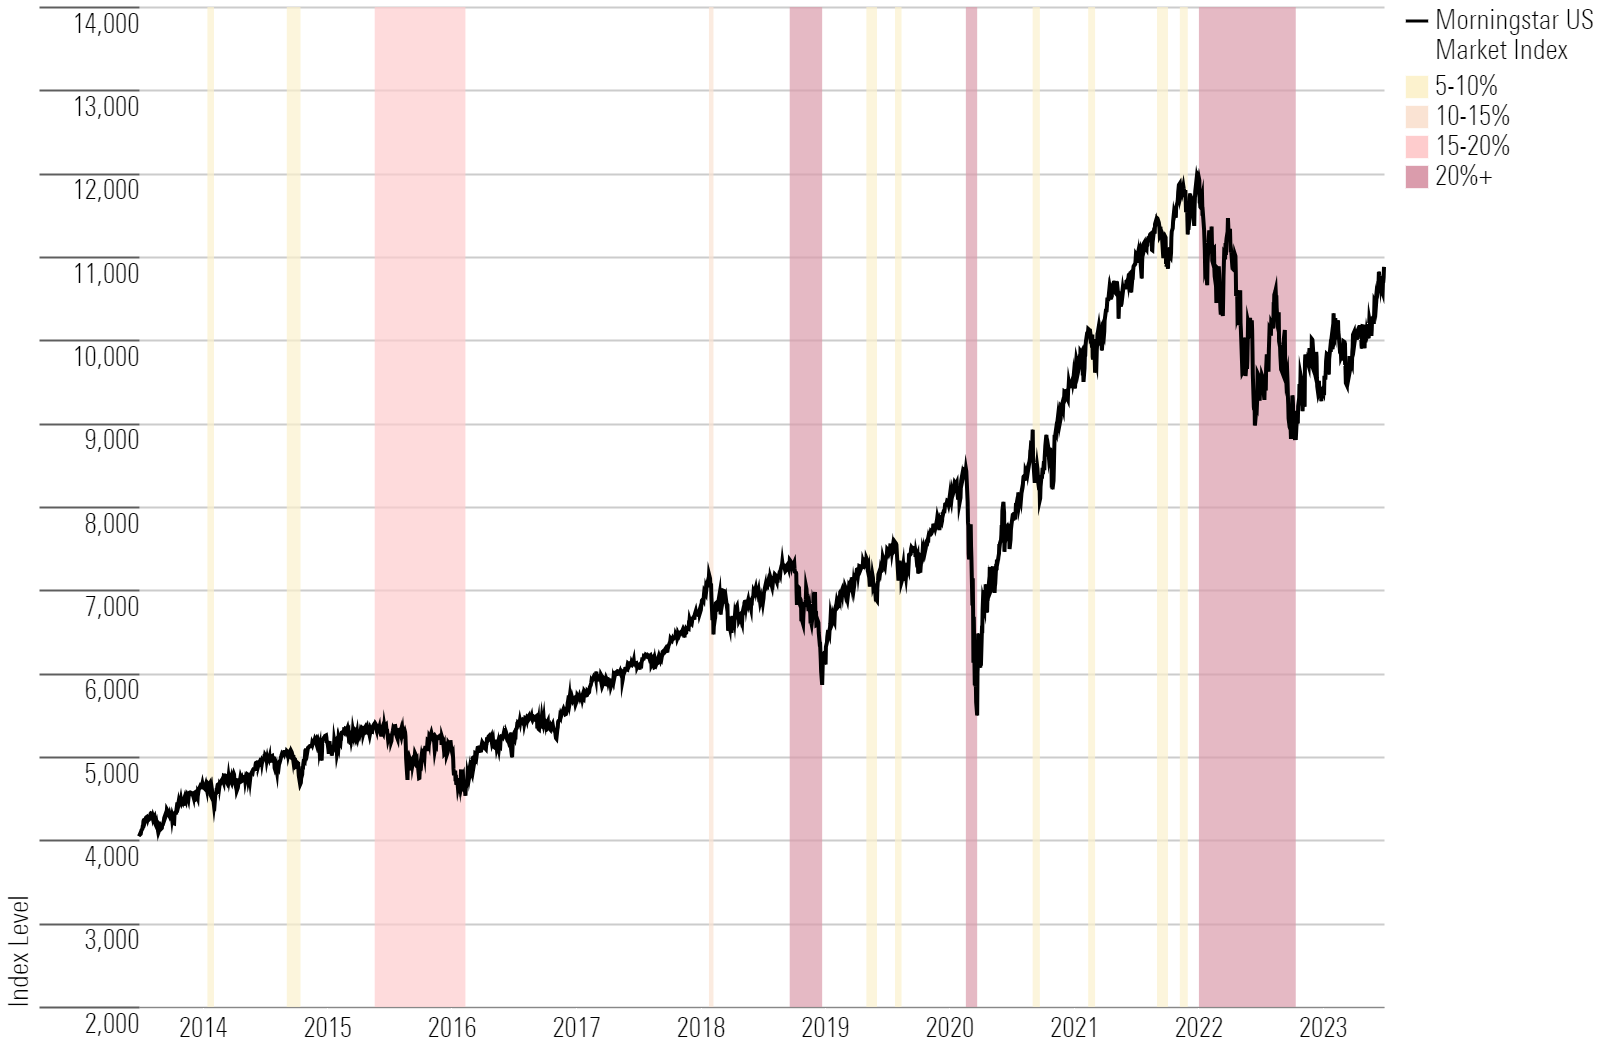
Stock Market Pullbacks
Value Stock vs. Growth Stock Performance
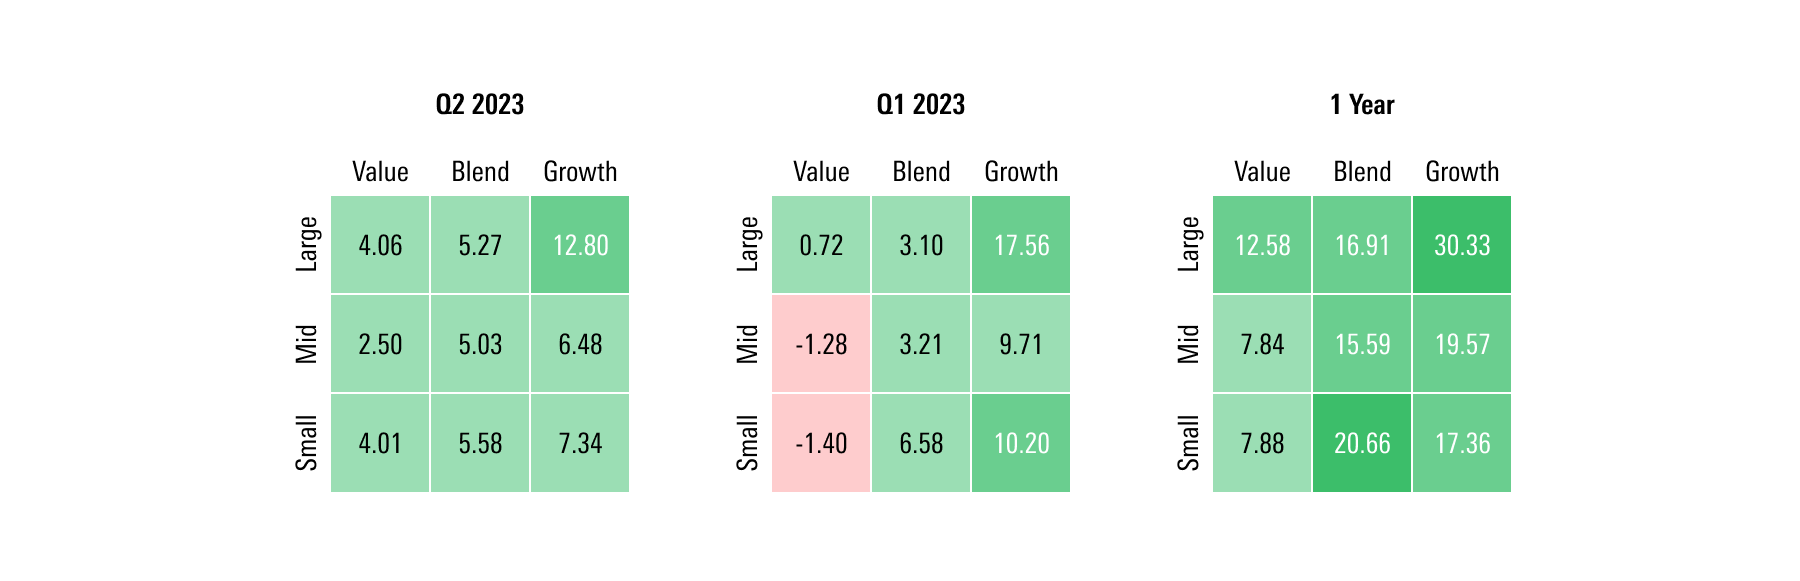
Growth stocks continued their strong run versus value stocks during the second quarter. That has made the group the clear winner for the first half of 2023 after it was beaten into the ground in 2022.
The Morningstar US Growth Index ended the quarter with a gain of 11.6%, up roughly 28% in 2023. Value stocks ended the quarter slightly above where they started, with the Morningstar US Value Index up 3.9% for the second quarter and 4.1% for the calendar year.
Morningstar assigns every stock it covers a style score. These scores are relative, with companies landing in the value, core, and growth categories of the Morningstar Style Box. A company’s style score is based on metrics such as growth rates for earnings, sales, book value, and cash flow. It also factors in dividend yields and relative valuations such as the price/projected earnings ratio, price/book, price/sales, and price/cash flow. Growth stocks have been more sensitive to the latest cycle of interest-rate increases (and interest rates in general) because their stock prices depend heavily on expectations for future earnings.
From a market-cap perspective, large stocks drove second-quarter gains, as the very largest stocks were responsible for nearly all of the market’s recent rally. The Morningstar US Large Cap Index gained 9.8% while the Morningstar US Small Cap Index rose 5.6%. For 2023, the large-cap index ended the first half up nearly 20%, while the small-cap index gained just half of that. Smaller stocks tend to get hit harder by fears of a U.S. recession than larger stocks, in part because many large-company stocks generate more revenues from non-U.S. economies than small companies do.
Within the Morningstar Style Box, large-growth stocks have been the leaders for the first two quarters of the year, while small- and mid-sized value stocks brought up the caboose.
U.S. Equity Style Box Performance
Stock Sector Performance
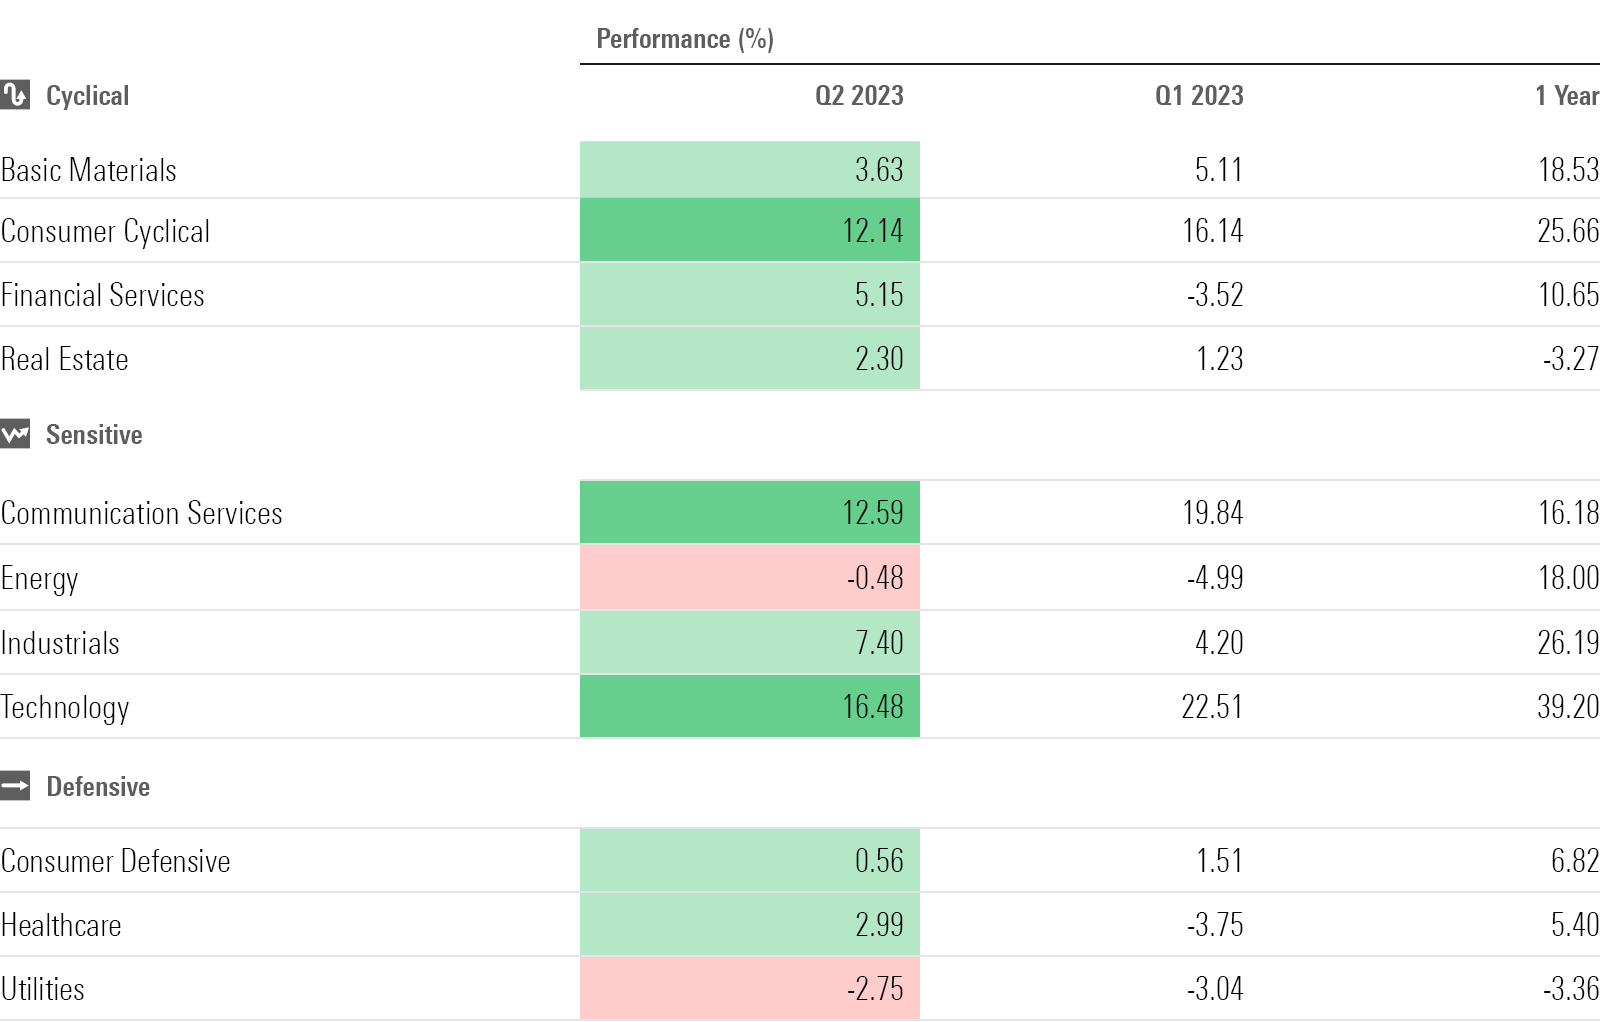
The sectors with the highest concentrations of growth-leaning stocks drove the gains both in the second quarter and in 2023 so far.
Stocks from the technology, communication services, and consumer cyclical sectors—the only ones among the 11 U.S. equity sectors with higher growth tilts than the Morningstar US Market Index—made up the biggest winners. The Morningstar US Technology Index, which carries roughly 70% growth stocks by weight, ended the first half of 2023 with gains of 42.7% for the year, led by Nvidia and Apple. The Morningstar US Communication Services Index—60% growth stocks by weight—came close behind with gains of 34.9%, led by Facebook parent company Meta Platforms META and Google parent company Alphabet GOOGL. The Morningstar Consumer Cyclical Index, with 57.5% growth stocks by weight, ended the first half of the year up 30.2%, driven by Amazon.com.
Utilities and energy stocks suffered in the second quarter. The Morningstar Utilities Index was the bottom performer, with a loss of 5.7% in the first half of 2023. Interest in utilities stocks has waned in 2023 after investors sought safety in the dividend-paying defensive group during the previous year’s bear market. Energy stocks took a hit due to fears of an economic slowdown combined with political instability in Russia, one of the world’s largest oil producers.
Morningstar Sector Indexes
Dividend Stock Performance
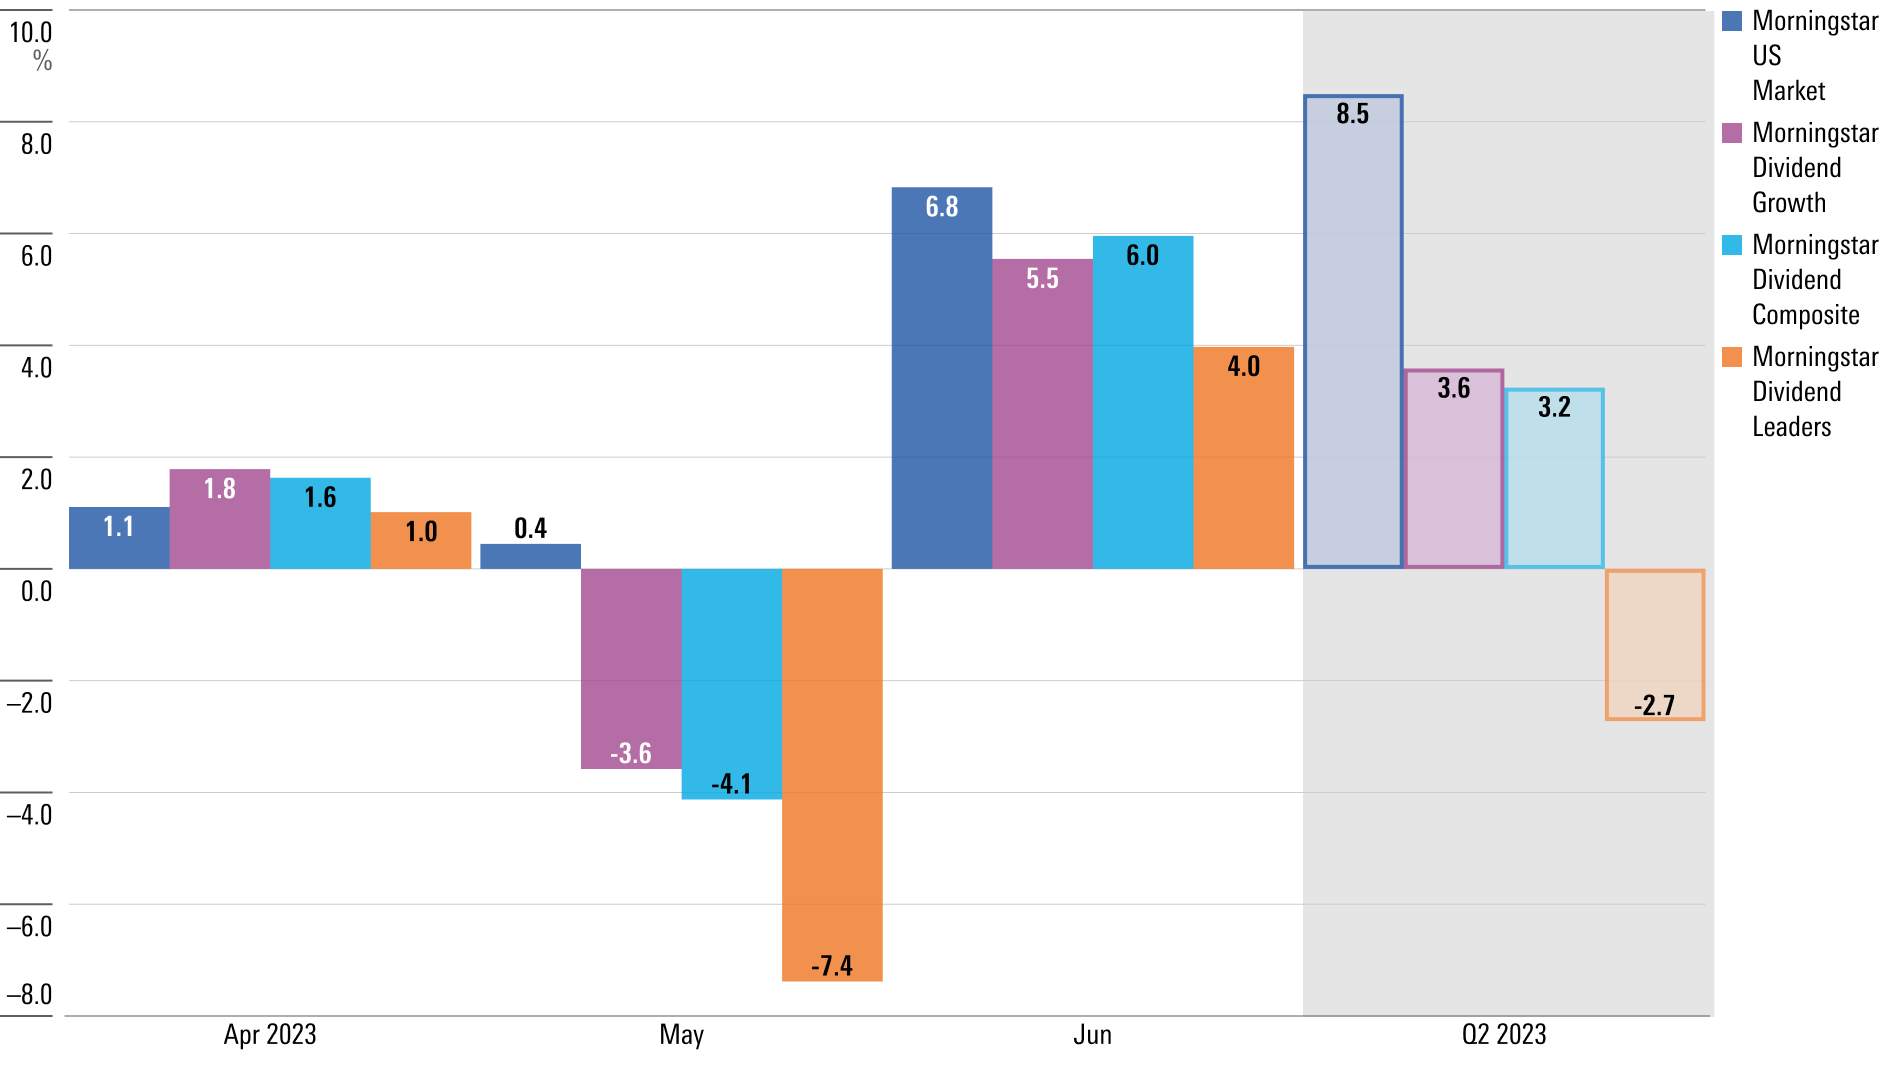
Dividend strategies lagged the broader market as mega-cap, high-growth companies fared better than value.
The Morningstar Dividend Composite Index—a broad measure of dividend stock performance—gained 3.2% during the second quarter, about 5 full percentage points behind the overall stock market. And since January, it’s up just 3.8%, lagging the broader market by nearly 13 percentage points.
The Morningstar Dividend Leaders Index—a collection of the 100 consistently paying, highest-yielding stocks—suffered. It fell 2.7% during the second quarter, bringing its 2023 losses down to 4.6%. By weight, the dividend leaders index is composed of 88.8% value stocks, 0.3% growth stocks, and 10.9% “core” stocks, which display characteristics of both value and growth.
Among dividend-paying stocks, companies that have been growing their dividends over time fared better. The Morningstar Dividend Growth Index—which carries 45.4% core stocks and 13.3% growth by weight—rose 3.6% during the second quarter and ended the first half of the year up 4.2%. The index was lifted by semiconductor company Broadcom AVGO (up 35.9% for the quarter) and Microsoft. The main detractors were biopharmaceutical company AbbVie ABBV (down 14.5%) and energy heavyweight Exxon Mobil XOM (down 1.4%).
Morningstar Dividend Indexes vs. U.S. Market
Fed Pauses (or ‘Skips’) Rate Hikes
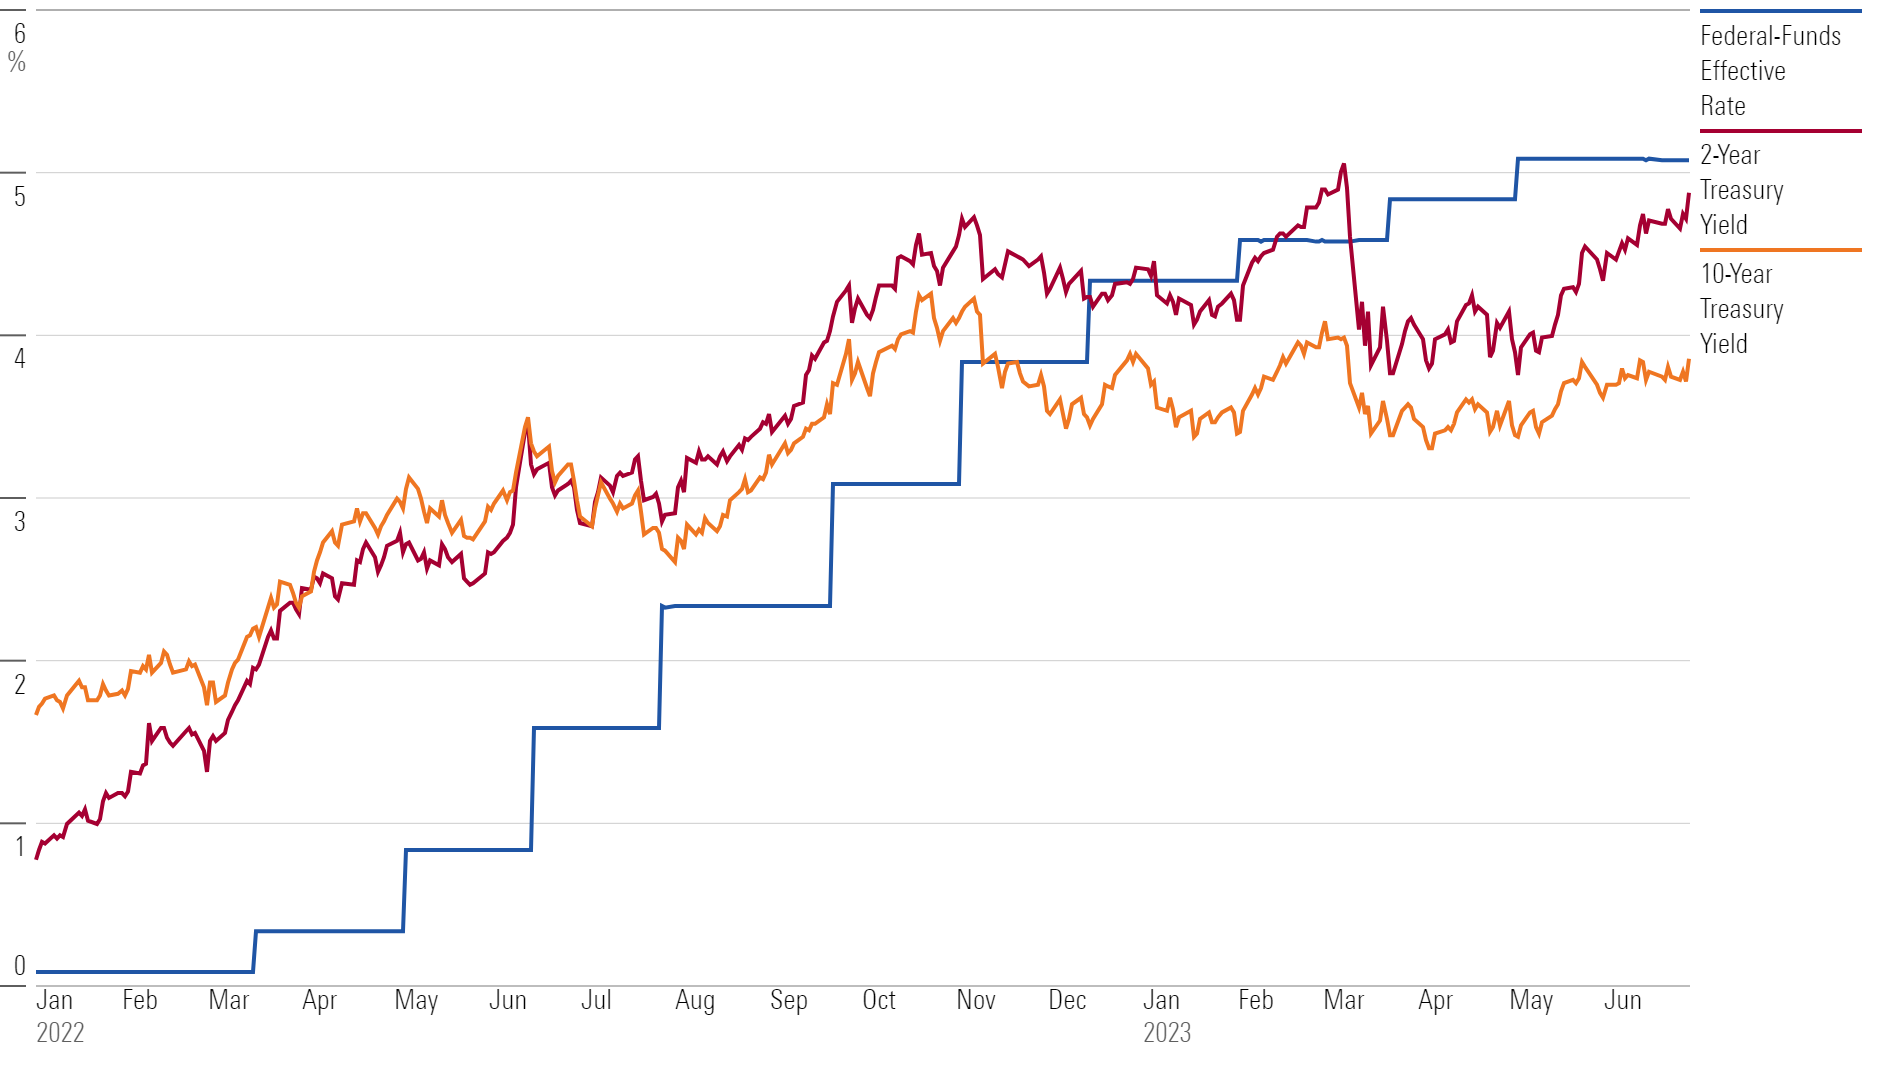
In its continued effort to reign in decades-high inflation without engineering a recession, the Federal Reserve raised its benchmark effective federal-funds rate an additional 25 percentage points in May, then held rates steady for the first time since January 2022 at its June meeting. Over the course of the first half of 2023, the Fed has slowed its pace of rate hikes from 2022, when it raised rates from zero at its fastest pace in history.
The Fed’s interest-rate target range remained at 5.00%-5.25% at the end of the second quarter, up 0.25 percentage points from the March range of 4.75%-5.00% and 0.75 percentage points above the January target of 4.25%-4.50%.
Morningstar’s chief U.S. economist Preston Caldwell expects the Fed to raise rates one more time this cycle and then shift to lowering them by the end of 2023. Caldwell sees this shift against the backdrop of an economy at risk of recession (one that will be short-lived if it does occur).
Treasury Yield and Federal-Funds Rate
Q2 2023 Bond Market Performance
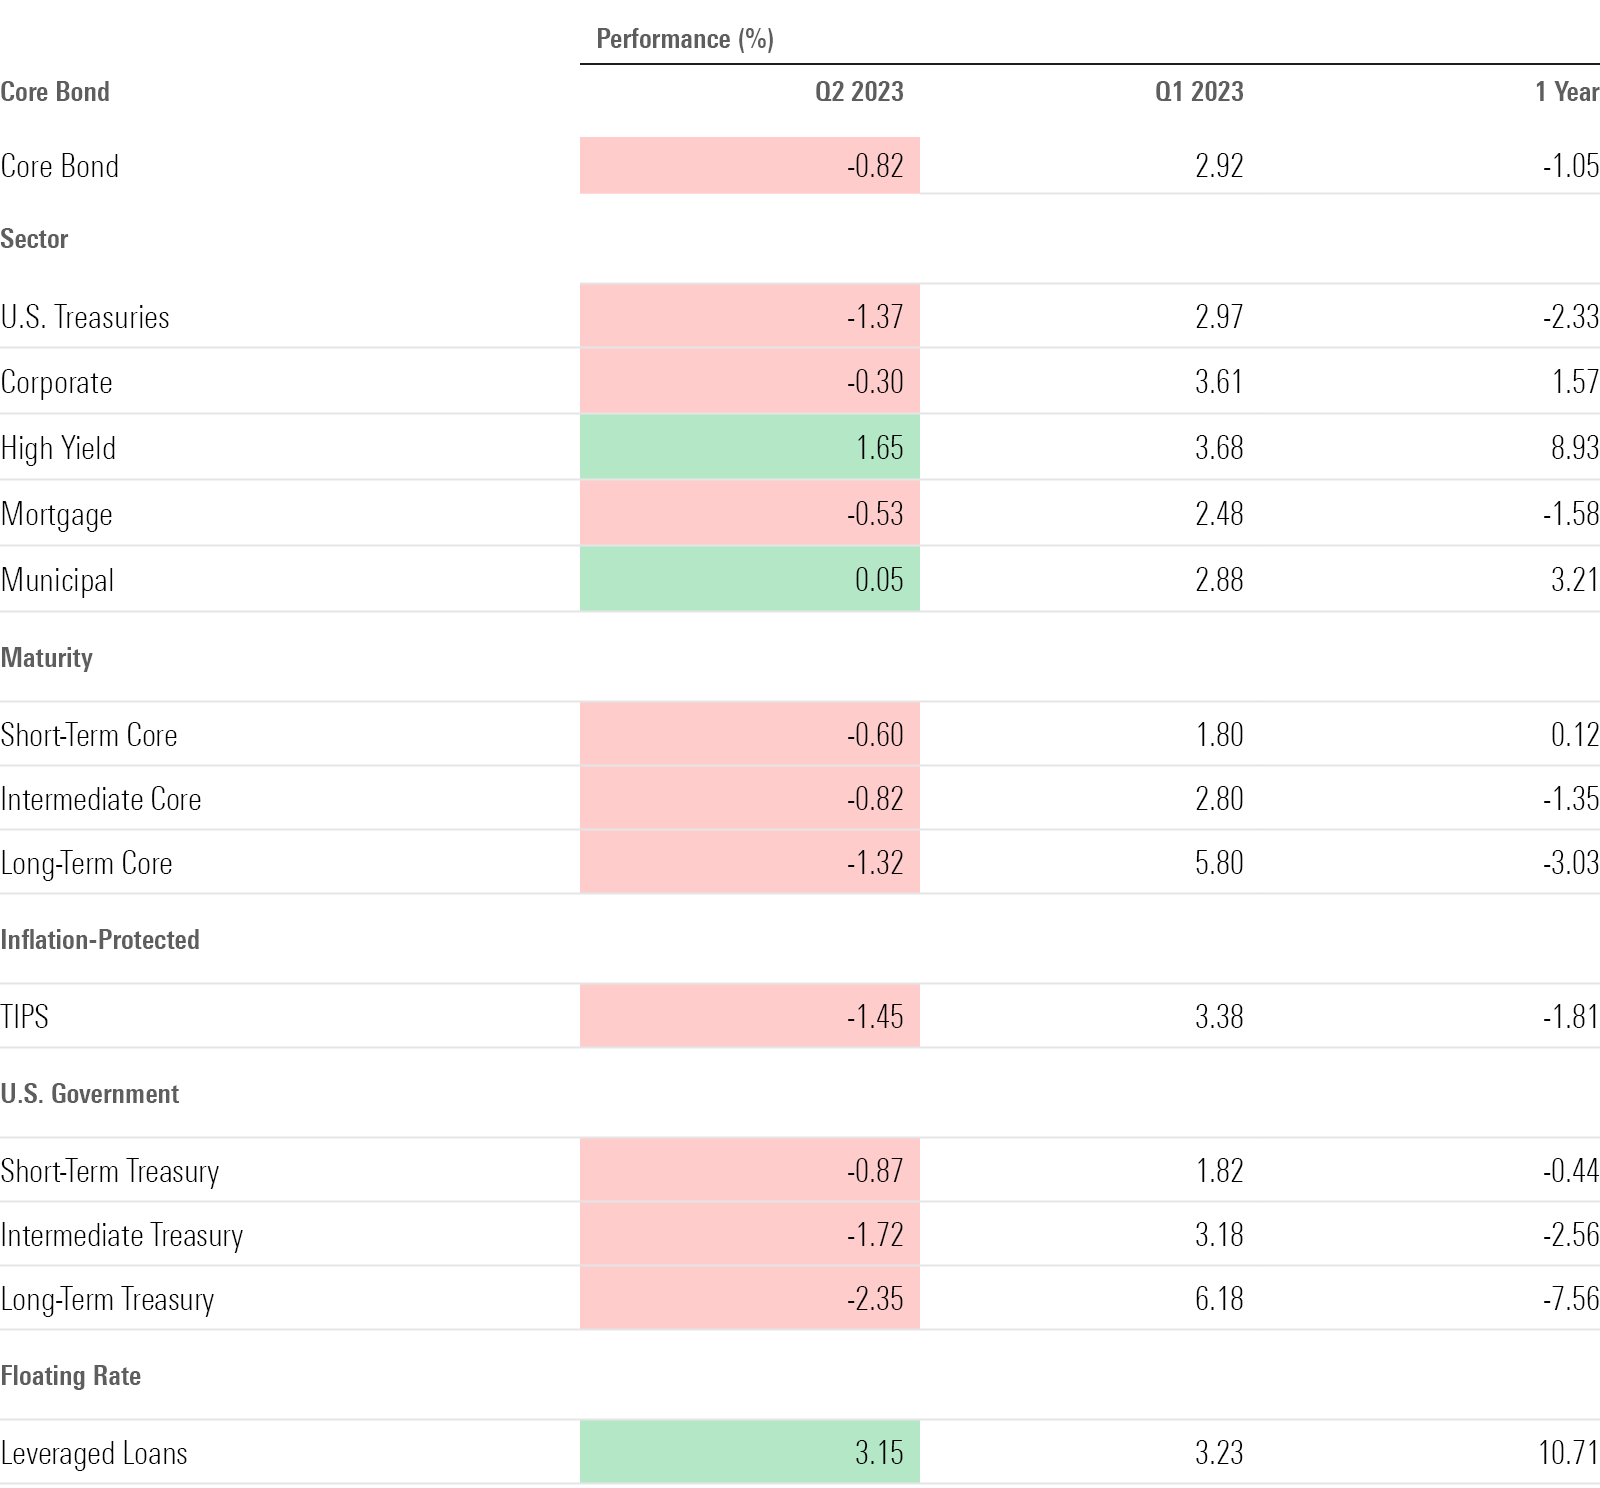
The second quarter was a mixed picture for the bond market.
As yields went up, particularly among short-term maturities, interest-rate-sensitive Treasury bonds suffered. Long-term bonds—those due in 10 years or more, whose longer durations make them highly sensitive to interest rates—were hit hardest. The Morningstar Long-Term Treasury Bond Index fell 2.4% and the Morningstar Long-Term Core Bond Index lost 1.3% during the second quarter.
Treasury Inflation-Protected Securities, or TIPS, which are designed to protect investors in times of high inflation, also fell. The Morningstar US Treasury Inflation-Protected Securities Index ended the quarter down 1%. TIPS’ poor showing is a continuation of their performance in 2022, when investors in these funds saw a 17% loss of purchasing power.
On the flip side, high-yield bonds—which tend to be riskier and of lower quality than other kinds of fixed-income investments—made modest gains during the second quarter. High-yield bonds are less sensitive to interest rates; their performance is instead more closely tied to the stock market.
Out of all the key Morningstar Fixed Income indexes, floating rate bonds performed best. The Morningstar LSTA US Leveraged Loan Index ended the quarter up 3.1% after rising 2.3% in June alone. Leveraged loans have been performing well over the past several months and have gained 10.7% over the trailing 12-month period ending June 30. Their success is likely a function of a few factors, says Morningstar’s director of fixed income and multi-asset indexes, Katie Binns. Such factors include “low supply of new issuance, rising yields, and some more positive investor sentiment as of late.”
Morningstar Bond Indexes
Treasury Yield-Curve Inversion Continues
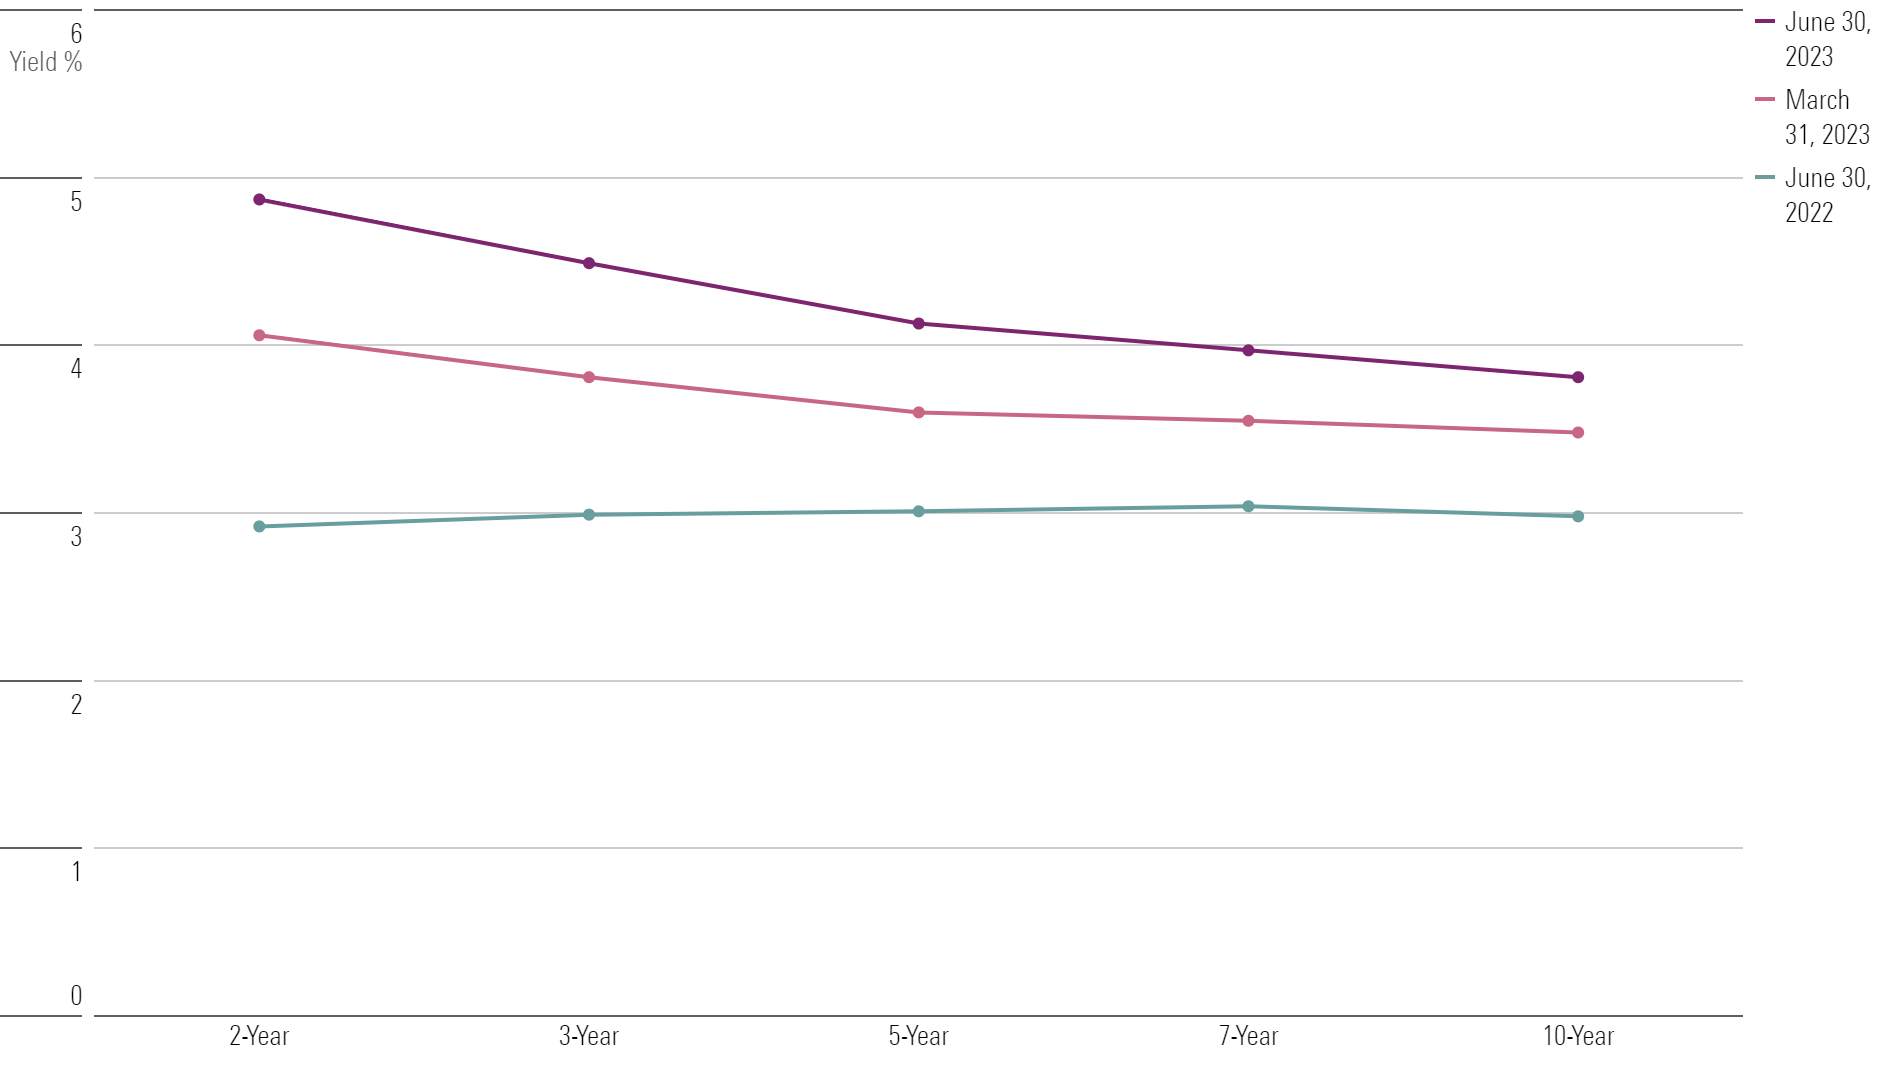
While yields of all maturities have risen slightly this quarter as the economy remained strong and the Fed paused its rate hikes, the yield curve has remained steeply inverted.
Short-term yields ended the second quarter of 2023 well above long-term yields for the fifth quarter in a row. When short-term Treasury yields exceed long-term yields, it’s known as an inverted yield curve. It’s a sign of investor pessimism about the economy and is widely seen as a precursor to a recession. (Not all yield curve inversions lead to recessions, but historically all recessions have been preceded by an inversion of the yield curve.) Many analysts say that the longer the yield curve remains inverted, the more likely a recession becomes.
The gap between the yield on the U.S. Treasury two-year note and the U.S. Treasury 10-year note reached a high of 1.06 percentage points on the last day of the quarter, matching the gap at the start of the regional banking crisis in early March. Before then, inversions this steep hadn’t been seen since 1981.
Treasury Yield-Curve Inversion
Stock and Bond Market Volatility
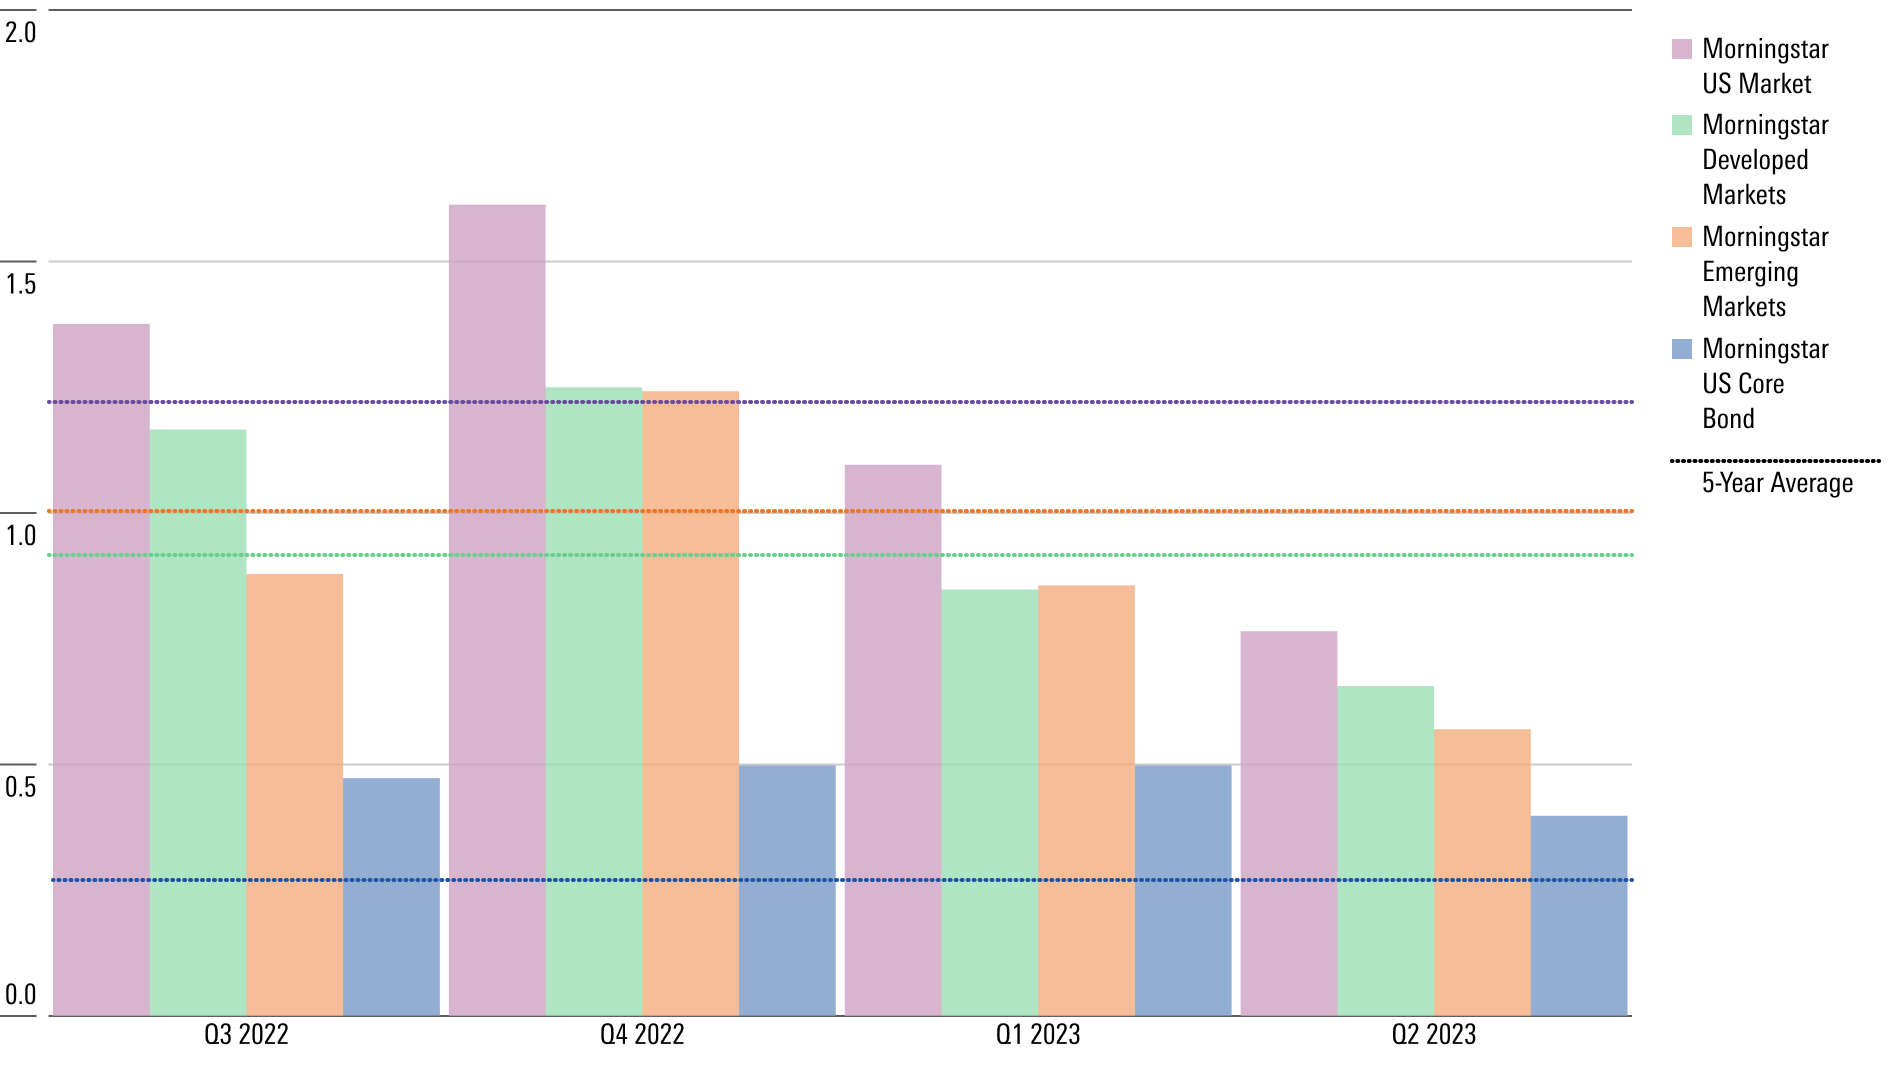
Stock-price volatility fell below long-term trend levels as banking fears dissipated over the second quarter, but the bond market has stayed bumpy as expectations for Fed policy continue to swing back and forth.
Volatility in the bond market has remained at nearly twice its historical level over the past five quarters—notable for a market that most investors look to for stability.
Historical Standard Deviation
Top and Bottom Market Performers of Q2 2023
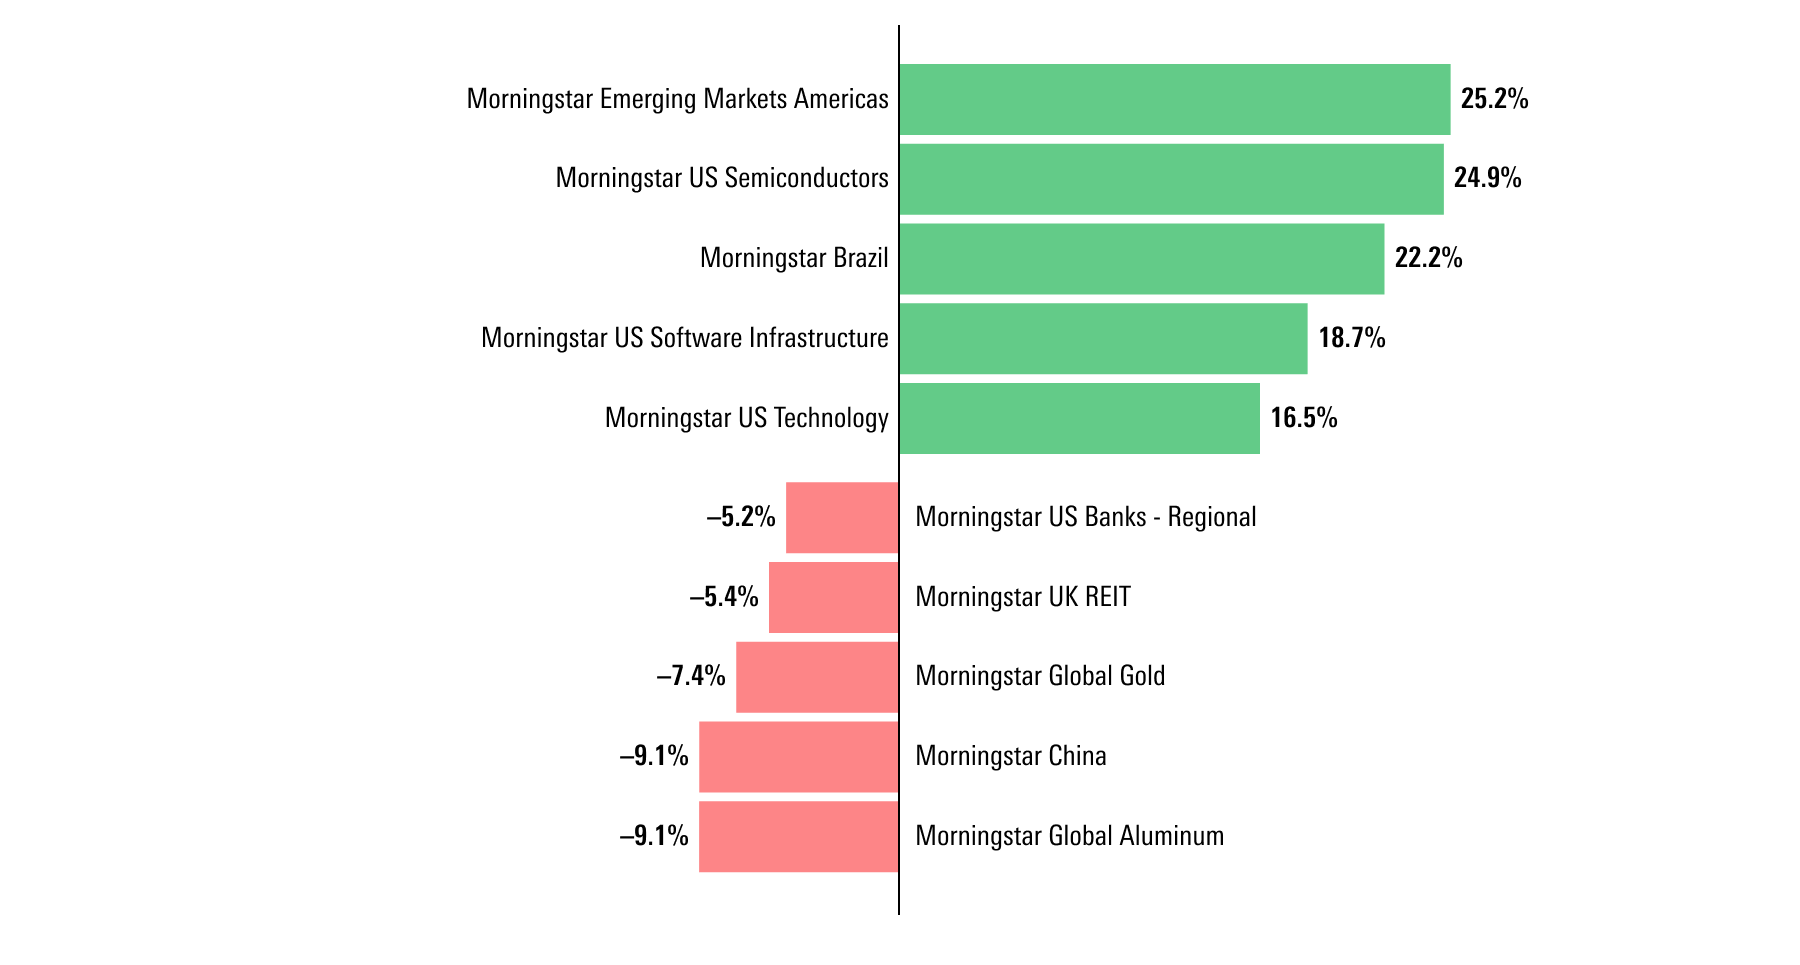
High-growth, high-tech stocks topped the list of winners for the second quarter. The Morningstar US Software Infrastructure Index (a collection of companies including Microsoft and Adobe ADBE, which make and sell operating systems, cloud storage, and related services) and the Morningstar US Big Data and Analytics Index (which includes Facebook parent company Meta Platforms and big-data company Palantir PLTR) both made double-digit gains. The Morningstar US Semiconductors Index also rallied thanks to Nvidia’s stock, which has risen more than 180% over the course of 2023.
Emerging-market stocks also turned out to be some of the best performers during the second quarter, supported by multiple tailwinds that include a weakening U.S. dollar and maturing economic conditions in several emerging markets. The Morningstar Emerging Markets Americas Index gained 25.2% and the Morningstar Brazil Index rose 22.2% during the second quarter.
The Morningstar China Index was among the biggest losers for the second quarter, down roughly 9% as fears escalated around a regulatory war over microchips between the United States and China.
Even while the results from the Fed’s June stress tests showed the banking system looking healthy, regional banks still took losses, down 5.2% for the second quarter and 27.5% for the first half of the year.
As the real estate market in the United Kingdom got crushed by interest rates, the Morningstar UK REITS Index ended the quarter with a loss of 5.4%.
Q2 2023 Highlighted Top and Bottom Performers
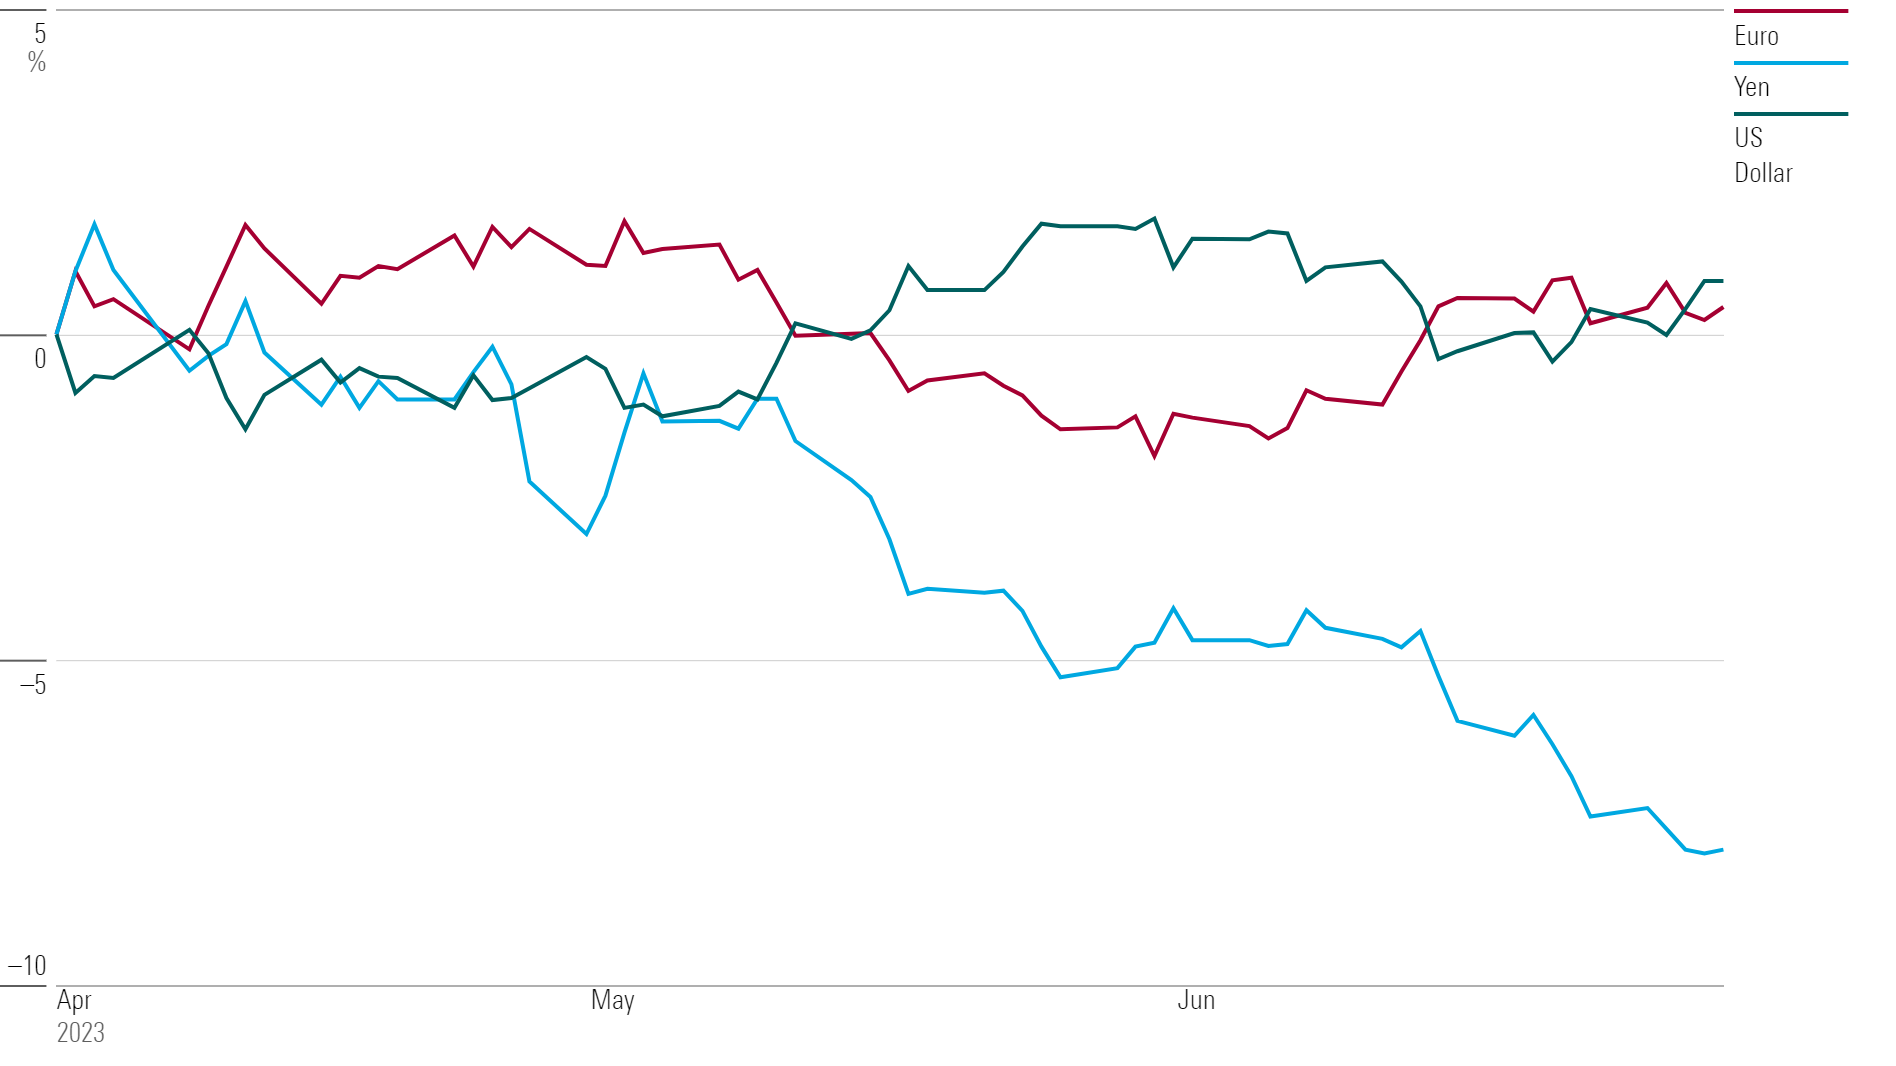
Currency Market Performance
The dollar was softer at the start of the quarter amid expectations the Fed was getting closer to lowering rates. But U.S. currency bounced as expectations shifted toward the Fed keeping rates higher for longer.
The euro regained strength as it became clear that the European Central Bank was going to aggressively raise rates. The yen weakened as rates rose in the U.S. and Europe.
Currency Performance
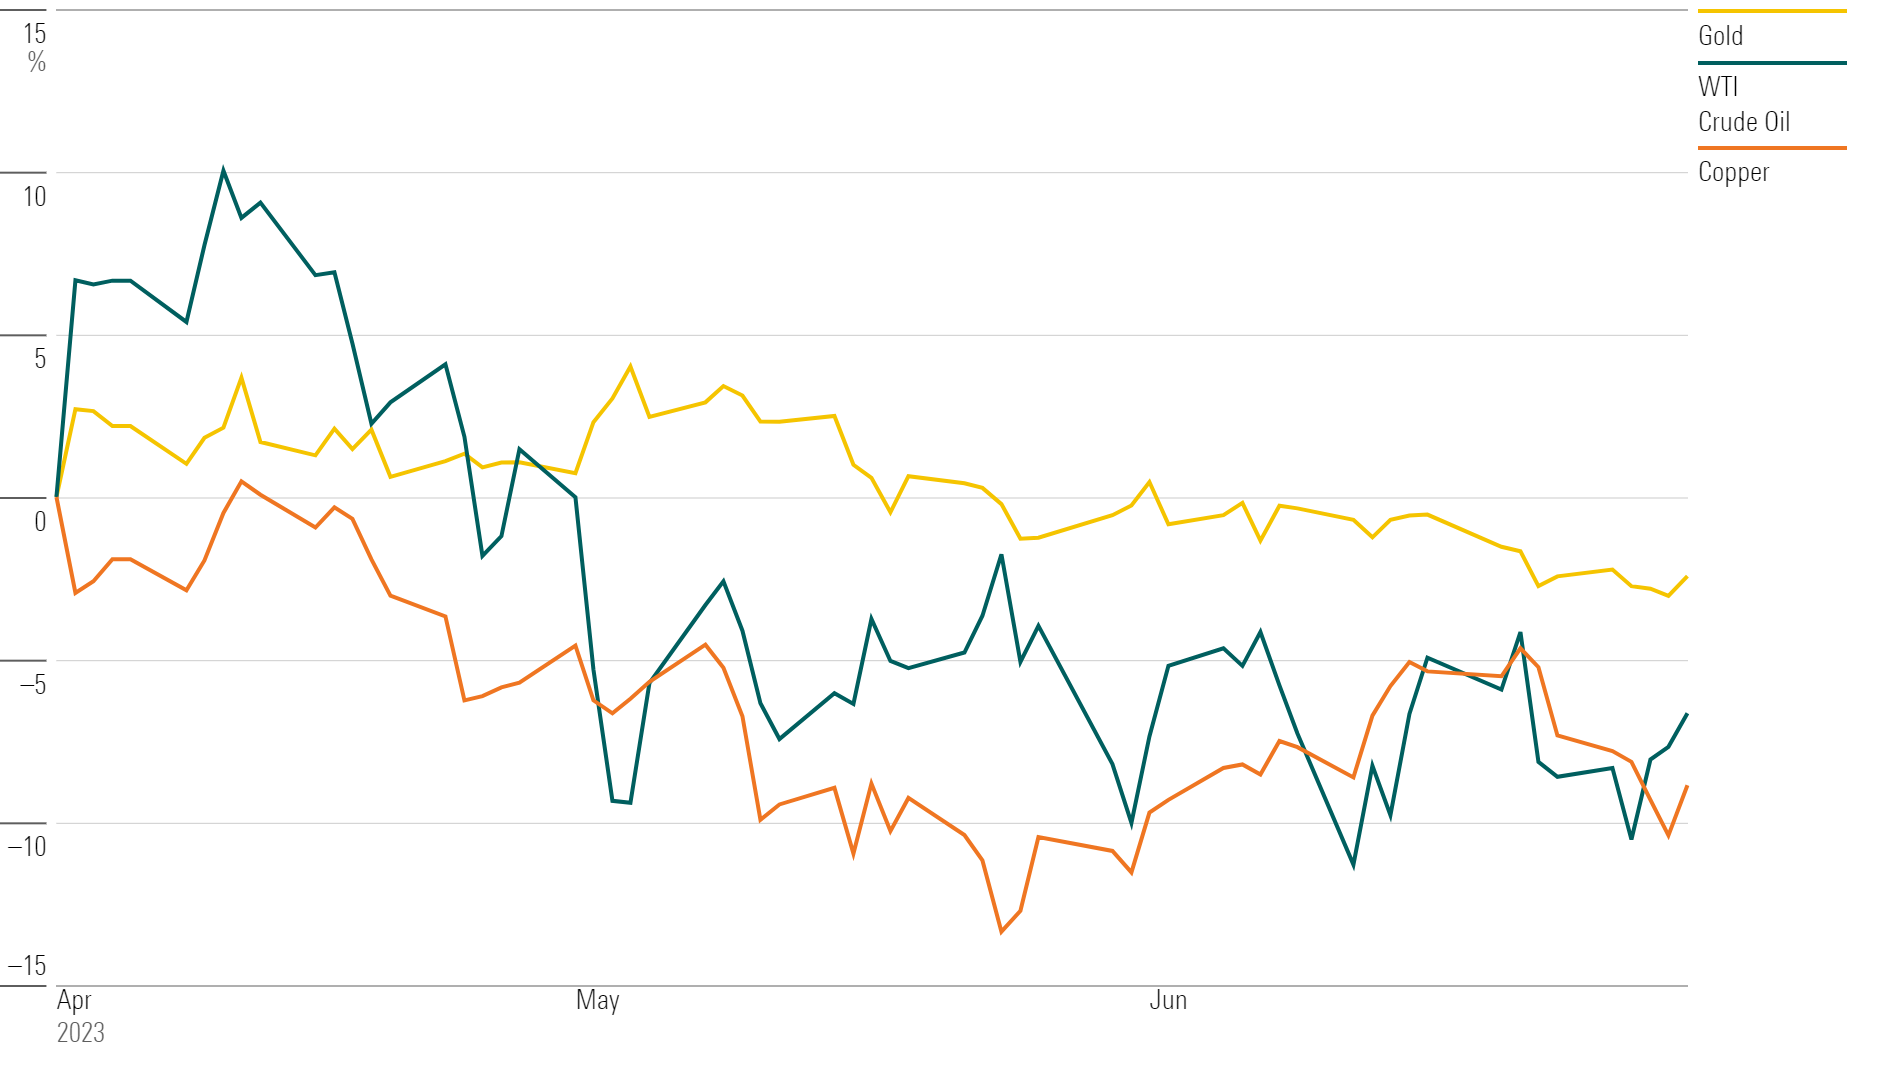
Commodity Market Performance
Many commodities fell or ended near where they started for the second quarter of 2023.
Gold prices ended the quarter down as inflation stayed high and central banks continued tightening.
Copper—seen as a bellwether for the global economy, as it is used as an input in equipment and production for a wide range of industries—spent nearly the entire second quarter in negative territory after rising nearly 9% during the first quarter.
Oil futures prices rose then sank on continued uncertainty around the strength of the U.S. economy. Over the course of the quarter, WTI crude oil prices peaked at $83.26 per barrel on April 12 (their highest since November 2022), then ended the quarter at $70.64.
Commodity Futures Performance
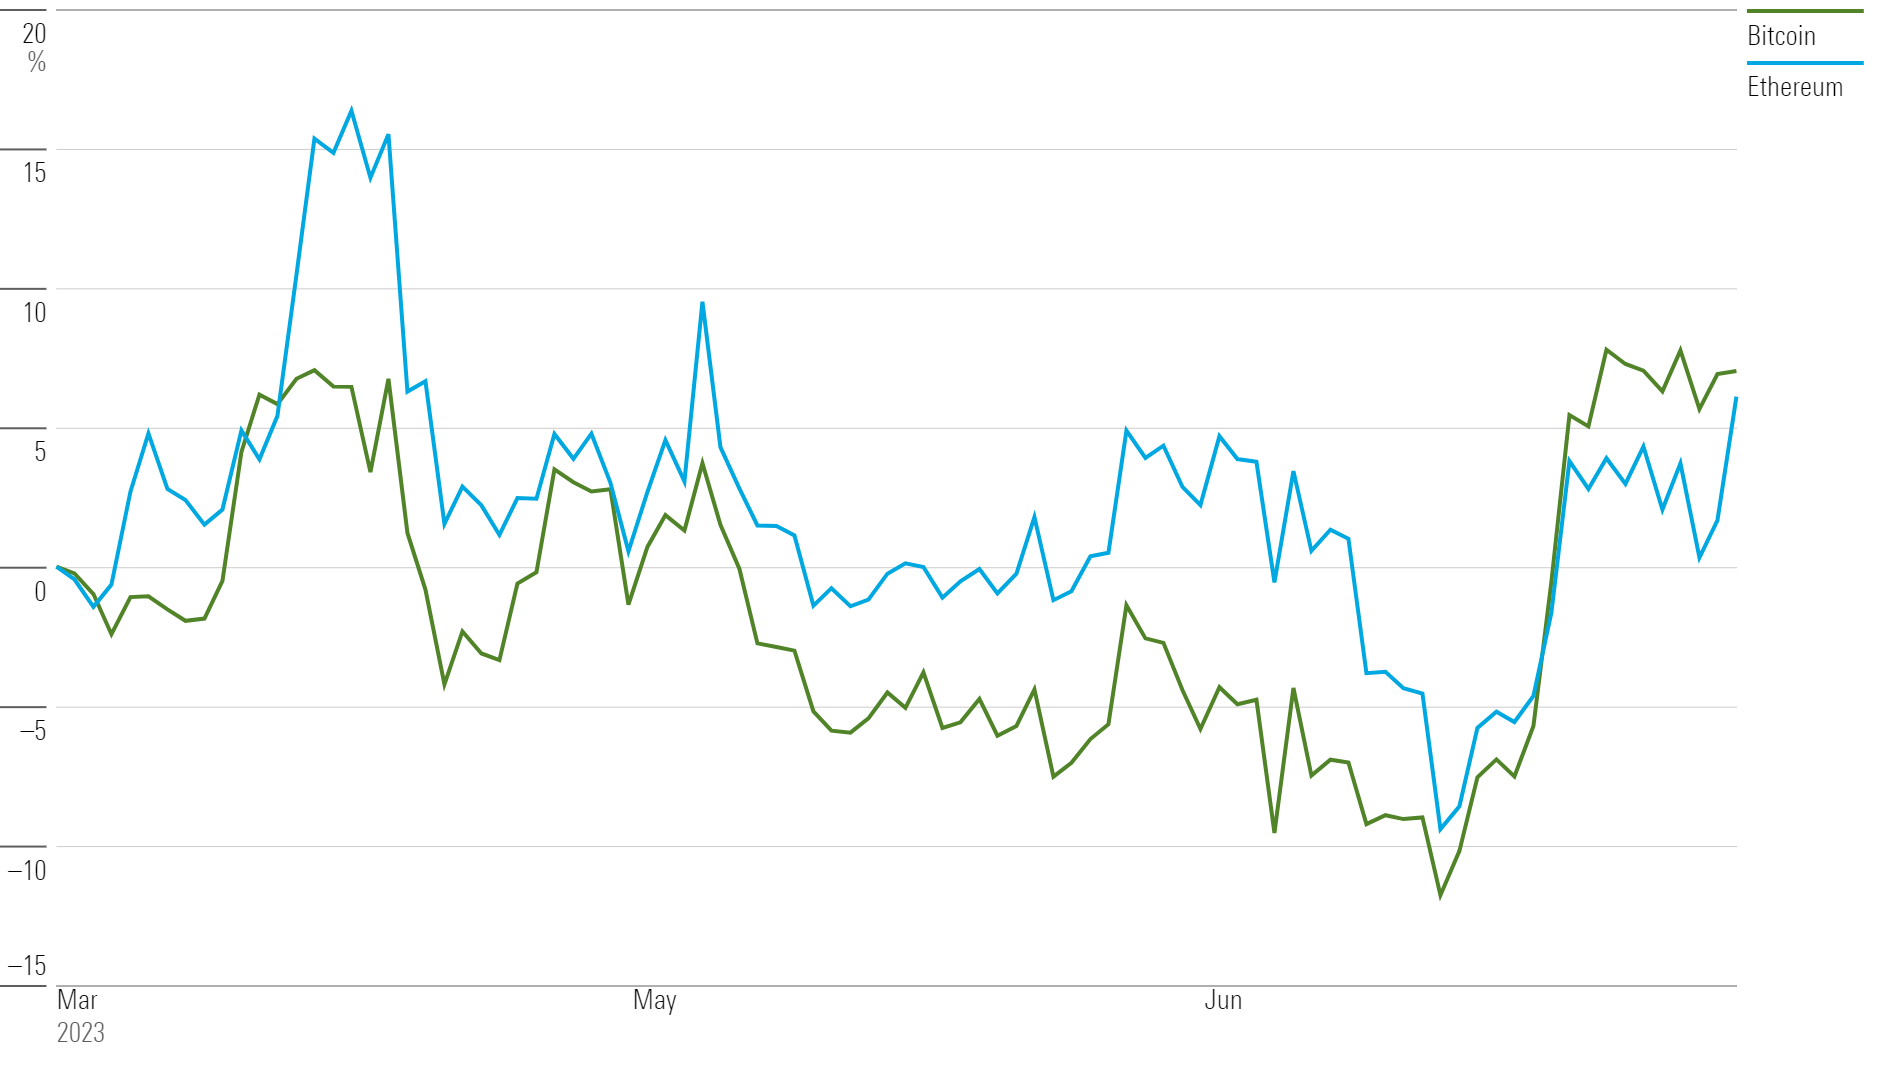
Cryptocurrency Performance
After rising substantially during the first months of 2023, major cryptocurrencies ended the second quarter with modest gains.
The two largest cryptocurrencies by market cap, bitcoin BTC-USD and Ethereum ETH-USD, each rose roughly 7%. Bitcoin ended the quarter above the $31,000 mark, making for its highest level in over 12 months. Cryptocurrency prices advanced as asset management giant BlackRock filed to launch a spot bitcoin exchange-traded fund.
The crypto industry is not without its troubles, though. The Securities and Exchange Commission sued cryptocurrency exchanges Coinbase (listed as the bitcoin custodian for BlackRock’s planned ETF) and Binance in June, on the basis that they are running unregistered securities exchanges. EDX Markets, a new crypto exchange backed by major Wall Street firms that include Charles Schwab and Fidelity, has since launched. EDX is structured as a custodian-only platform, meaning it will not serve as a broker or custodian, unlike the failed crypto exchange FTX.
The latest Morningstar research has shown that the most commonly used methods for valuing bitcoin are not particularly useful. According to Morningstar senior research analyst Madeline Hume, the inputs for bitcoin’s valuation models are blunt instruments in need of refinement, many of those models rely on constants when they shouldn’t, and all the common models depend at least in part on a relationship that increases with time, incorrectly implying growth.
Cryptocurrency Performance
The author or authors own shares in one or more securities mentioned in this article. Find out about Morningstar’s editorial policies.
/cloudfront-us-east-1.images.arcpublishing.com/morningstar/G3DCA6SF2FAR5PKHPEXOIB6CWQ.jpg)
/cloudfront-us-east-1.images.arcpublishing.com/morningstar/JYGMFDSZ6ZCJJKNOD2CMBUGOOM.jpg)
/d10o6nnig0wrdw.cloudfront.net/05-13-2024/t_4b82c3dc40354f6f812c5eab796cbf3e_name_file_960x540_1600_v4_.jpg)
:quality(80)/s3.amazonaws.com/arc-authors/morningstar/ba63f047-a5cf-49a2-aa38-61ba5ba0cc9e.jpg)