
Where Stocks Look Cheap or Expensive
While the overall market is near fair value, there are pockets of opportunity.

/s3.amazonaws.com/arc-authors/morningstar/ba63f047-a5cf-49a2-aa38-61ba5ba0cc9e.jpg)

Stocks started 2023 near their cheapest levels in a decade, but thanks to the market’s rally, investors looking to put money to work in 2024 will find many of those bargains have vanished.
As the Morningstar US Market Index closes on a new high, overall, the more than 700 U.S. stocks covered by Morningstar analysts are approaching their fair values.
This reset comes at an inflection point for financial markets as investors look ahead to 2024. As was the case in 2023, the focus will be on Federal Reserve policy. But unlike how things were at the start of this year, it’s looking like the Fed’s next move will be to cut rates, with the economy expected to cool.
While the overall market is near fair value, there are pockets of opportunity. As 2023 draws to a close, here’s what investors need to know about how the stock market is valued.
- The overall market is near fair value.
- Small-cap value stocks are still undervalued, while large-cap growth stocks are fully valued.
- Value stocks are undervalued, while growth stocks are fairly valued.
- Tech stocks and industrials are trading at a premium, while communication services and energy stocks are cheaper.
Is the Market Cheap or Expensive?
Morningstar analysts measure valuations by comparing a stock’s current price to our estimate of its fair value—the price/fair value ratio. Ratios higher than 1.0 indicate stocks are overvalued, or expensive. Ratios under 1.0 indicate stocks that are undervalued, or cheap. The further away from 1.0 the ratio is, the more over- or undervalued the stock.
At the end of December 2022, stocks covered by Morningstar analysts were trading at an average P/FV ratio of 0.84 on a cap-weighted basis. That implies an average discount of 16%. As of Dec. 13, 2023, that ratio had climbed to 0.99 and stocks’ average discount had shrunk to just 1%.
To put it simply: Stocks aren’t nearly as cheap as they were a year ago, but they’re not yet considered expensive.
Morningstar Stock Market Valuations YTD
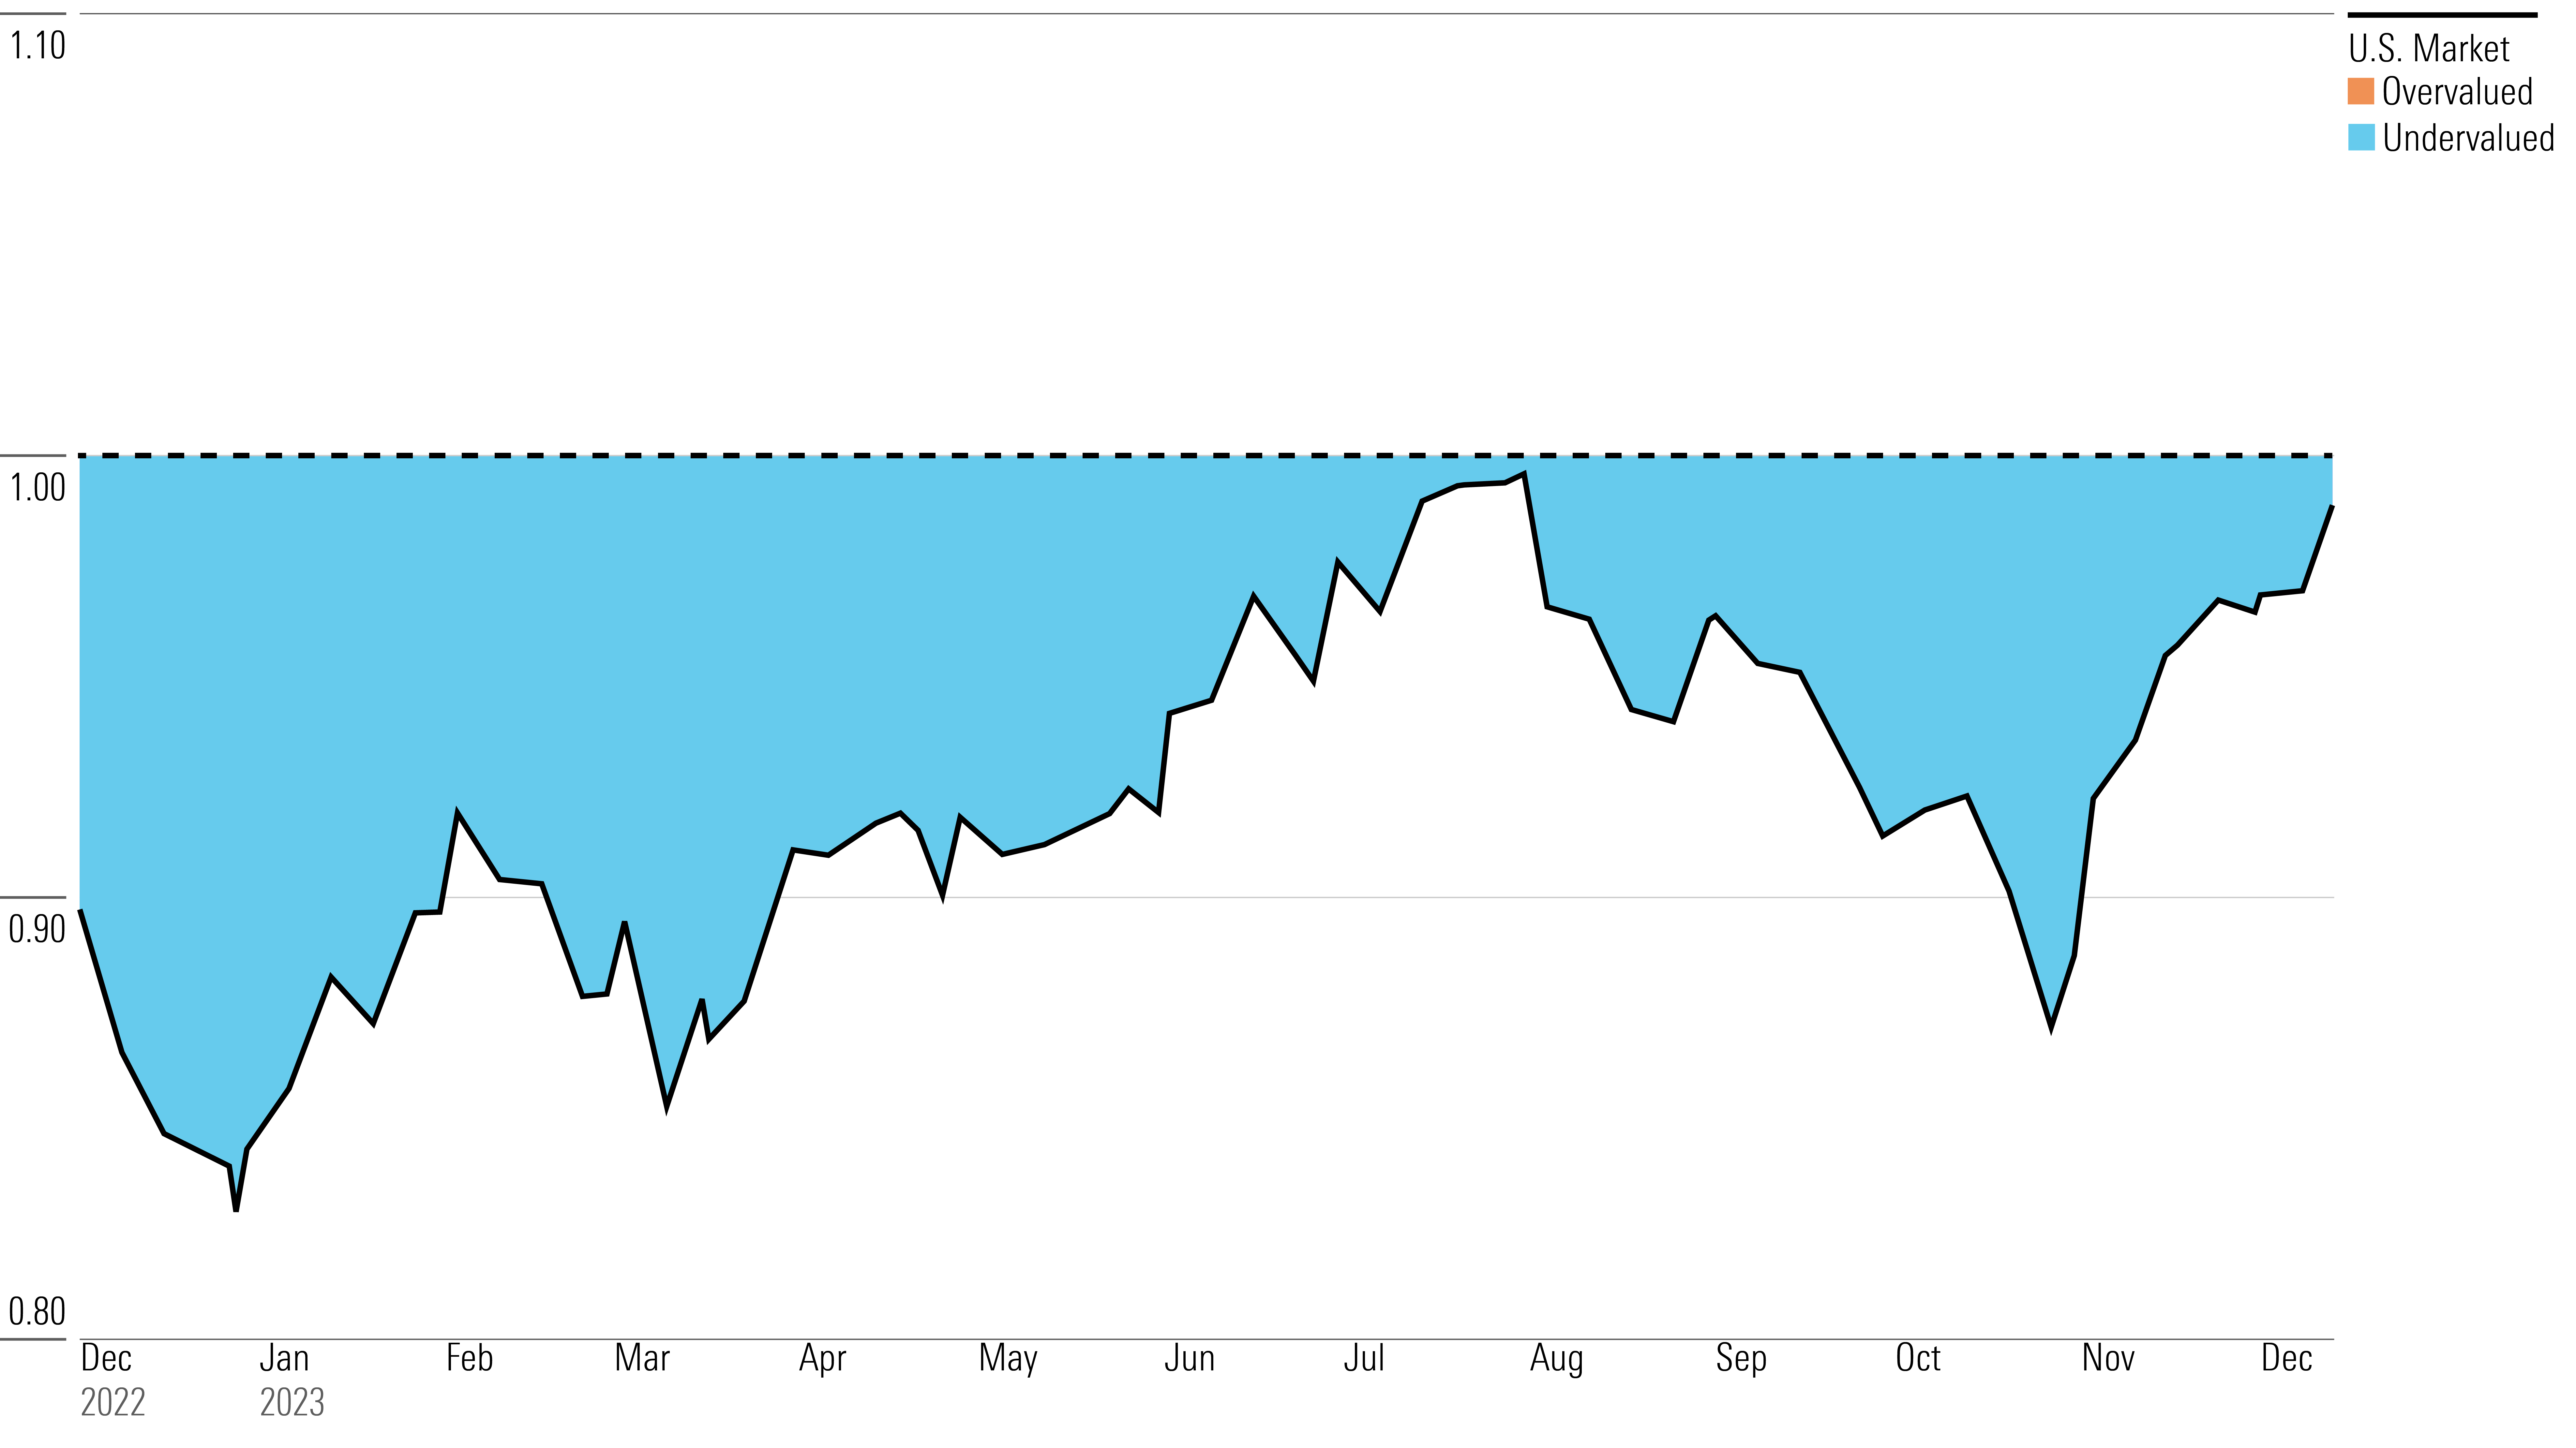
While the stocks didn’t cross into overvalued territory this year, valuations swung widely as the market absorbed evolving outlooks for the economy and interest rates. Amid a major rally in July and August, stocks approached fair value before sinking back to undervalued as high interest rates took a bite out of them. Now, valuations are climbing again amid an “everything rally,” which has sent stocks and bonds soaring based on hopes for rate cuts in 2024.
Morningstar Stock Market Valuations Since 2011
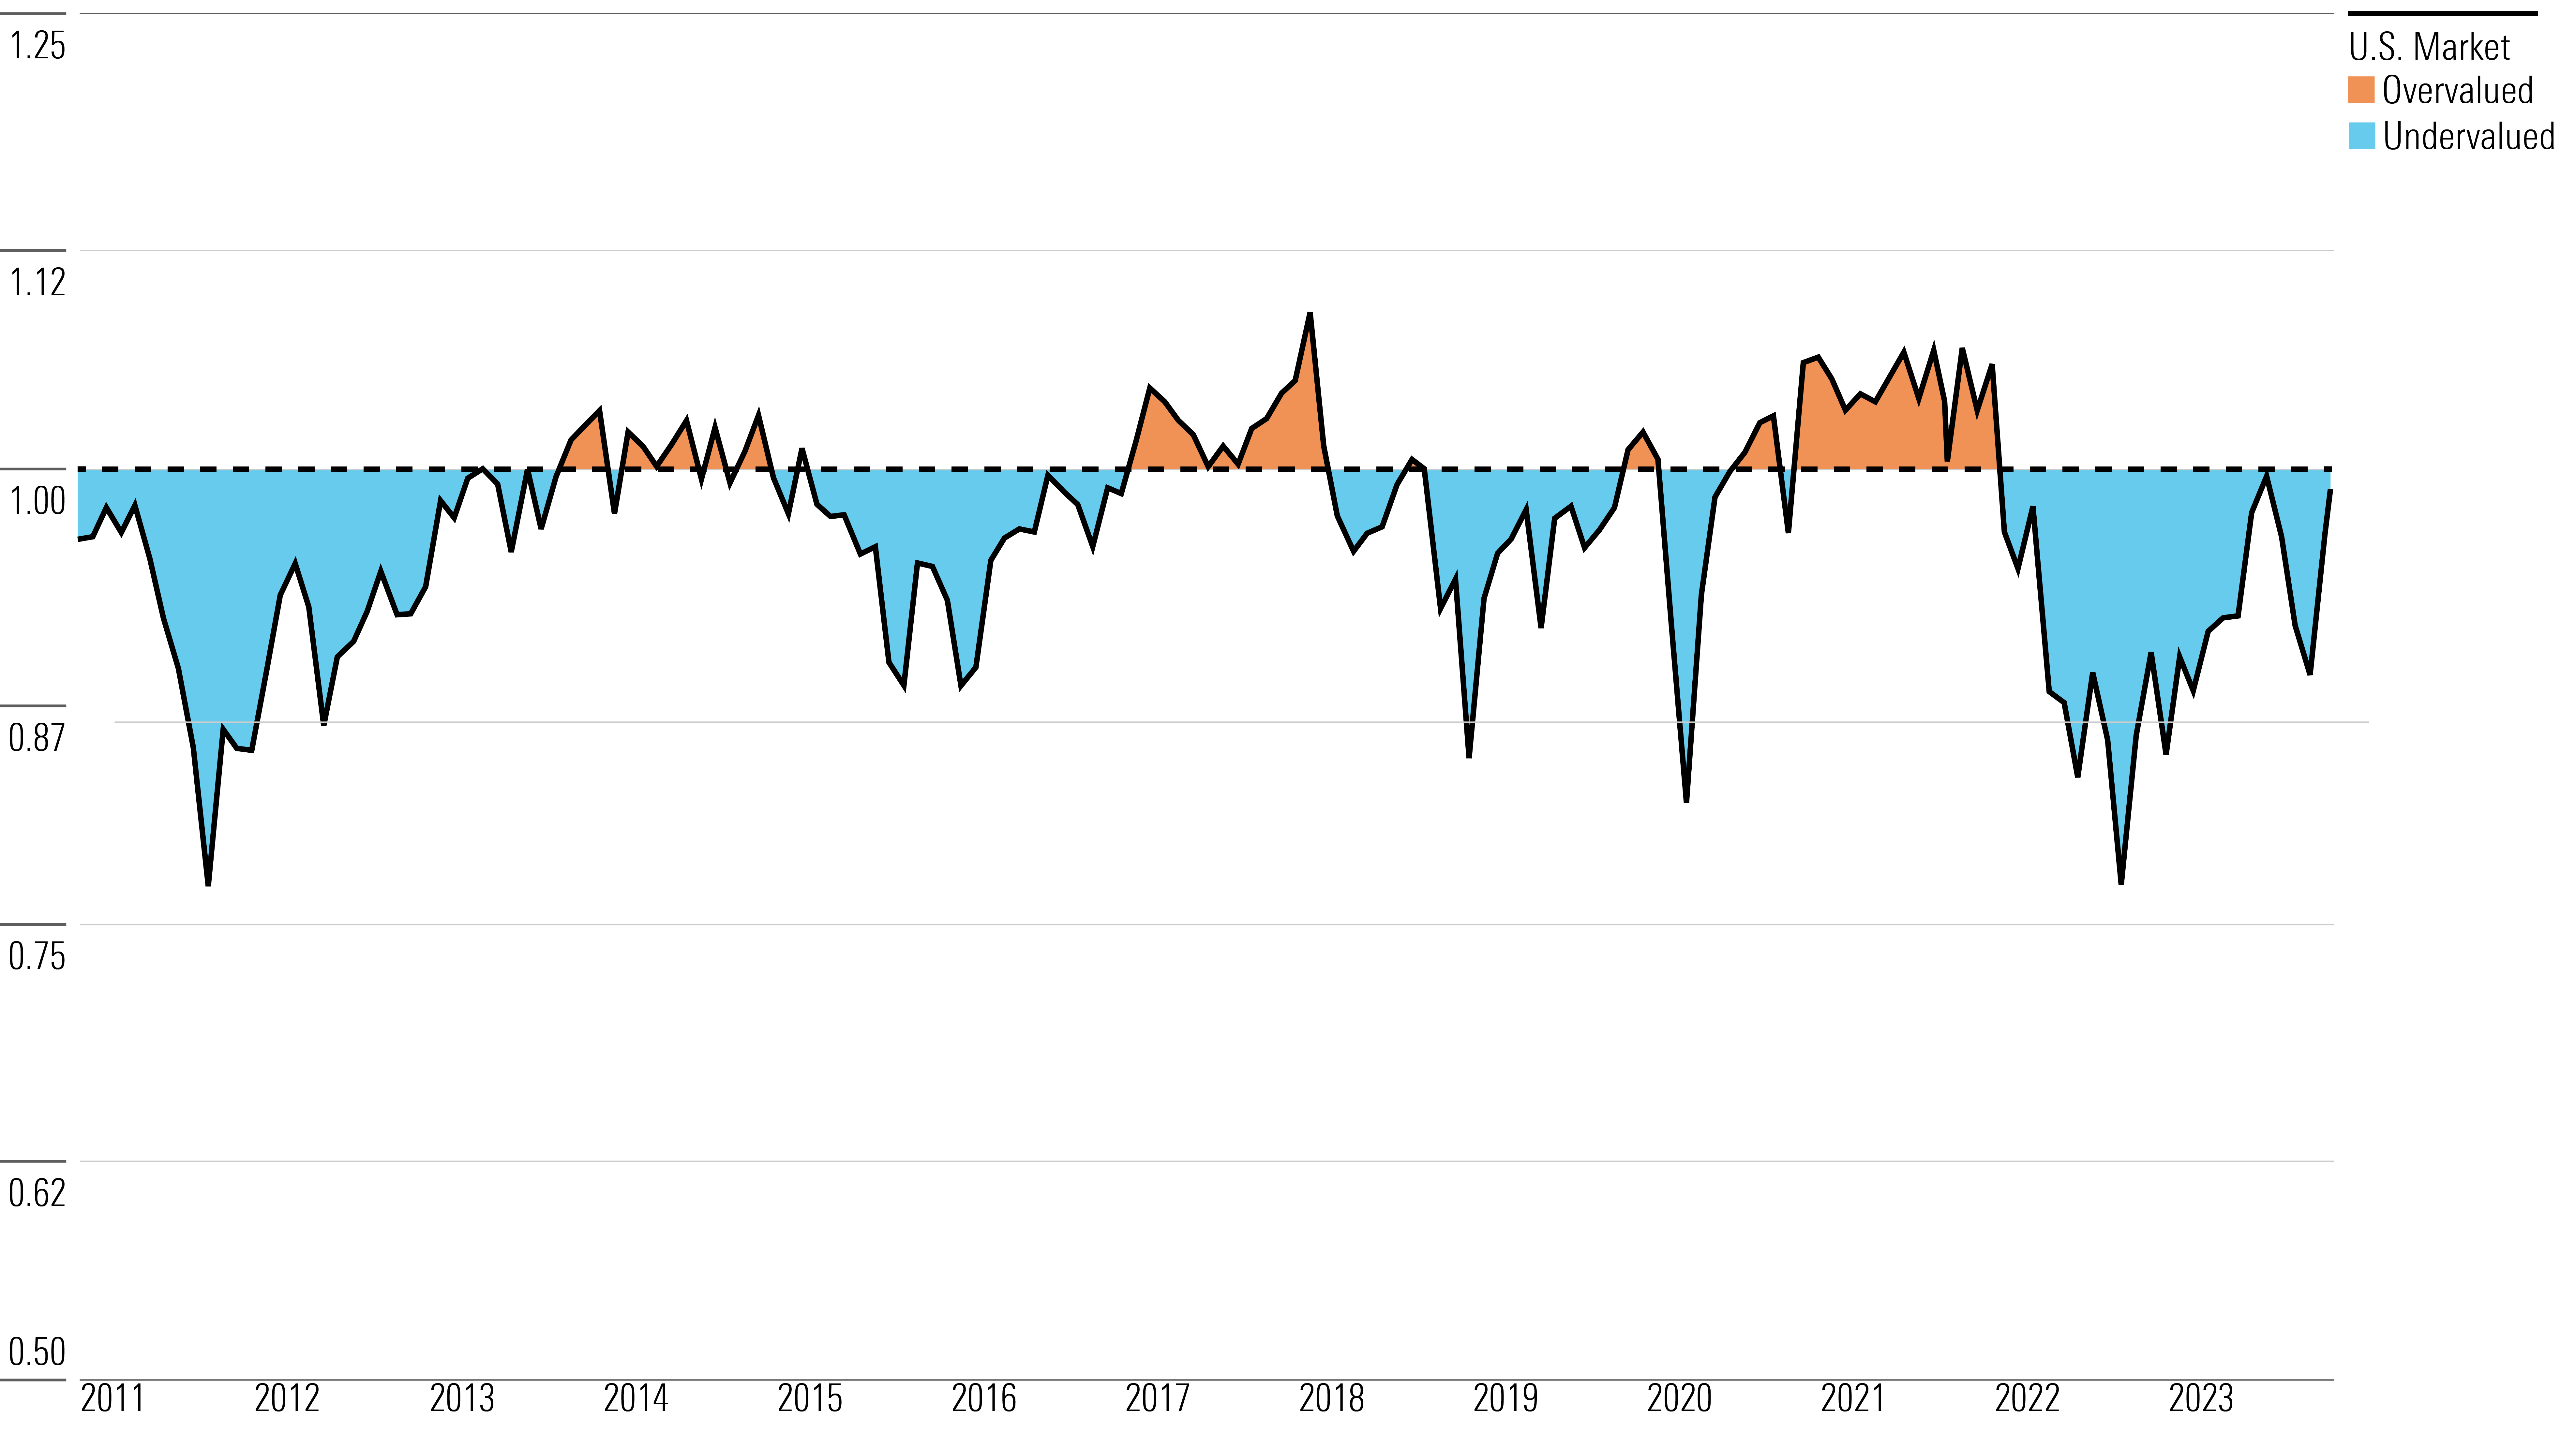
These fluctuations aren’t out of line with recent history. Stocks covered by Morningstar traded at discounts comparable to early 2023 during the pandemic crash of 2020, the 2011 eurozone crisis, and the global financial crisis of 2008.
Stocks climbed above fair value in 2021, when they struggled to break out of a bear market, and in 2016-18, during a long-running bull market.
Small Caps Still Look Cheap
One area of the market that hasn’t changed much over the past year is small-cap stocks—especially small-cap value stocks, which are trading at a discount of about 33%.
Small-cap stocks in every style category were trading at an average P/FV ratio of 0.81 as of Dec. 13—a 19% discount. That’s smaller than the 32% discount the category averaged a year ago, but still significant compared to other areas of the market.
Small-cap stocks tend to be more sensitive to interest rates than their larger counterparts, and investors like them because they offer lots of growth potential. Morningstar chief U.S. market strategist Dave Sekera says small-cap stocks are well-positioned for 2024, should the market rally continue to broaden. Small caps always come with risks, however, including the fact they tend to fare worse than larger firms in the early days of an economic downturn.
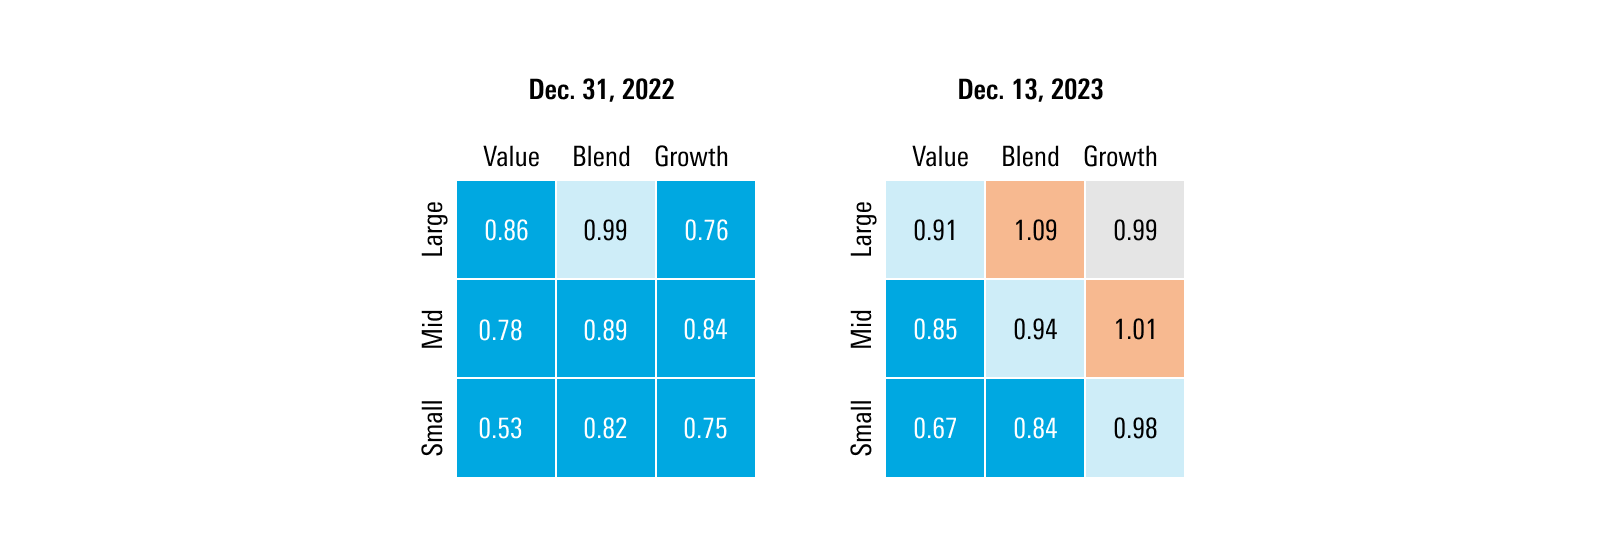
U.S. Equity Style Box Price/Fair Value Ratios
Large-Cap Growth Stocks Are Fully Valued
On the other hand, one of the biggest transitions in valuations this year has happened in large-cap growth stocks. The category was trading at a 24% discount at the end of 2022—one of the cheapest areas of the market. As of Dec. 13, large-cap growth stocks were trading just below fair value, with an average discount of 1%.
This category encompasses the Magnificent Seven, a group of mega-cap technology stocks that includes Nvidia NVDA, Tesla TSLA, Meta Platforms META, Apple AAPL, Amazon.com AMZN, Microsoft MSFT, and Alphabet GOOGL. Of these seven stocks, which have dominated the market over the past few years, only Alphabet is considered undervalued by Morningstar analysts.
The Morningstar US Large Growth Index has returned more than 47% this year, as investors continued to embrace quality companies that have a proven track record of success, even when interest rates are high. However, with the market’s rally broadening and interest rates poised to fall, some strategists say that trade has run its course.
Growth Stocks Fully Valued, While Value Stocks Trade at a Discount
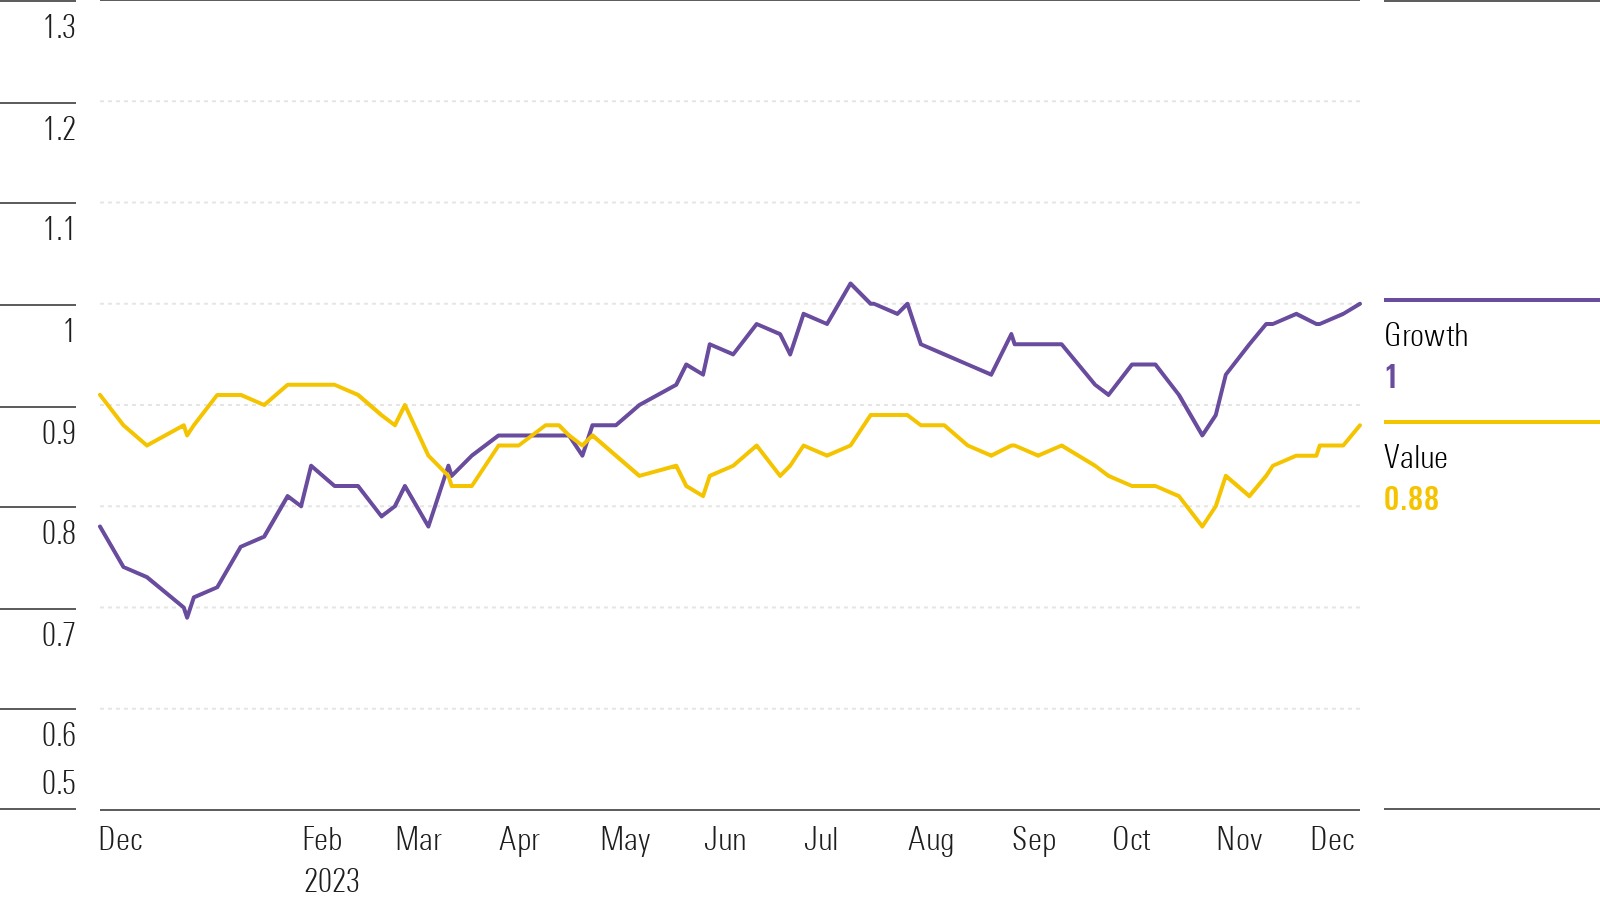
As of Dec. 13, value stocks were trading at an average P/FV ratio of 0.88, which implies a 12% discount for the category. Growth stocks, on the other hand, were fairly valued with a P/FV ratio of 1.0.
A year ago, the opposite was true. At the end of 2022, value stocks were trading at a 9% discount, while growth stocks were significantly cheaper, trading at a 22% discount. The categories swapped places in March, as markets fought through a series of high-profile bank failures.
Growth Stock vs Value Stock Valuations in 2023
Tech Stocks Look Expensive
As of Dec. 13, technology stocks are among the most overvalued sectors, along with industrials. Those categories were trading at P/FV ratios of 1.09 and 1.04, respectively, representing premiums of 9% and 4%.
Average Price/Fair Value Ratio by Sector
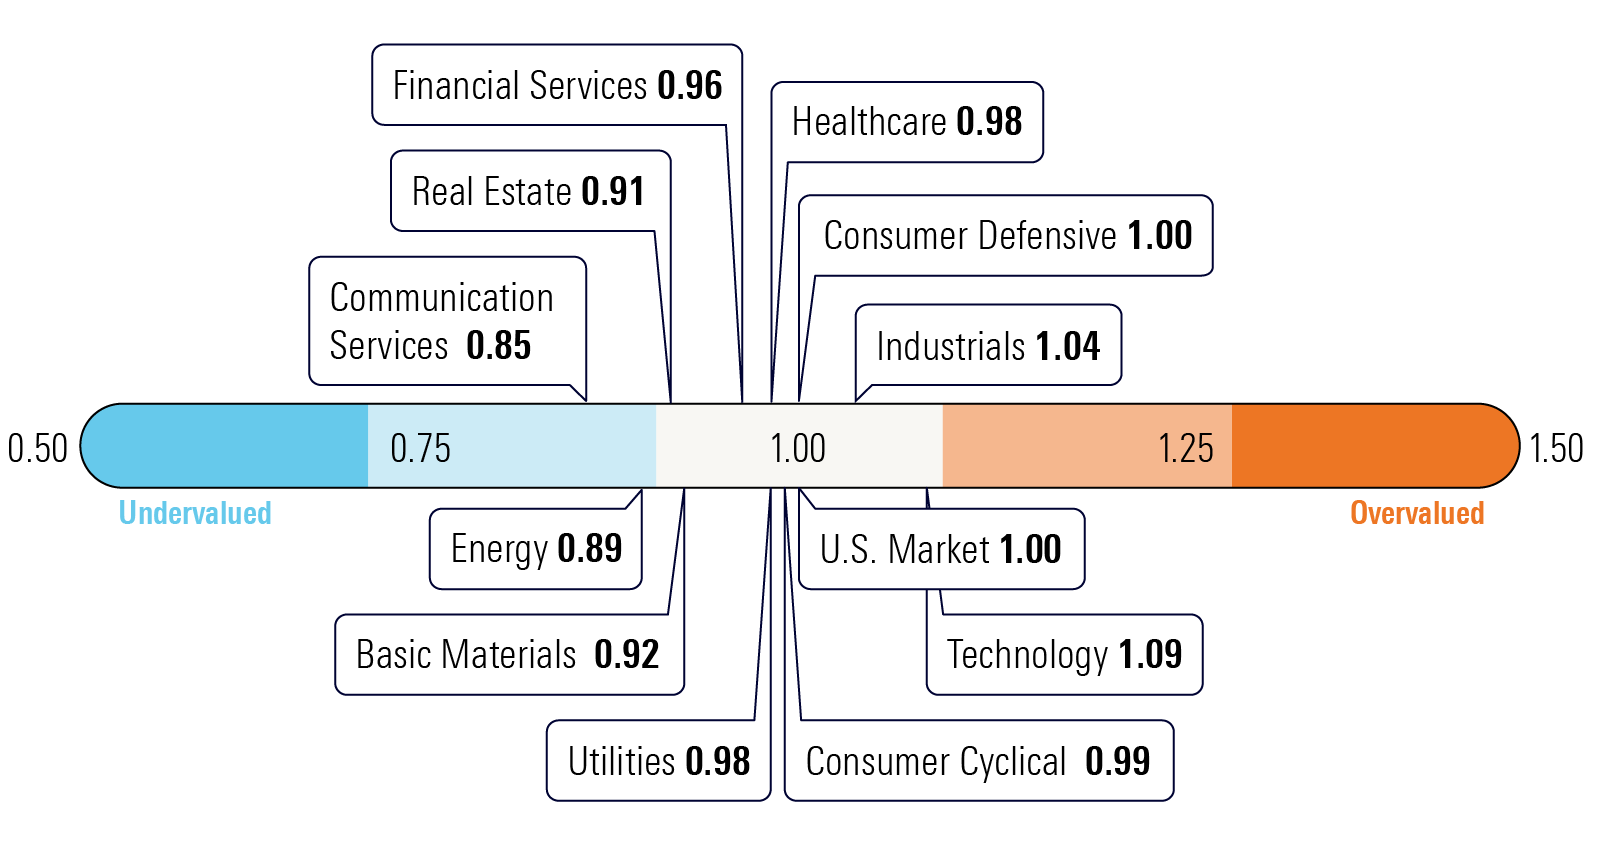
On the other hand, communication services and energy stocks were among the most undervalued categories. With a P/FV ratio of 0.89, energy stocks traded at an 11% discount. The sector has seen triple-digit returns over the past three years. Communication services stocks also traded at a discount, with an average P/FV ratio of 0.85.
The author or authors do not own shares in any securities mentioned in this article. Find out about Morningstar’s editorial policies.
/cloudfront-us-east-1.images.arcpublishing.com/morningstar/VUWQI723Q5E43P5QRTRHGLJ7TI.png)
/cloudfront-us-east-1.images.arcpublishing.com/morningstar/XLSY65MOPVF3FIKU6E2FHF4GXE.png)
/cloudfront-us-east-1.images.arcpublishing.com/morningstar/F2S5UYTO5JG4FOO3S7LPAAIGO4.jpg)
:quality(80)/s3.amazonaws.com/arc-authors/morningstar/ba63f047-a5cf-49a2-aa38-61ba5ba0cc9e.jpg)