
11 min read
Who Else Owns My Bonds?
Morningstar’s new Ownership Breadth feature provides a new way to answer the question.

The Morningstar Ownership Breadth suite of datapoints gives investors a new and important lens to gauge the risk that a bond manager could have trouble selling portfolio holdings, especially if they need to meet large and unexpected redemptions.
Why Ownership Breadth Matters
Consider Intrepid Income ICMUX, which straddles the line between the multisector bond and high-yield bond Morningstar Categories.
With strong three-year performance through July 2026, its asset base grew more than fourfold to nearly USD 1.5 billion during that time, enduring only one month of modest outflows in March 2026.
The liquidity of this fund’s concentrated portfolio, whose largest exposures are to bonds that were issued in relatively small blocks with narrow ownership, has never been tested by severe outflows.
A small ownership base does not by itself entail limited liquidity, but it doesn’t help. And a close look at the portfolio suggests it could be vulnerable in that regard: The median issue size of bonds in the June 2026 portfolio was roughly USD 425 million.
That is not unusually small for high-yield issues, but it skews toward the lower end—the Morningstar US High Yield Bond Index median is roughly USD 600 million. That means that there are fewer bonds to go around to other investors.
Until now, investors haven’t had a clear measure to assess how many other fund managers own either the same bond or at least bonds from the same issuer. Our Ownership Breadth data point makes that possible. Against a 10-point scale, Intrepid Income’s March 2026 portfolio registers a score of only 4.27, indicating comparatively limited ownership across investment portfolios in Morningstar’s database.
The measure takes on even more significance, though, in comparison to other investment options. Vanguard High-Yield Corporate VWEAX and Fidelity Advisor Strategic Income FIWDX, for example, have Ownership Breadth scores of 7.96 and 8.58, respectively.
Those figures are indicative of portfolios with comparatively broad ownership across a universe of mutual funds, exchange-traded funds, and other managed investment vehicles across Morningstar’s global databases. That’s an advantage relative to Intrepid Income if either of those funds’ bonds had to be sold quickly.
How Ownership Breadth Works
To better understand and use the Ownership Breadth score, it's helpful to consider the structure of the bond market itself before turning to how the score is calculated.
Big and Little Bonds
The global bond market is enormous in size, scope, and diversity, by some measures totaling roughly USD 160 trillion, and it's constantly growing on all three fronts. The Morningstar Global Core Bond Index presents an investable sample of the broader taxable bond market, with roughly USD 67 trillion in bonds outstanding.
Some of those bonds comprise several billion dollars in the debt of a single issuer spread across thousands of portfolios, making it likely there will be a wide range of investors who already own those names well enough to consider buying more at the right price.
There are some large municipal bond issuers, too, most of which are from places you would expect. The top-10 largest in the Morningstar Municipal Bond Index include California and its USD 45.7 billion in general obligation bonds, as well as USD 24 billion in GO debt from Massachusetts. Both states also have special borrowing authorities on the list, as do New York and New Jersey.
The bonds of other issuers are a rounding error by comparison, though, and only make their way into the hands of a small number of investors. That’s especially true in the municipal universe, where local issuers dominate. Despite its enormous breadth, the municipal market becomes much shallower once you get beyond the coastal giants.
The Morningstar Municipal Bond Index is specially constructed to focus on the more liquid end of that universe, and comprises roughly 1,925 issuers with a total of nearly 23,000 individual issues. Even with that emphasis, though, roughly half of those issuers each have debt outstanding of less than USD 130 million in face value.
Understanding those dynamics can be valuable, and Morningstar’s coverage universe—with holdings across the universe of funds, ETFs, and other managed investment vehicles around the globe—lends itself to that kind of investigation.
Why Should I Care?
Bonds that sit in a small number of investment funds—and even more so if they’re from issuers whose overall bonds are not widely held—may be much harder to trade. They may not be as efficiently priced as bonds that dozens of firms keep tabs on; they tend to carry wider bid-ask spreads, making them more costly to transact, and they tend to suffer more during market selloffs.
From a fund manager’s perspective, though, taking on liquidity risk might just be the point if it creates opportunities to capture extra returns.
You wouldn’t want to examine a bond in complete isolation, though, which could erroneously make it look illiquid or esoteric. For example, a specific Disney-issued bond residing in only a modest number of portfolios might still be pretty liquid overall.
Traders are likely well acquainted with the name, and ample liquidity among some of the company’s bonds tends to support the liquidity of all its bonds, as long as they’re not structured in a notably different or unusual way.
How bond-level and issue-level ownership interact often depends on bond type. As with Disney, the issuer often matters the most for a corporate bond. Typically, any problems an issuer has will propagate through most or all its bonds, depending on their individual traits.
On the other hand, for an asset-backed security, the collateral assets that back a specific bond, whether home loans, auto loans, or aircraft leases, generally matter much more than the entity that packaged and issued it, such as Banco Santander, whose name is otherwise labeled on the security.
How Does the Mutual Fund and ETF Universe Shake Out?
As we alluded to, a modest level of holdings breadth isn’t necessarily bad. A well-run fund with a stable investor base, plenty of flexibility to raise cash, and an ability to avoid selling bonds under duress can take advantage of pricing inefficiency and liquidity premiums that often come with bonds that aren’t widely held.
If your fund does have a low ownership score, though, it would make sense to figure out why and whether the fund has been compensated for that profile.
Not surprisingly, the largest cohort of low-scoring funds is in the municipal bond universe. Whether cities, towns, school districts, or any number of governmental authorities, individual municipal bond issuers tend to have smaller sums of bond debt outstanding than investment-grade-rated corporations, for example.
So there just aren’t that many bonds per issuer to begin with. That’s a key reason you’ll find a larger share of lower Ownership Breadth scores in the municipal bond fund universe than that for taxable bonds.
Scoring Ownership Breadth
To help put that into context, Morningstar’s Ownership Breadth methodology assigns scores to each holding based on how widely it is held across Morningstar's global portfolio database, then rolls them up into a composite portfolio score that assigns lower weights to concentrated exposures in thinly owned securities. High scores, by contrast, imply broad ownership across the universe.
We calculate the scores monthly and only publish them when we’re able to classify at least 80% of a portfolio's net assets using data from the past six months.
The methodology also looks through fund-of-funds structures to their underlying holdings. So, when one fund holds other funds, we don’t treat the wrapper fund as a single holding. Instead, we drill down to the individual securities held by the underlying funds, attributing them at the appropriate weights to the parent portfolio.
This look-through approach is applied recursively, so the score for a fund-of-funds holding another fund-of-funds will still incorporate the bottom-layer securities. Without look-through, a fund-of-funds holding widely available open-end mutual funds could appear to have concentrated, thinly owned holdings simply because only a few portfolios hold the wrapper fund itself.
The Nuts and the Bolts
At a high level, the process involves grouping similar securities, measuring how frequently they appear in portfolios, and then aggregating those observations into a portfolio-level score.
The methodology starts by identifying every bond by its issuer and Morningstar holding type and treating every bond with that “pair” profile the same way. Using our Disney example, if we identify 10 different Disney bonds of the same holding type, and each bond appears 10 times across the universe, the methodology will assign a score to each bond as though it appears 100 times rather than 10.
We then divide the universe by the number of portfolios in which the bond pairs appear into 10 buckets broken into percentile ranges, as shown below. They begin with 20-percentage-point increments and eventually narrow to 5-percentage-point increments as ownership broadens.
The asymmetrical percentile thresholds are intentional: The lower percentile buckets with far fewer instances of ownership let us distinguish ownership of esoteric, private assets. The higher percentile buckets help introduce some granularity at the more-liquid end of the spectrum. The number of portfolios at each threshold is a rounded estimate, and it can change slightly each time. Morningstar reconstructs the pair count distribution once per year.
Based on those percentile distributions, for example, we would place a company and security pair that shows up in 500 portfolios into Bucket 5, as it has between 400 and 1,000 owners. Once we’ve bucketed all the observations, we can use the data to calculate an overall Ownership Breadth score that gives more credit to large exposures of widely held securities, and vice versa.
There are two multipliers in our methodology. The first is the number associated with each bucket. (For purposes of these illustrations, we’ll call it a bucket multiplier or bucket grouping multiplier.) It is the number of the bucket, and we multiply it by the percentage weight of the portfolio allocated to that bucket.
We call the second multiplier a multiplicative WeightFactor. It is a fixed constant for each bucket and akin to a penalty for low-occurrence holdings so that they contribute even less to the overall score. We then sum the weighted contributions from each bucket to arrive at the portfolio’s Ownership Breadth score. A higher score implies more breadth of ownership, and vice versa.
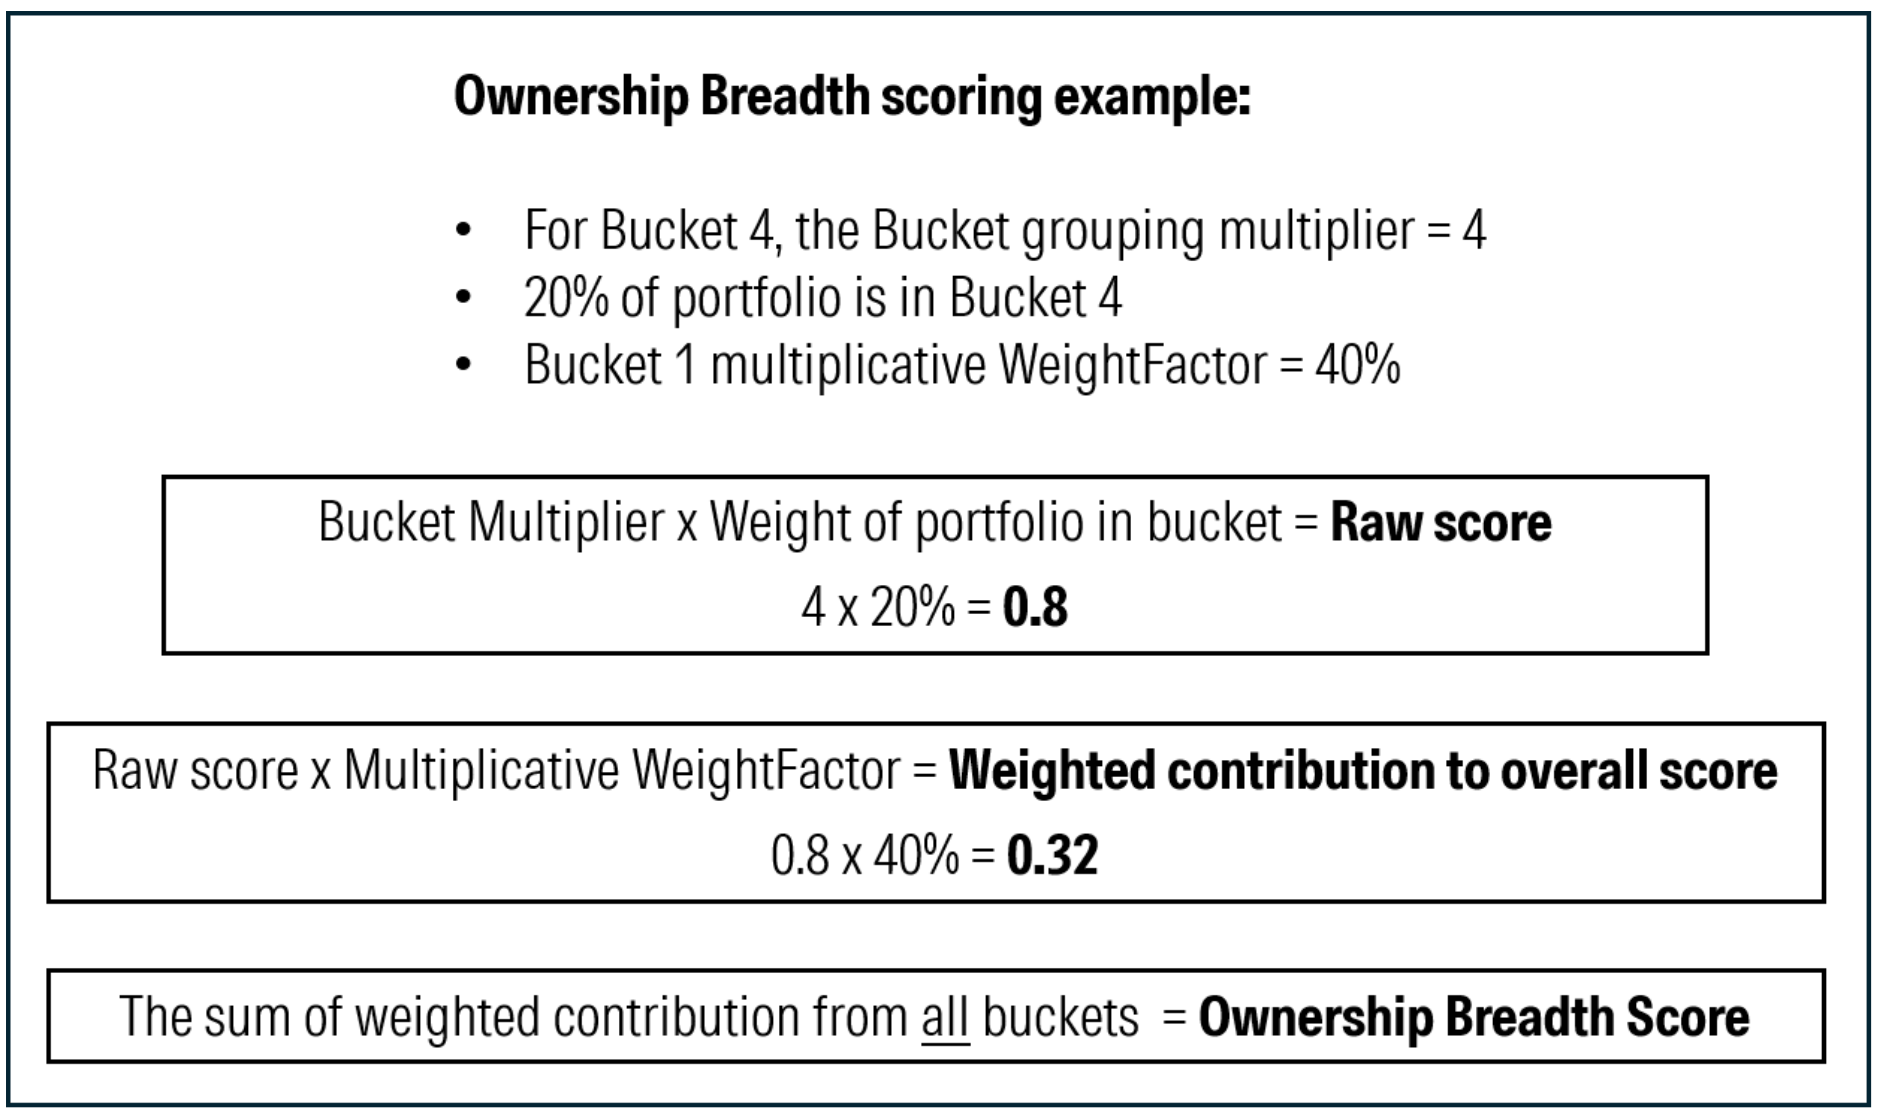
The Weight Factor inherently penalizes a portfolio with more assets in less-liquid buckets. Without it, a portfolio with 100% of its assets in Bucket 9 would have the same holding-level Ownership Breadth score as a portfolio with 90% of its assets in Bucket 10 and 10% of its assets in the least liquid Bucket 1.
Our methodology applies to any managed investment or custom portfolio for which Morningstar has sufficient holdings data and is not constrained by vehicle type or investment market. It’s designed to score mutual funds, ETFs, funds-of-funds, separately managed accounts, model portfolios, and other portfolio structures, provided that we can map their holdings to the Ownership Breadth methodology framework.
One Piece of the Puzzle
Ownership Breadth by itself is not a measure or estimate of liquidity. It is instead a structural indicator and reflects the prevalence of a portfolio’s holdings across Morningstar's global database at the time we make the calculation. It doesn’t incorporate real-time market data such as trading volume, bid-ask spreads, or order book depth, nor does it adjust for market conditions.
A portfolio that appears liquid under normal conditions may behave differently during periods of market stress, concentrated redemption activity, or turbulence in specific asset classes.
As such, it’s best to use these scores as one input among several in a broader assessment, and it’s a good idea to consider them alongside other potential indicators of liquidity risk. For US investments required to submit regulatory filings, for example, Morningstar analysts periodically check the percentage of a portfolio’s holdings—referred to as Level 3 assets by accounting standards—that are priced with so-called unobservable inputs, rather than prices from actual trades or those of very similar securities. (Broadly speaking, Levels 1 and 2 denote quoted market prices or other significant observable inputs, respectively.)
In effect, a Level 3 designation means an asset manager or service provider has manually estimated prices using metrics like probability of default, expected recovery in the event of a bankruptcy, or discounted cash flows, among others. The label does not explicitly denote that something is illiquid, but it’s a strong indication that it isn’t likely to be bought or sold as quickly or easily as holdings with numerous daily trade observations.
That kind of research can be helpful in identifying funds that may be taking on more risk than others. Level 3 assets climbing notably over a few filings combined with outflows over the same period, for example, could be a signal that a manager has been forced to sell their more liquid holdings to meet redemptions, causing their least-liquid holdings to comprise a bigger share of a portfolio.
Importantly, a low percentage of Level 3 assets doesn’t mean a portfolio is perfectly liquid, either. Pricing services and asset managers are able to apply a Level 2 label to most high-yield bonds, for example, even if there haven’t been observable trades for the exact bonds in question. As long as there are sufficient so-called observable inputs for bonds that are sufficiently similar to meet accounting standards, an advisor can categorize a bond as Level 2.
Intrepid Income Once More
Returning to Intrepid Income, the vast majority of its portfolio holdings are labeled Level 1 or 2. The fund reported Level 3 assets of only 1.45% as of March 2026, even though it carries a relatively modest 4.27 Ownership Breadth score. As we alluded to earlier, market conditions can have an important impact on liquidity, too.
Even if it might become difficult to trade during a credit crunch or other market crisis that puts pressure on riskier assets, a high-yield bond can properly warrant Level 2 treatment.
Our Ownership Breadth methodology leverages Morningstar’s holdings data to provide a different, more precise lens than Level 1, 2, or 3 classifications. It helps to distinguish among thinly represented private assets while also identifying public securities with more limited ownership bases and thus greater potential to run into liquidity problems in a forced-selling situation.
Ultimately, it enables investors to better understand a key dimension of liquidity risk and the degree to which it is, or isn’t, in their portfolios.
Explore Ownership Breadth in Morningstar Direct.
See how widely bonds are held and uncover potential liquidity risks with Morningstar’s new Ownership Breadth feature.
Disclaimer: Maciej Kowara owns shares in Vanguard High Yield Corporate Fund.