
ETFs Close Mild First Half with an Exclamation Point
Investors poured nearly $75 billion into ETFs in June.
/s3.amazonaws.com/arc-authors/morningstar/30e2fda6-bf21-4e54-9e50-831a2bcccd80.jpg)

Key Takeaways
- The Morningstar Global Markets Index, a broad gauge of global equities, climbed 13.2% in the first half of 2023. The Morningstar US Core Bond Index added 2.1%.
- U.S. exchange-traded funds collected $212 billion in the first half of 2023, equating to a 3.2 organic growth rate.
- Stock and bond ETF flows were neck-and-neck, but bond ETFs’ smaller base gave them an edge on an organic-growth basis.
- U.S. large-blend funds led all Morningstar Categories with $56.6 billion in first-half flows after a tremendous June.
- The U.S. large-value category bled $15.3 billion in the first half—worst among all categories.
- Investors played it safe in the fixed-income arena, dumping $49 billion into Treasury ETFs.
- Sector-equity ETFs shed nearly $15 billion as cheaper sectors like energy, healthcare, and real estate fell out of favor.
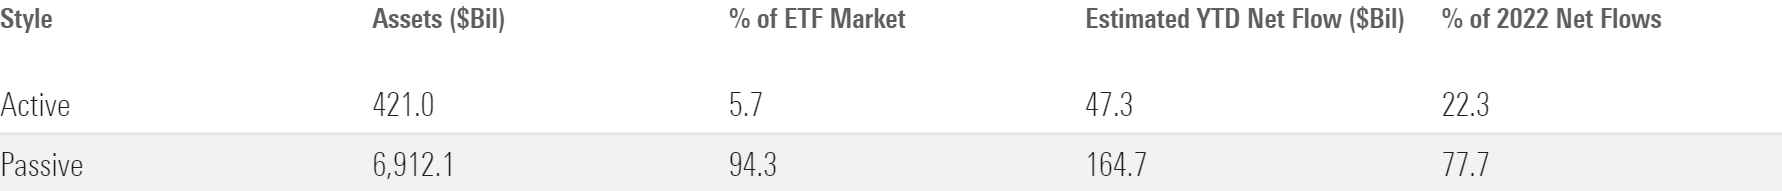
- Active ETFs continued to punch above their weight, attracting more than 22% of all ETF net flows.
- Sustainable ETFs shed $5.8 billion despite sound performance from the faster-growing stocks they tend to favor.
Stocks Enter a New Bull Market
The exhibit below shows June returns for a sample of ETFs that serve as proxies for major asset classes. A blended portfolio generated a 3.45% return last month, as excellent stock returns offset a middling month for bonds.
June Market Performance Through the Lens of Morningstar Analyst Rated ETFs
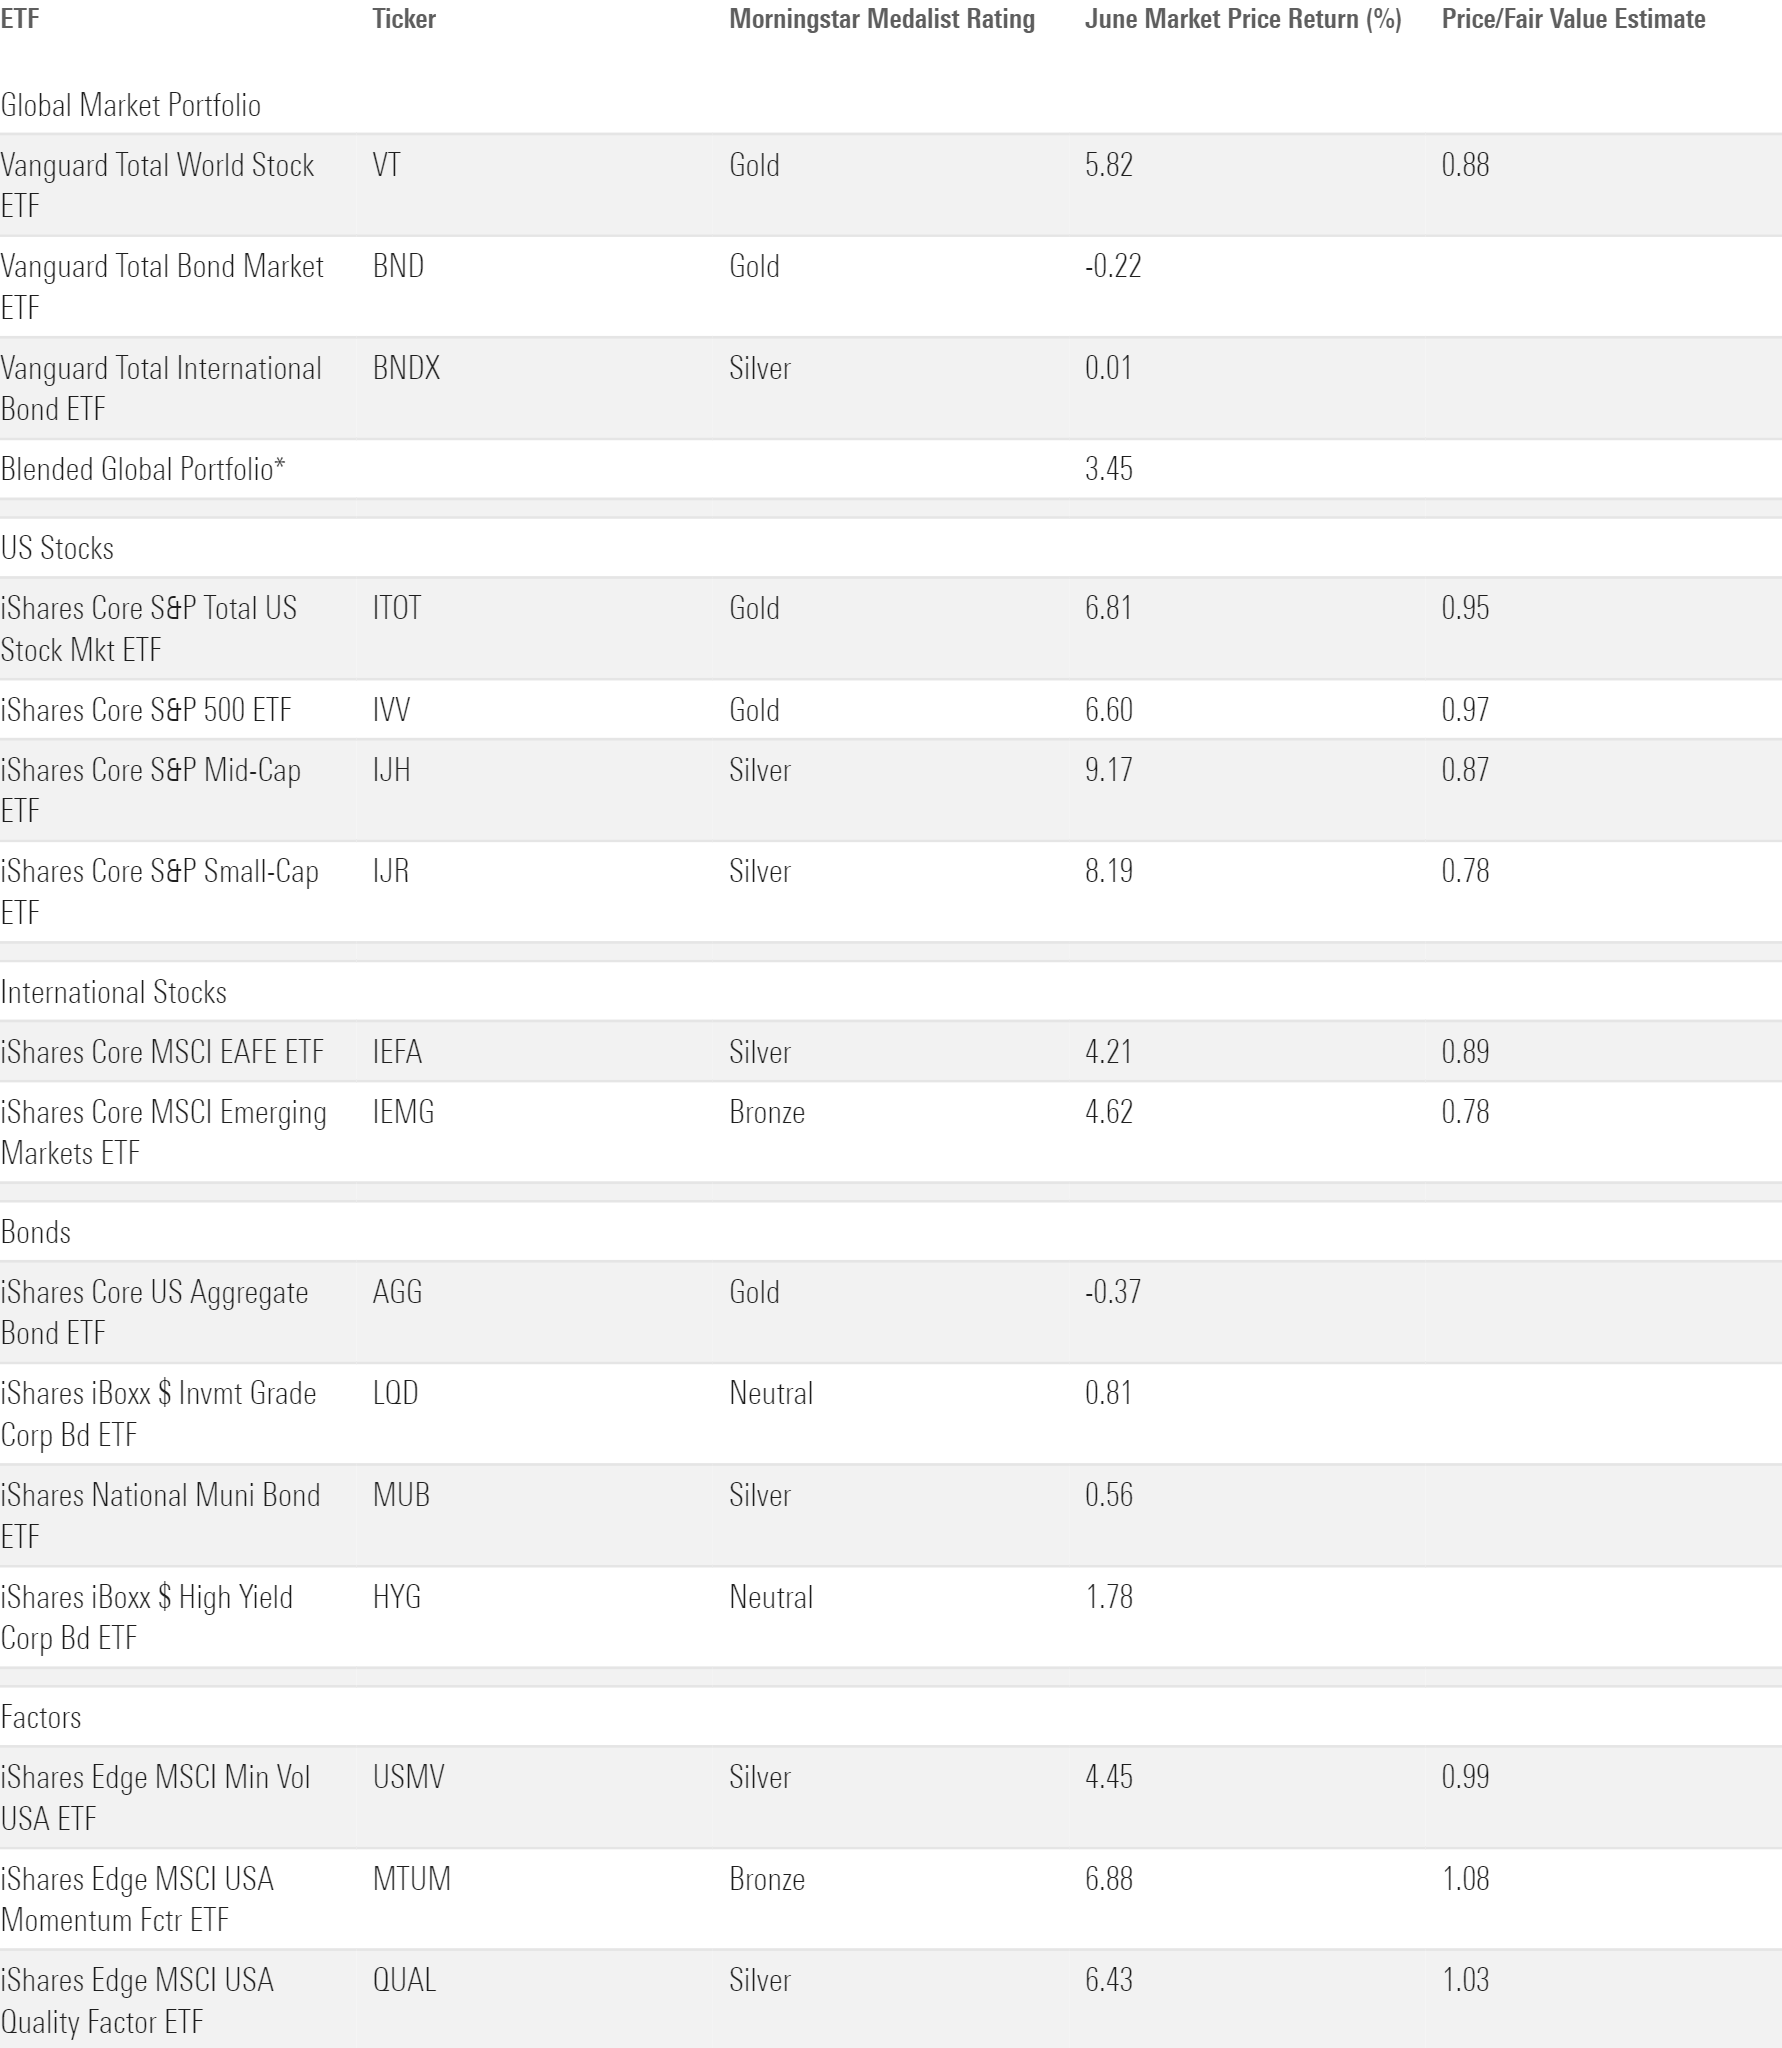
Vanguard Total World Stock ETF VT single-handedly constitutes the blended portfolio’s stock sleeve and powered its strong June performance. That was the story of the first half, as global stocks rebounded with gusto from a challenging 2022 environment.
U.S. equities constitute about 60% of VT and helped drive its first-half recovery. Vanguard Total Stock Market ETF VTI advanced 16.12% in the first half, its best six-month span since March through November 2021. Economic news was more positive than negative in the first half, instilling hope that the fabled “soft landing” could come to fruition and aid stock returns. Plus, the advent of artificial intelligence sparked a buying frenzy of companies that work with the technology.
A handful of mega-cap firms did the heavy lifting for the U.S. market rally. Morningstar recently attributed three fourths of the Morningstar Market Index’s first-half gain to seven stocks: Nvidia NVDA, Tesla TSLA, Meta Platforms META, Apple AAPL, Amazon.com AMZN, Microsoft MSFT, and Alphabet GOOGL. The dominance of these enormous, fast-growing companies explains first-half performance along market-cap and value-growth dimensions. IShares Core S&P 500 ETF IVV beat iShares Core S&P Small-Cap ETF IJR by more than 10 percentage points; Vanguard Growth ETF VUG trounced Vanguard Value ETF VTV by more than 30 percentage points.
Foreign stocks had a solid first half in their own right. Vanguard Total International Stock ETF VXUS finished the half 9.87% higher than where it started. Developed-markets stocks fared better than their emerging-markets peers—iShares Core MSCI EAFE ETF EFA beat iShares Core MSCI Emerging Markets ETF IEMG by about 5 percentage points—but the latter closed with a strong June. In the developed-markets space, few regions fared as well as the eurozone. Led by strong growth in France, Germany, and Netherlands equities, iShares MSCI Eurozone ETF EZU notched an 18.35% first-half gain.
Bonds Get Back on Track
Both of the blended portfolio’s fixed-income components finished the first half comfortably in the black. Vanguard Total Bond Market BND and Vanguard Total International Bond ETF BNDX gained 2.42% and 3.77%, respectively. U.S. bonds burst out of the gates in 2023 but wobbled after January. By the time the Federal Reserve concluded its first meeting without raising interest rates in over a year, investors seemed to settle on a more sober outlook for the bond market. International bonds followed a similar trajectory. BNDX climbed 3.56% in the first quarter but only 0.19% in the second.
ETF Flows Finish Strong
After a hot January and cold February, ETF flows settled into a solid rhythm over the subsequent three months. Investors sank between $29 billion and $33 billion into U.S. ETFs in each month from March through May. The dam finally broke in June when investors poured in nearly $75 billion of new money, the largest sum since October 2022.
Halfway through 2023, ETFs have gathered about $212 billion of flows on the year. That translates into an organic growth rate of 3.2%—nothing to sneeze at, but well short of the growth rates that ETFs clocked in 2020, 2021, and 2022.
June Flows Across Morningstar Broad Category Groups
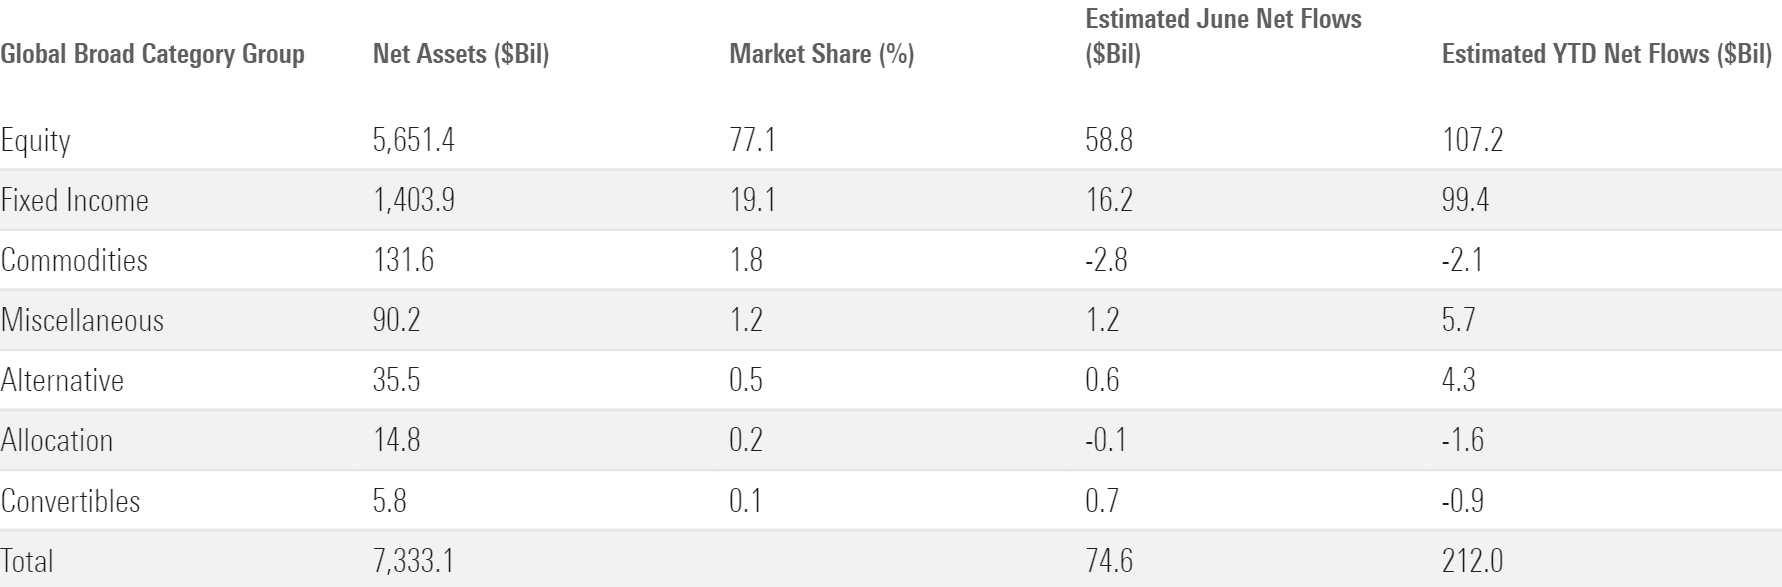
Stock ETF Flows Improve in the Second Quarter
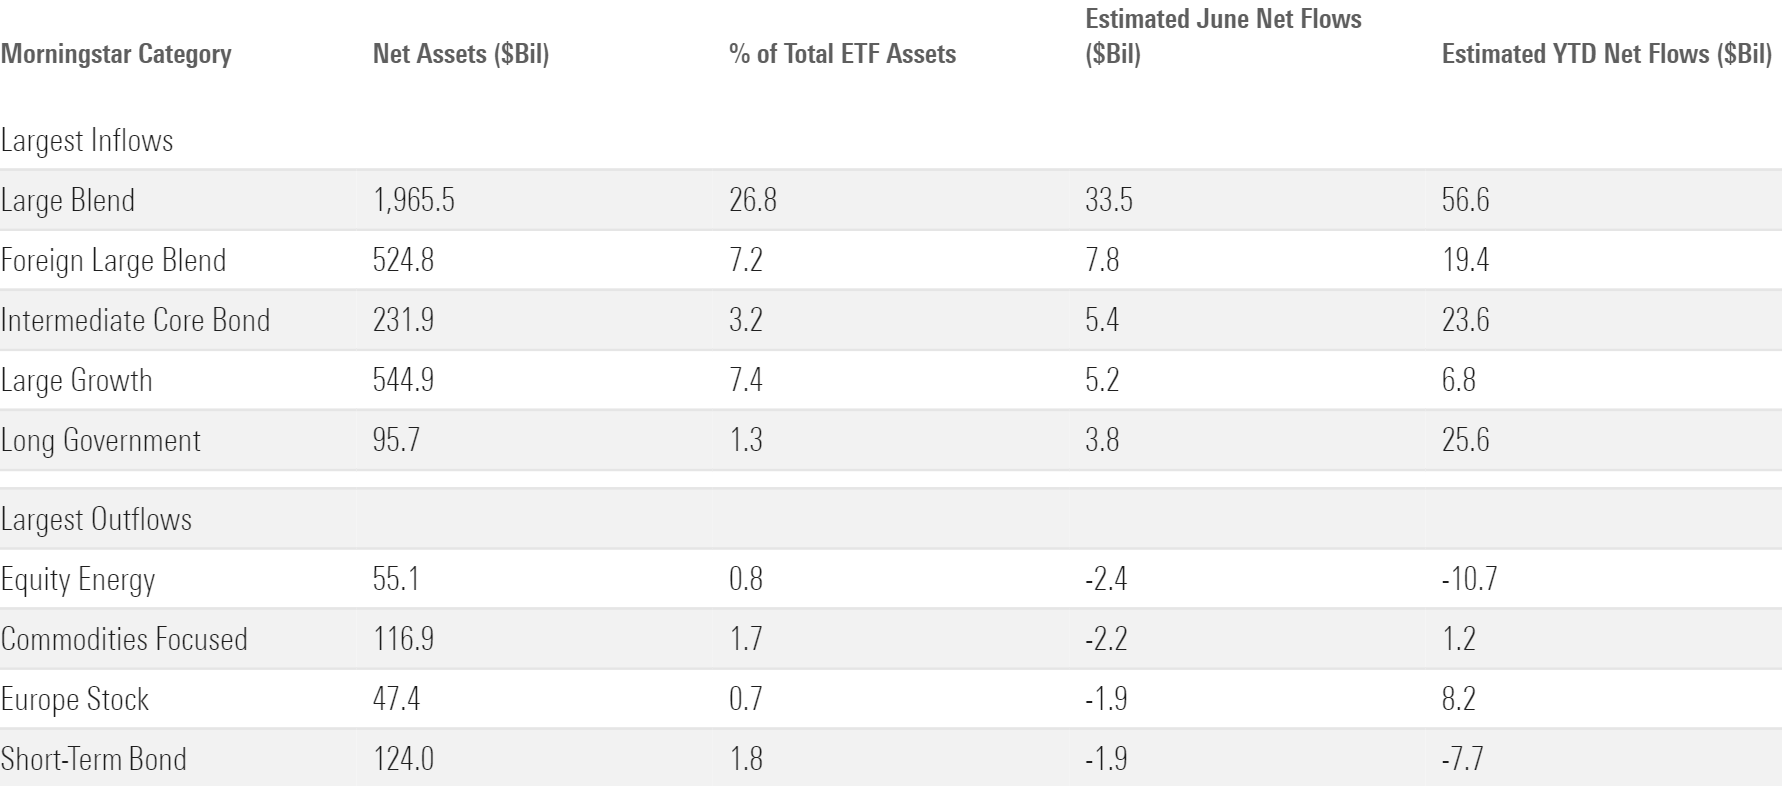
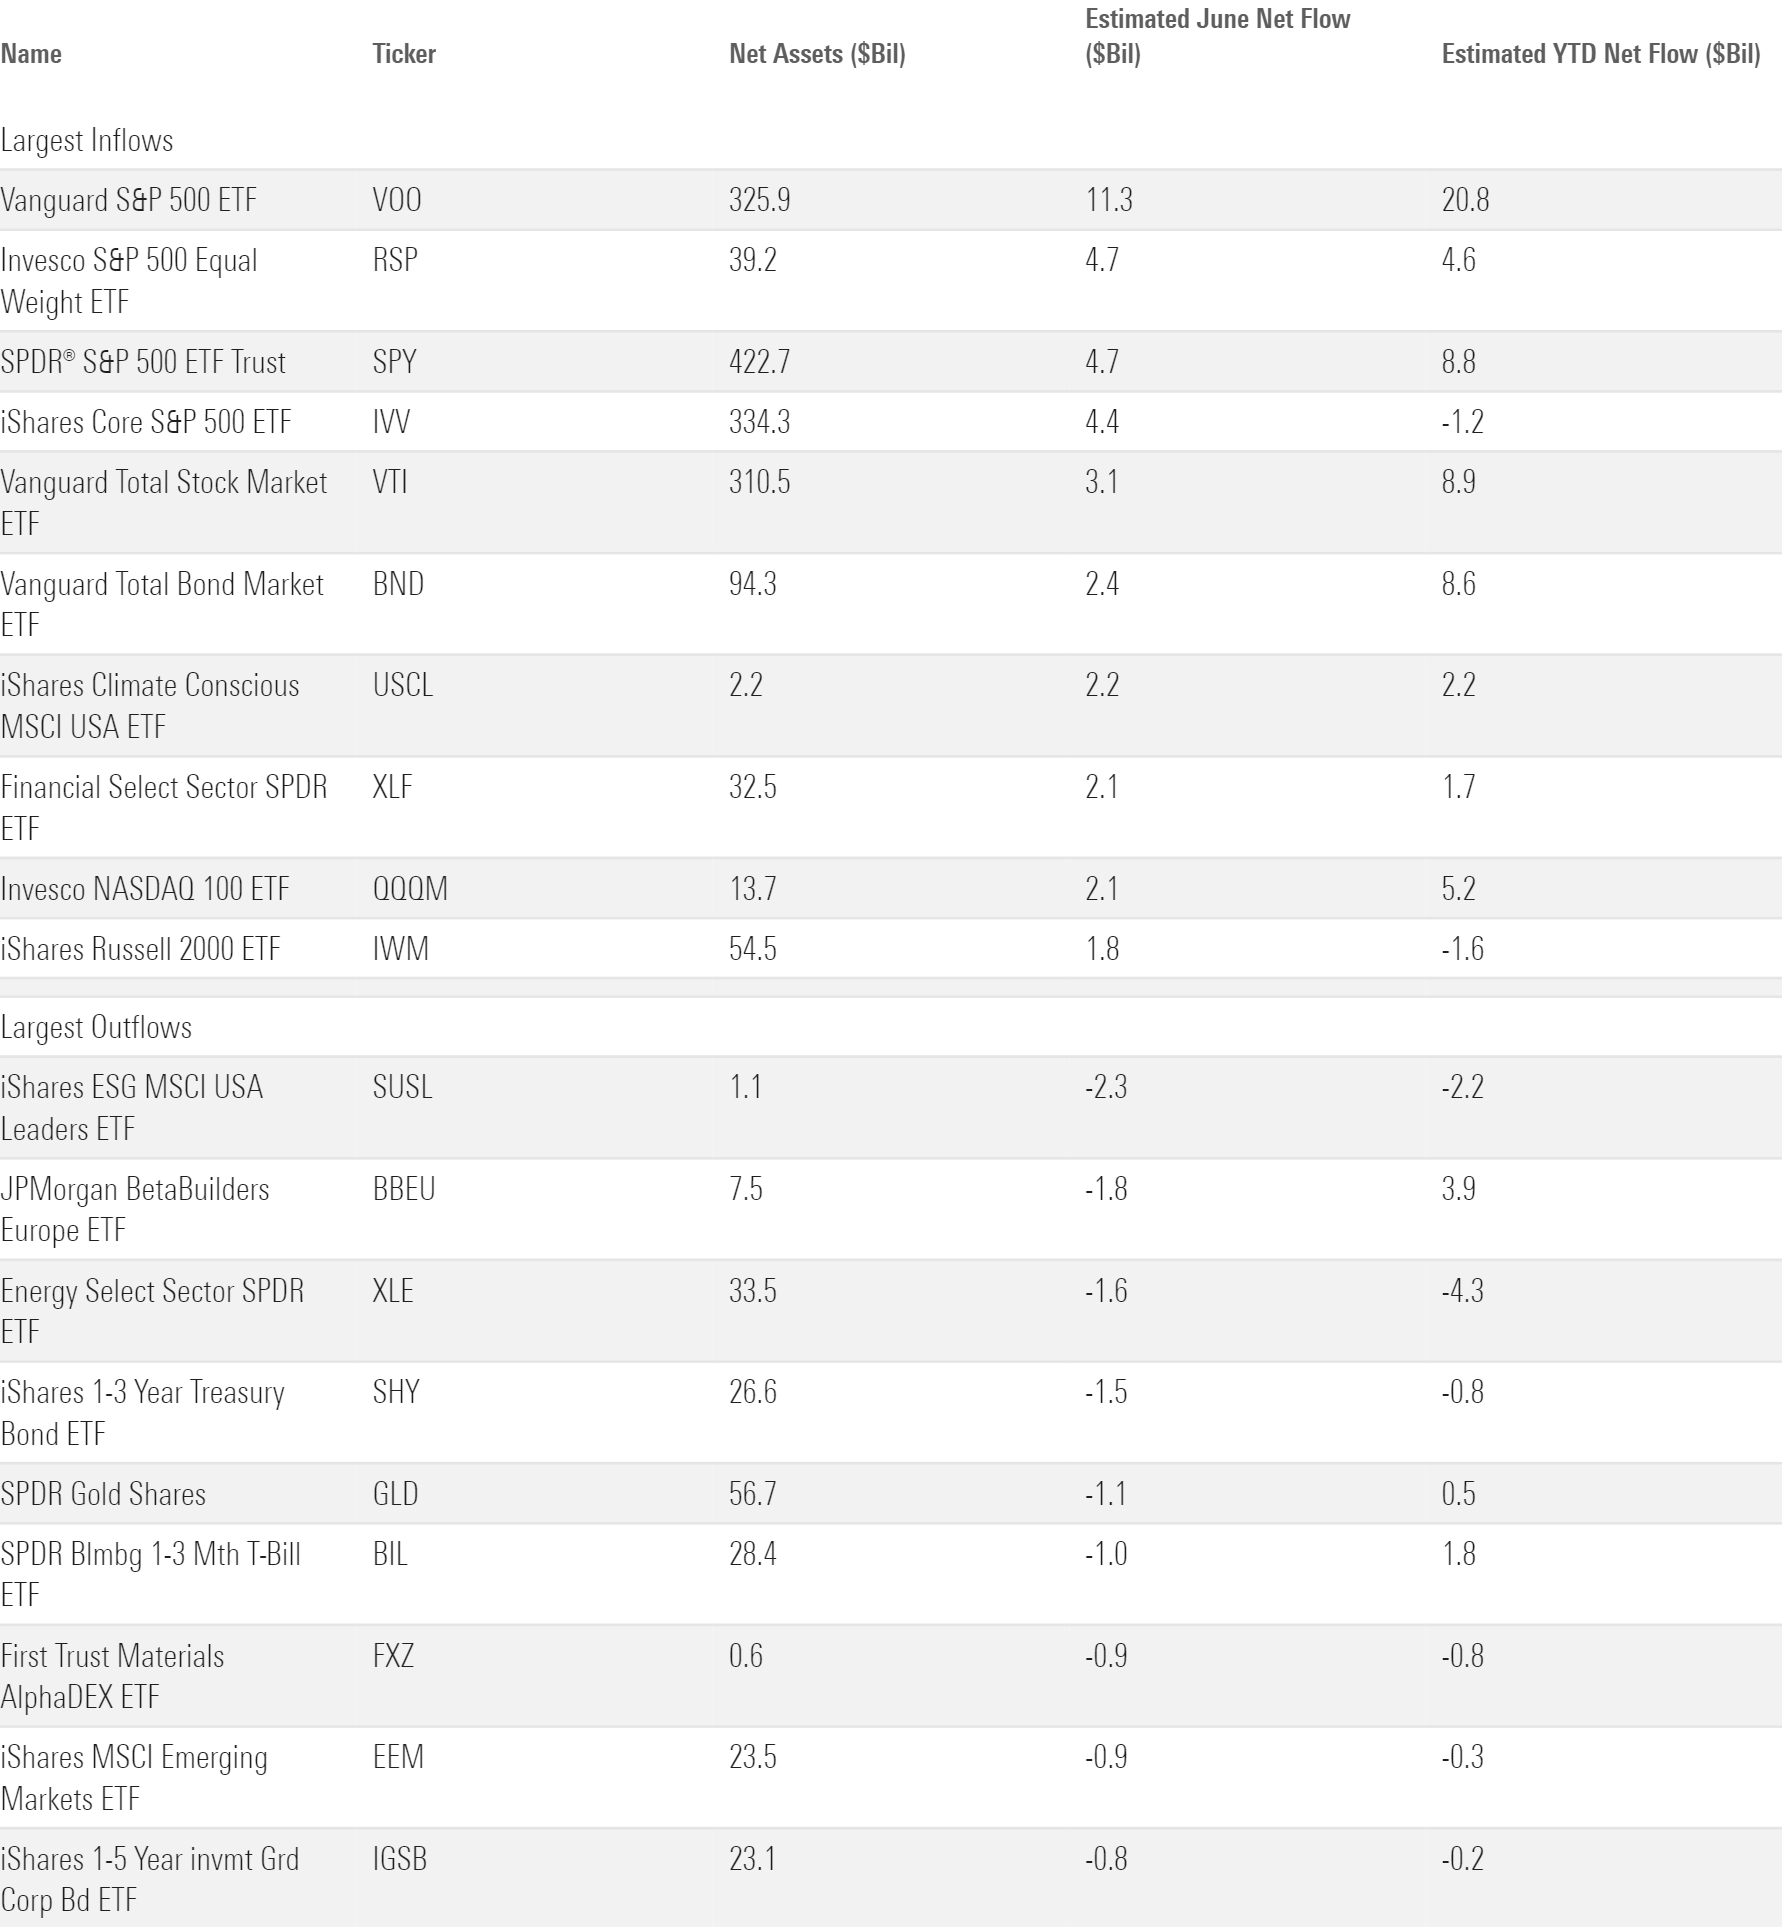
Stock ETFs reeled in $107.2 billion for the year to date through June. That translated into a fairly modest 2.2% organic growth rate for the cohort that represents 77% of the overall ETF market. These ETFs stumbled to a slow start with $4.8 billion of first quarter outflows but righted the ship with a strong haul in the second. Behemoth broad-market trackers like Vanguard S&P 500 ETF VOO, IVV, VTI, and SPDR S&P 500 ETF Trust SPY led the turnaround. The large-blend category, where those ETFs sit, pulled in a whopping $33.5 billion in June, more than half their total for the year to date.
Many investors cut bait on value ETFs in the first half. The large-value category bled $15.3 billion. Almost all that money flooded out in May, by far the category’s worst month on record. Broad value index trackers were hit hardest: iShares Russell 1000 Value ETF IWD shed $5.3 billion in the first half, most in the category. A retreat from dividend strategies—bright spots in last year’s bear market—also weighed on flows because many of them sit in value categories. U.S. equity dividend ETFs shed $4.3 billion in the first half after the broader cohort pulled in a record $69.8 billion in 2022. Many investors lost their patience with value after growth stocks dominated the market early in 2023, betting that cheaper stocks’ day in the sun has already come and gone.
Investors’ distaste for value stocks manifested itself in sector-equity ETF flows as well. The cheaper sectors that paced the market last year fell out of favor in the first half. Energy bore the brunt of the pain with a $10.7 billion first-half exodus, but outflows from healthcare ($4.6 billion) and real estate ETFs ($ 3.9 billion) stung as well. Sectors that performed better were mostly rewarded with inflows. Consumer cyclical ETFs hauled in $2.2 billion to lead the space, followed by the communications category’s $2 billion intake. Overall, investors yanked $14.7 billion from the sector-equity space, opting instead for broader offerings.
International-stock ETFs enjoyed a smoother first half of flows than their domestic counterparts. The foreign-large blend category spearheaded the effort, where plain-vanilla index trackers like Vanguard FTSE Developed Markets ETF VEA and VXUS reeled in over $3 billion apiece. Diversified emerging-markets ETFs reeled in a sturdy $9.3 billion, led by IEMG’s $4.7 billion first half. And though the Europe-stock category closed with a slow second quarter, their tremendous start left them with $8.2 billion of first-half inflows. JPMorgan BetaBuilders Europe ETF BBEU was the leader there, collecting $3.9 billion that doubled its total asset base.
Morningstar Categories With the Largest June Flows
Bond ETFs Continue to Expand
The $99.4 billion that fixed-income ETFs gathered in the first half wasn’t far behind stock ETFs, but their 7.7% OGR was far stronger. Investors struck a fairly conservative stance within the fixed-income space. Government-bond funds were the main beneficiaries. The long-, intermediate-, and short-term bond categories collectively raked in $49 billion in the first half. That represented about half of all bond-ETF net flows, a tidy ratio for the categories that compose only 20% of the universe. Even as equities staged a strong first-half rally, the rush into government-bond ETFs indicates that some investors may still harbor suspicions about the 2023 rebound.
While bond-ETF investors gravitated toward safer credit bets, they had no qualms about loading up on interest-rate risk. Within the Treasury space, the long-term government category reeled in $25.6 billion, well ahead of the short-term government category’s $10.5 billion haul. Along the same lines, diversified long-term bond ETFs added $3.6 billion as their short-term siblings leaked $7.7 billion, second worst among all fixed-income categories. Even as long-term interest rates simmered from their late-2022 peak, investors remained keen to lock them in for the long run, perhaps expecting the Fed to slash interest rates before hiking them further.
ETFs With the Largest June Flows
Active ETFs Keep Their Momentum
Active ETFs continued to make waves after splashing on the scene in 2022. They accounted for only 5% of the ETF market when the calendar flipped to 2023 yet absorbed $47.3 billion in the first half—about 22% of all net flows. Dimensional claimed the first-half active ETF flows belt with a $14.8 billion haul. Dimensional U.S. Core Equity 2 ETF DFAC, its largest ETF, collected $2.4 billion to set the pace. JPMorgan Equity Premium Income JEPI and the rest of the firm’s active ETF lineup were hot on Dimensional’s trail with a lofty $13.3 billion inflow of their own. The first half of 2023 also saw 134 new active ETFs come to life, another testament to the growth of this burgeoning market segment.
Active ETFs Remain in Vogue
Sustainable ETFs Sputter
“All the rage” was a moniker that belonged to sustainable ETFs before active ETFs snatched it. Now, sustainable ETFs are falling behind. Their annual inflows peaked at nearly $40 billion (59% OGR) in 2021, but a challenging market shrunk their 2022 intake to about $4 billion before shedding $5.8 billion in the first half of 2023. Increased politicization surrounding environmental, social, and governance investing could have sparked the exit. Performance and style preferences offer a murkier explanation: Most sustainable ETFs lean toward growth stocks, a style that has worked brilliantly in 2023. Given the flow patterns between value and growth ETFs and sustainable strategies’ mostly sound performance, it’s somewhat of a surprise to see them falling back in 2023.
Familiar Territory for Vanguard
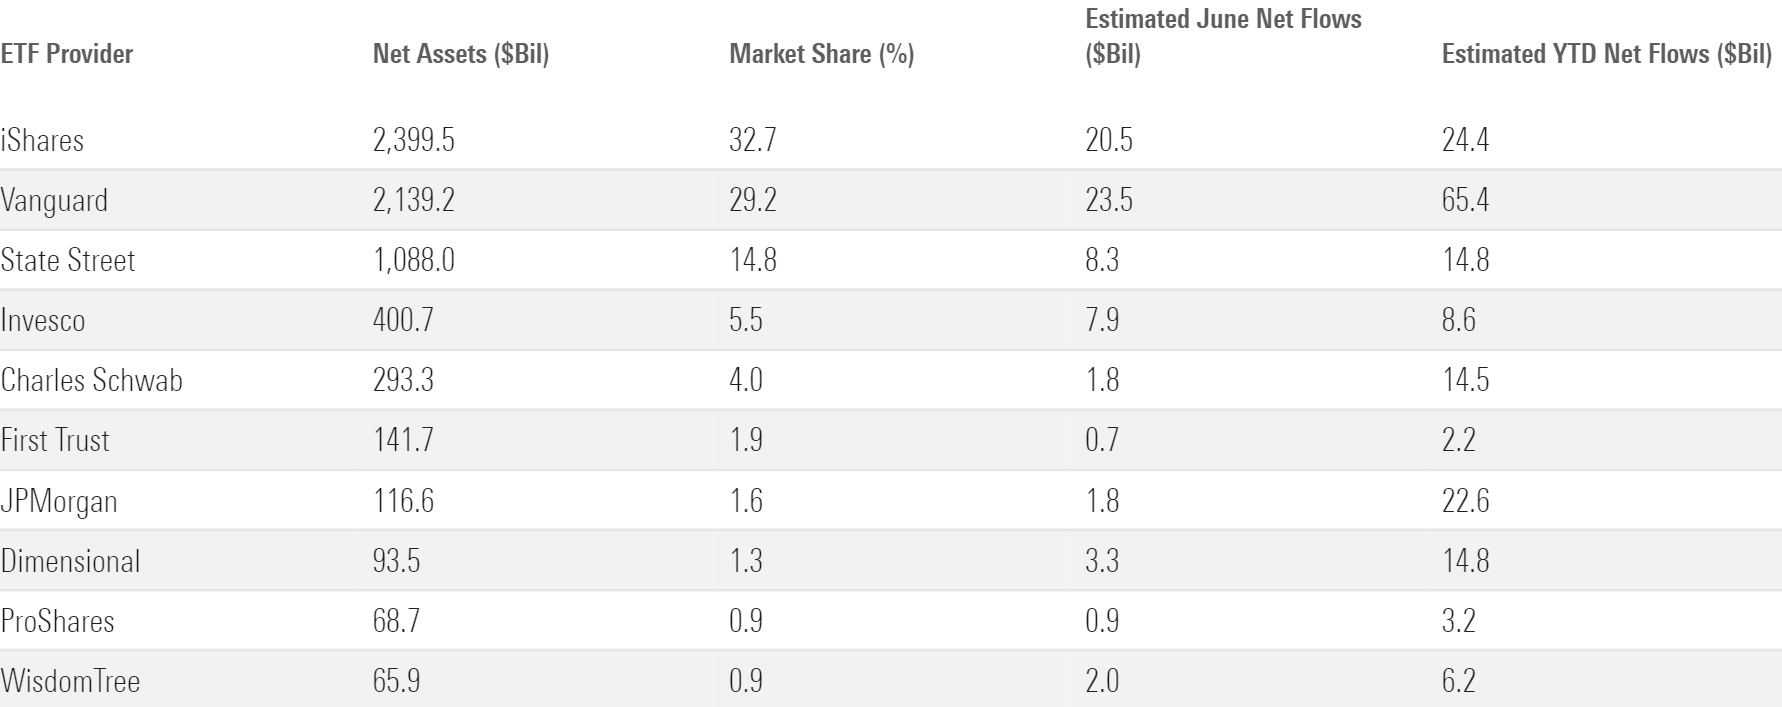
Vanguard sits atop the ETF provider flows leaderboard halfway through 2023. With all 10 of the largest ETF providers in inflows so far in 2023, let’s go around the horn for a brief look at each, from the largest to the 10th-largest:
1) It has been a tale of two asset classes for iShares: investors have poured $46.7 billion into its bond ETFs but pulled $19.3 from its roster of equity strategies. Tremendous inflows into iShares’ Treasury ETFs have offset the exodus from its ESG, style index, and factor products.
2) U.S. stock funds are Vanguard’s bread and butter—they account for well over half the firm’s ETF assets—and they have indeed led the way so far this year. But solid inflows into Vanguard’s bond and international-stock products have made strong contributions and pushed the firm into first place so far in 2023.
3) State Street and its crown jewel, SPY, have had an up-and-down year of flows. Sector ETF outflows held the firm’s first-half haul to about $14.8 billion, a fairly modest sum for a provider of its stature.
4) Most of Invesco’s ETF assets sit in its U.S. stock lineup, and those funds have fared decently well. Of note: Invesco QQQ Trust QQQ leaked $1.2 billion, but the Invesco Nasdaq 100 ETF QQQM absorbed $5.2 billion. Investors have moved into the cheaper version, which tracks the same index as QQQ.
5) Schwab’s bond ETF lineup claimed about half its inflows despite accounting for only 15% of its ETF assets. Schwab 5-10 Year Corp Bond ETF SCHI and Schwab Short-Term Treasury ETF SCHO have each absorbed between $4 billion and $5 billion so far this year.
6) First Trust has remained a major player in the active ETF movement. Investors sank about $3.3 billion into its active lineup over the first half but pulled $1 billion from its index strategies.
7) To the delight of J.P. Morgan, JEPI-mania spilled into 2023. It tacked on a fresh $10 billion of new money in the first half. Solid growth from BBEU and JPMorgan Nasdaq Equity Premium Income ETF JEPQ also helped the firm cruise to $22.6 billion of first-half flows, third among all ETF providers.
8) Dimensional collected $14.8 billion in the first half. All 31 ETFs on its roster finished the half with net inflows.
9) ProShares butters its bread with a range of leveraged ETFs that provide long or short exposure to popular indexes. Many of its customers found themselves on the wrong side in the first half: ProShares UltraPro QQQ TQQQ offers triple-leveraged exposure to the Nasdaq 100 and suffered $3.2 billion of outflows, while ProShares UltraPro Short QQQ SQQQ—triple-leveraged inverse exposure—added $5.3 billion. The Nasdaq 100 Index gained 39.4% in the first half.
10) WisdomTree posted a solid first half to the tune of $6.2 billion of inflows. WisdomTree Floating Rate Treasury ETF USFR led the way with $3.9 billion, capitalizing on investors’ appetite for investments in the ultrashort bond category.
June Flows for the 10 Largest ETF Providers
Small-Cap Stocks Look Cheap
The fair value estimate for ETFs rolls up our equity analysts’ fair value estimates for individual stocks and our quantitative fair value estimates for stocks not covered by Morningstar analysts into an aggregate fair value estimate for stock ETF portfolios. Dividing an ETF’s market price by this value yields its price/fair value ratio. This ratio can point to potential bargains and areas of the market where valuations are stretched.
The 10 Most Under- and Overvalued Broad-Based ETFs
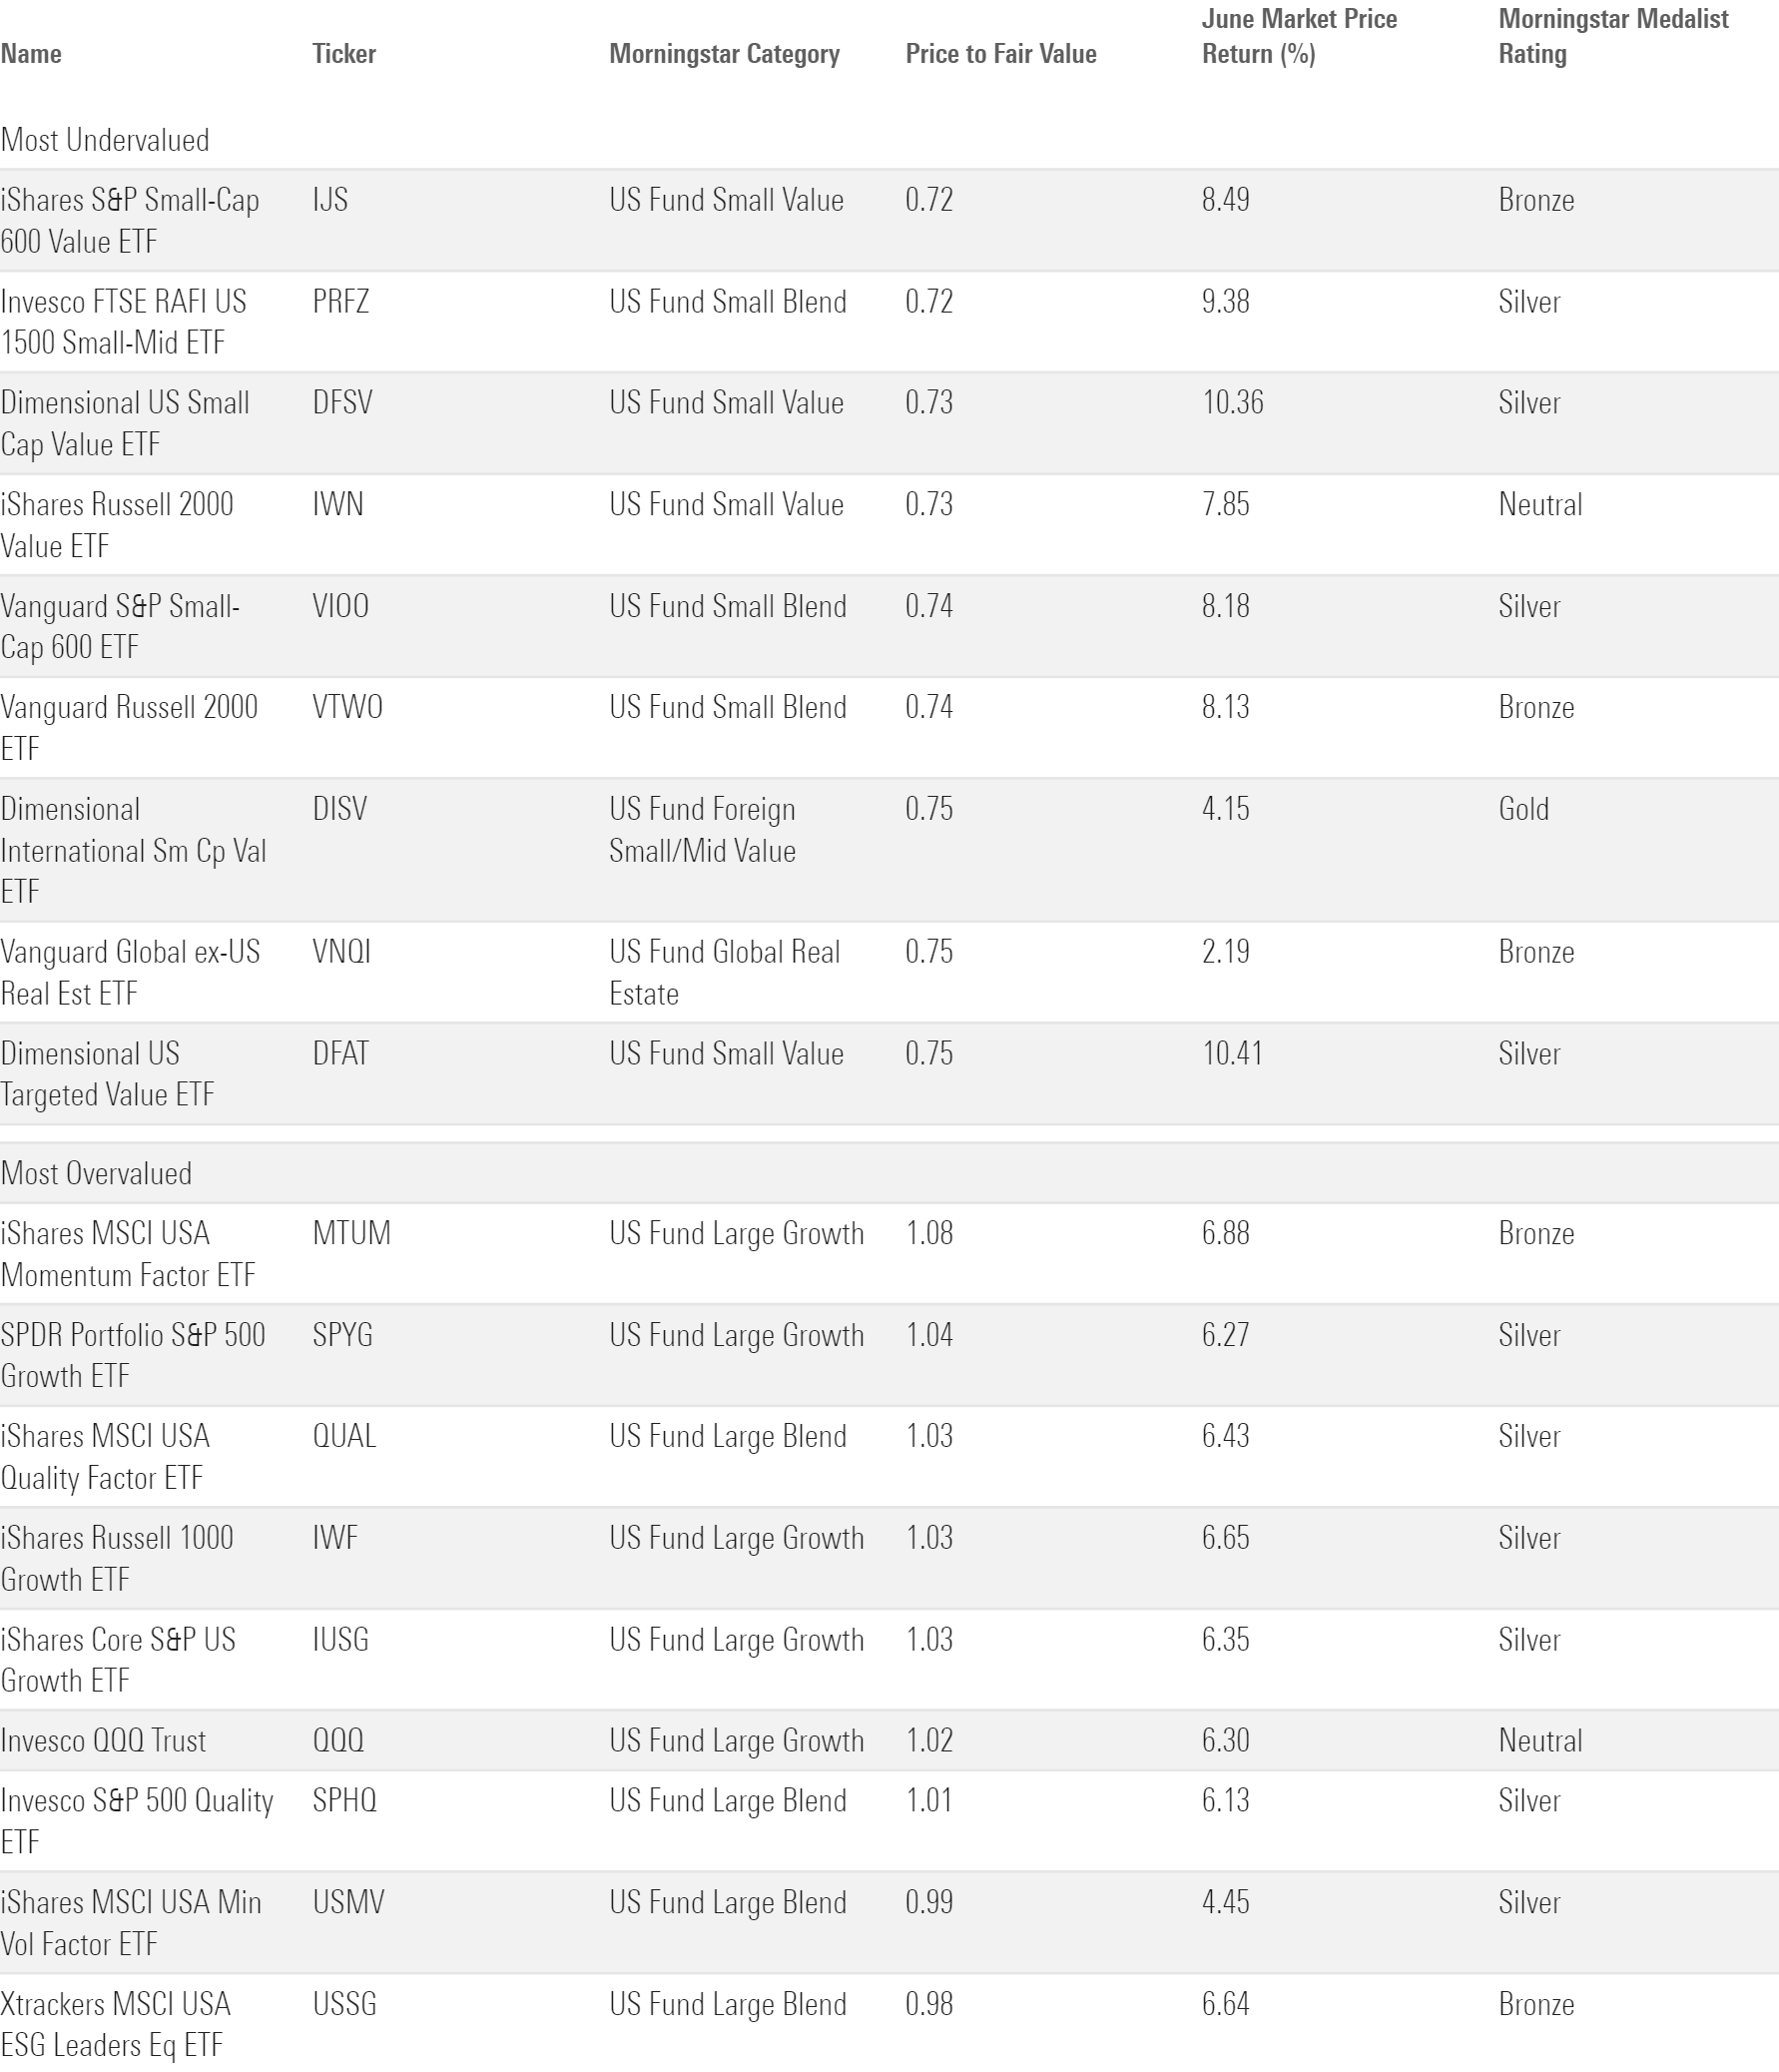
June was small-cap stocks’ best month of 2023, but they still looked undervalued at its conclusion. Small-value funds came at the deepest discount. The six analyst-assigned ETFs in that category traded 26% below their fair value on average. Investors that prefer a broader small-cap portfolio may find Gold-rated Vanguard Small-Cap ETF VB, which earns a Morningstar Medalist Rating of Gold, and its 21% discount to be attractive. Silver-rated Avantis U.S. Small Cap Value ETF AVUV may also be worth a look because it incorporates profitability when selecting stocks. Small caps tend to be more economically sensitive than their larger brethren, a feature that likely drove their underperformance as tighter monetary policy cast a cloud over the economic outlook. But should the economy hold steady, these strategies may be poised to make up ground.
Among the categories that channel the full market-cap spectrum, ETFs in the diversified emerging-markets category offer the deepest discount. IEMG traded 22% below its fair value at 2023′s halfway point. In the case of emerging markets, these discounts often reflect the risks that come with investing in nascent economies or markets. Freedom 100 Emerging Markets ETF FRDM—which targets only emerging markets that score well on a personal and economic freedom score card—traded at a somewhat milder 18% discount. Just because portfolios like IEMG trade at low price multiples doesn’t always mean they’re a great deal.
Only seven of 155 analyst-assigned ETFs traded above their fair value estimate as of June 30, 2023. The growth strategies that sported a ratio over 1.00 have posted terrific performance. IShares Russell 1000 Growth ETF IWF traded 3% above its fair value and gained 28.9% in the first half, for example. One richly valued fund that hasn’t been up to snuff was iShares MSCI USA Momentum ETF MTUM. This strategy started the year chock-full of the energy and utilities firms that led the 2022 market, leaving it mostly devoid of red-hot tech stocks until it rebalanced into them in May 2023. Time will tell whether its recent portfolio shakeup will pay off or once again be a step too late.
The author or authors do not own shares in any securities mentioned in this article. Find out about Morningstar’s editorial policies.
/cloudfront-us-east-1.images.arcpublishing.com/morningstar/24UPFK5OBNANLM2B55TIWIK2S4.png)
/d10o6nnig0wrdw.cloudfront.net/04-25-2024/t_29c382728cbc4bf2aaef646d1589a188_name_file_960x540_1600_v4_.jpg)
/cloudfront-us-east-1.images.arcpublishing.com/morningstar/T2LGZCEHBZBJJPPKHO7Y4EEKSM.png)
:quality(80)/s3.amazonaws.com/arc-authors/morningstar/30e2fda6-bf21-4e54-9e50-831a2bcccd80.jpg)