
5 ESG Funds That Rebounded in 2023
Vanguard, iShares, and Fidelity are among the year’s top sustainable fund performers.
/s3.amazonaws.com/arc-authors/morningstar/4295f84a-d866-4f43-8205-3fb777ae9f55.jpg)

Returns for U.S. sustainable funds have rebounded this year from 2022′s lows. The median sustainable large-blend equity fund gained 18.2% in the first 11 months of 2023, roughly matching the returns of conventional large-blend equity funds but lagging the best-fit benchmark, the Morningstar US Large-Mid Cap Index, which rose 21.1% over the period.
The Fabulous Five
Here are the year’s winners through Nov. 30:
The 5 Top-Performing Sustainable Funds in 2023
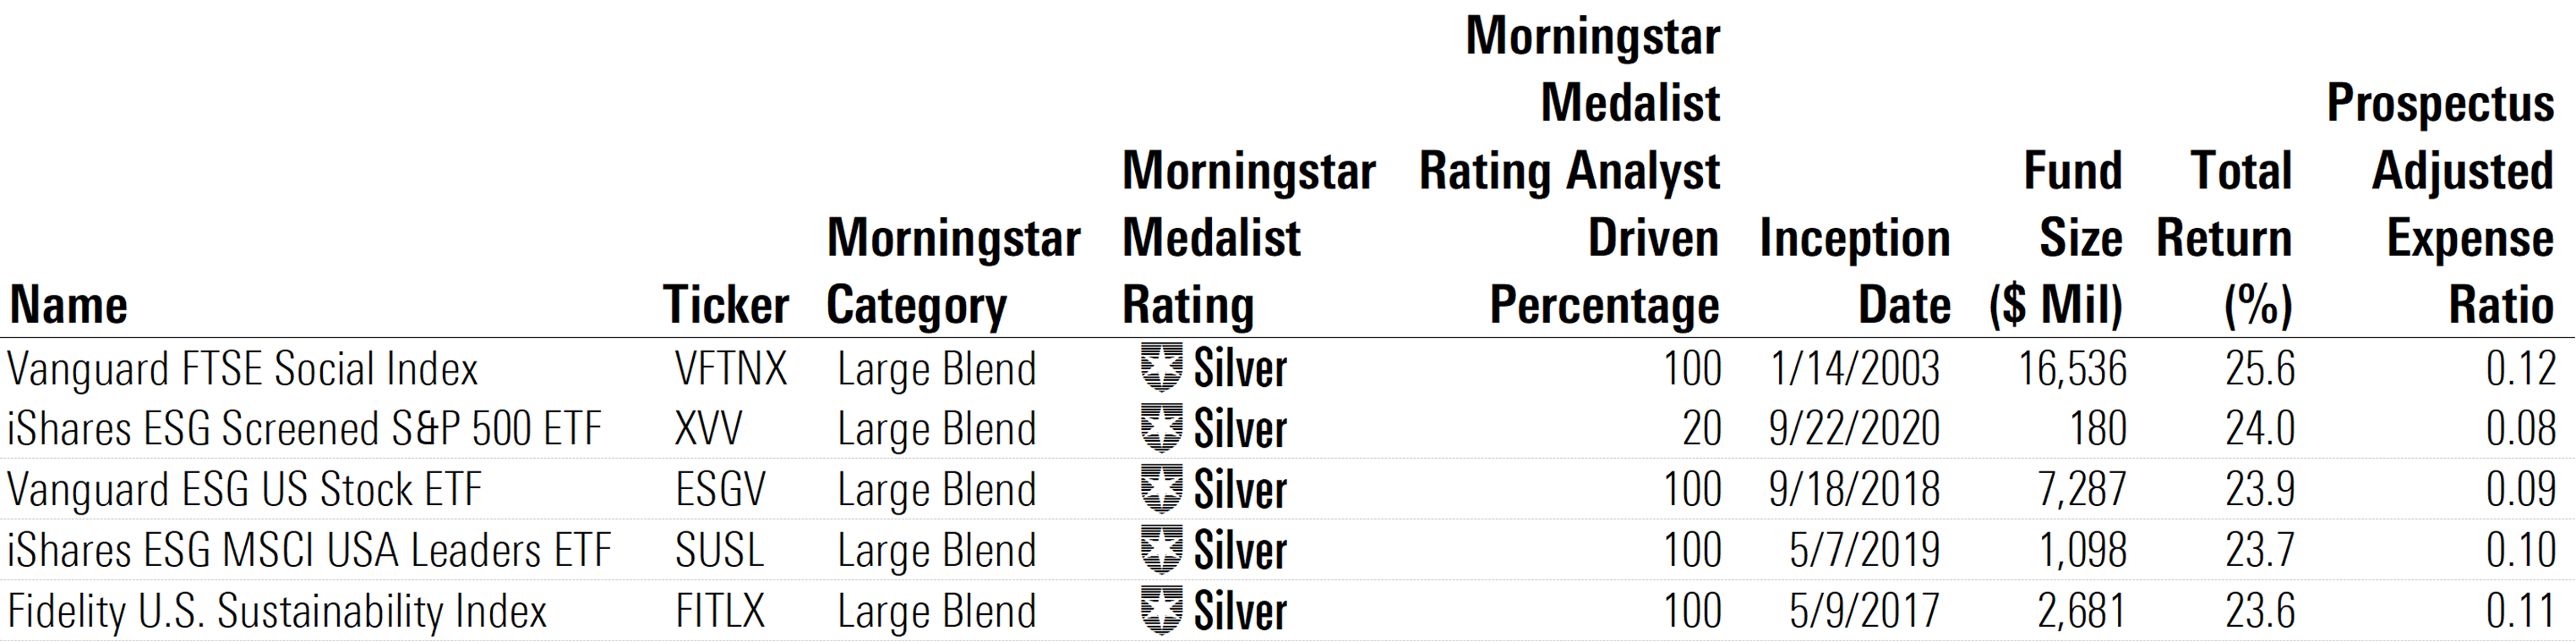
Each of the five funds highlighted in this article earns a Morningstar Medalist Rating of Silver. The Medalist Rating uses both qualitative insights and quantitative measures to indicate a strategy’s likelihood of outperforming its respective Morningstar Category index and/or peers.
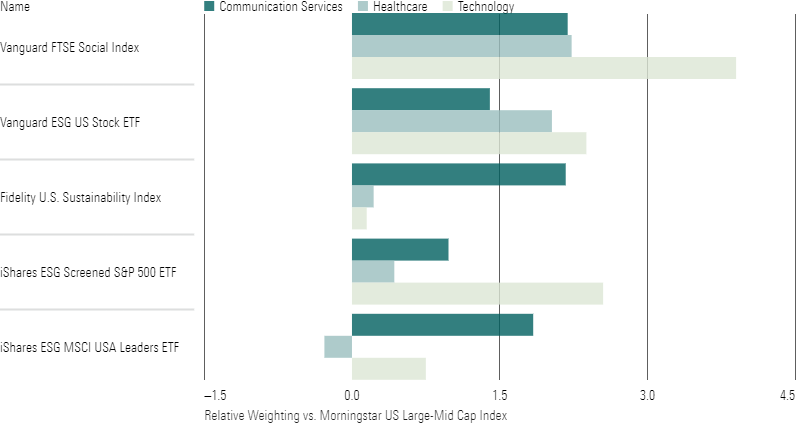
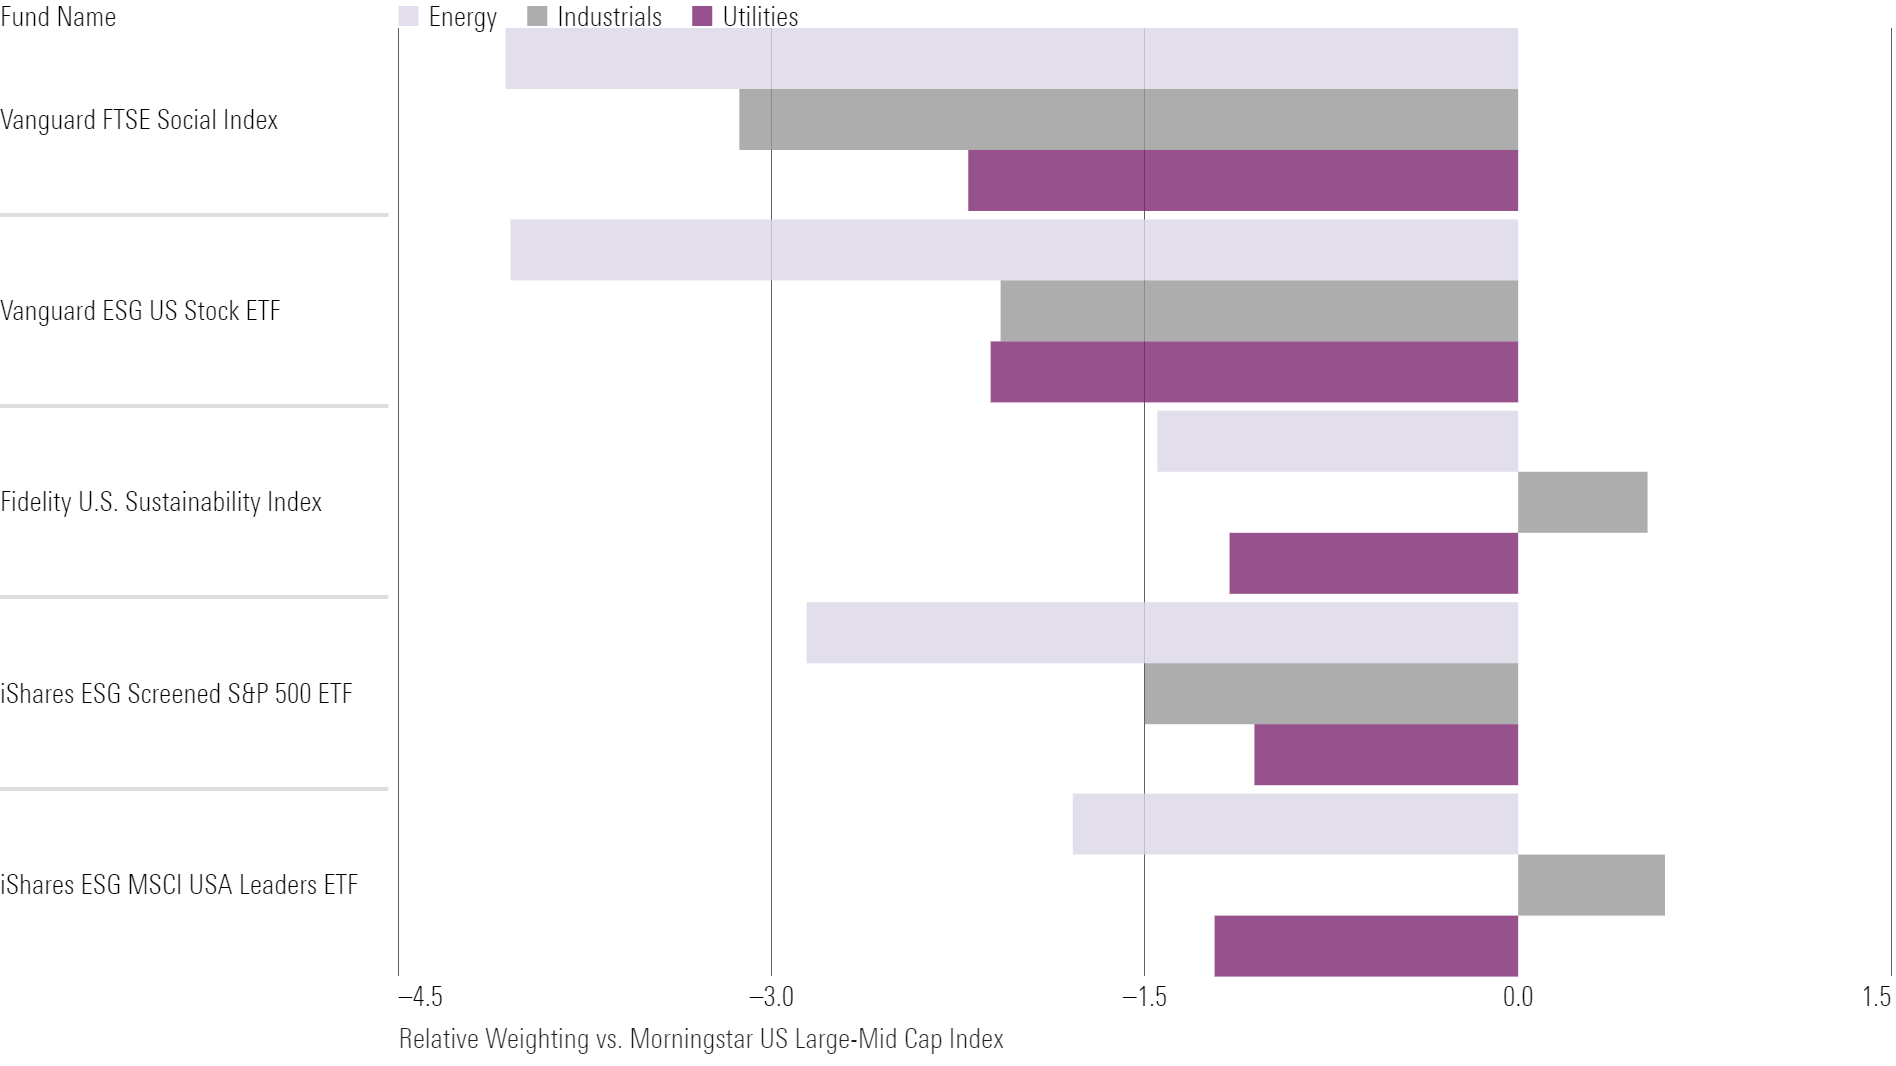
The five are all broadly diversified market-cap-weighted index funds. Their environmental, social, and governance mandates drive some portfolio differences versus the parent index, which in turn results in performance deviations. Some of the biggest drivers for these funds in 2023 were overweightings in the technology sector and underweightings in the energy and utilities sectors. Technology clobbered all other sectors for the year through November, climbing more than 50%.
Tech and Energy Stocks Continue to Play Large Roles
Two offerings from Vanguard landed among the top performers: Vanguard FTSE Social Index VFTNX and Vanguard ESG U.S. Stock ETF ESGV. They returned 25.6% and 23.9%, respectively, handily beating the Morningstar US Large-Mid Cap benchmark. For both funds, the strongest drivers of outperformance in 2023 were their near-zero exposure to the energy sector and sizable overweightings in the technology sector relative to the benchmark. Some of the top contributors were Apple AAPL, Microsoft MSFT, and Nvidia NVDA. All three holdings carry Sustainalytics ESG Risk Ratings of Low. For example, Nvidia, a multinational semiconductor company, ranks toward the top of its peer group because of its strong management of material ESG issues such as business ethics, or risks related to anticorruption or anticompetitive behavior, and human capital, or the company’s ability to attract and retain talent.
Most Common Sector Overweightings vs. the Morningstar US Large-Mid Cap Index
Fidelity U.S. Sustainability Index FITLX bested our best-fit benchmark by 2.5 percentage points, but its portfolio makeup looks a little different. After screening out firms involved in controversial businesses such as nuclear and small arms, the fund ranks companies on ESG metrics and adds top-ranking names to achieve a similar sector profile as its benchmark, the MSCI USA ESG Leaders Index.
According to analyst Lan Anh Tran, “Many industry giants, such as Apple, Amazon.com AMZN, and Berkshire Hathaway BRK.B, do not rank highly on MSCI’s ESG metrics and are consequently excluded from this fund’s methodology. [Following application of the ESG criteria], market-cap-weighting will tilt the fund’s assets toward remaining mega-cap stocks. This can lead to significant concentration in its top holdings. For example, its largest constituent Microsoft has consistently accounted for between 7% and 11% of the portfolio over the past few years and has contributed to the fund’s outperformance.”
Microsoft earns a Low ESG Risk Rating on account of its strong management of data privacy and security risks, including cyberattacks, as it increases its cloud-based offerings.
Most Common Sector Underweightings vs. the Morningstar US Large-Mid Cap Index
A few large positions in market-leading companies have driven iShares ESG MSCI USA Leaders ETF SUSL‘s outperformance so far in 2023. The fund’s 23.7% return beat the Morningstar US Large-Mid Cap Index by 2.6 percentage points. The portfolio’s exposure to Nvidia, Microsoft, and Adobe ADBE—which are up 220%, 59%, and 81% respectively—was nearly double that of the index, driving strong relative returns.
The other iShares offering on the list—iShares ESG Screened S&P 500 XVV—trounced our best-fit benchmark by 2.9 percentage points with a 24.0% gain. Once again, its 3.2% underweighting to energy stocks, along with a 2.8% overweighting to the technology sector were the primary drivers of the fund’s success.
ESG Investing Performance Over the Long Term
Despite recent performance challenges, sustainable funds outpaced conventional peers and a traditional benchmark in previous years.
Large-Blend Funds' Annual Returns vs. the Morningstar US Large-Mid Cap Index
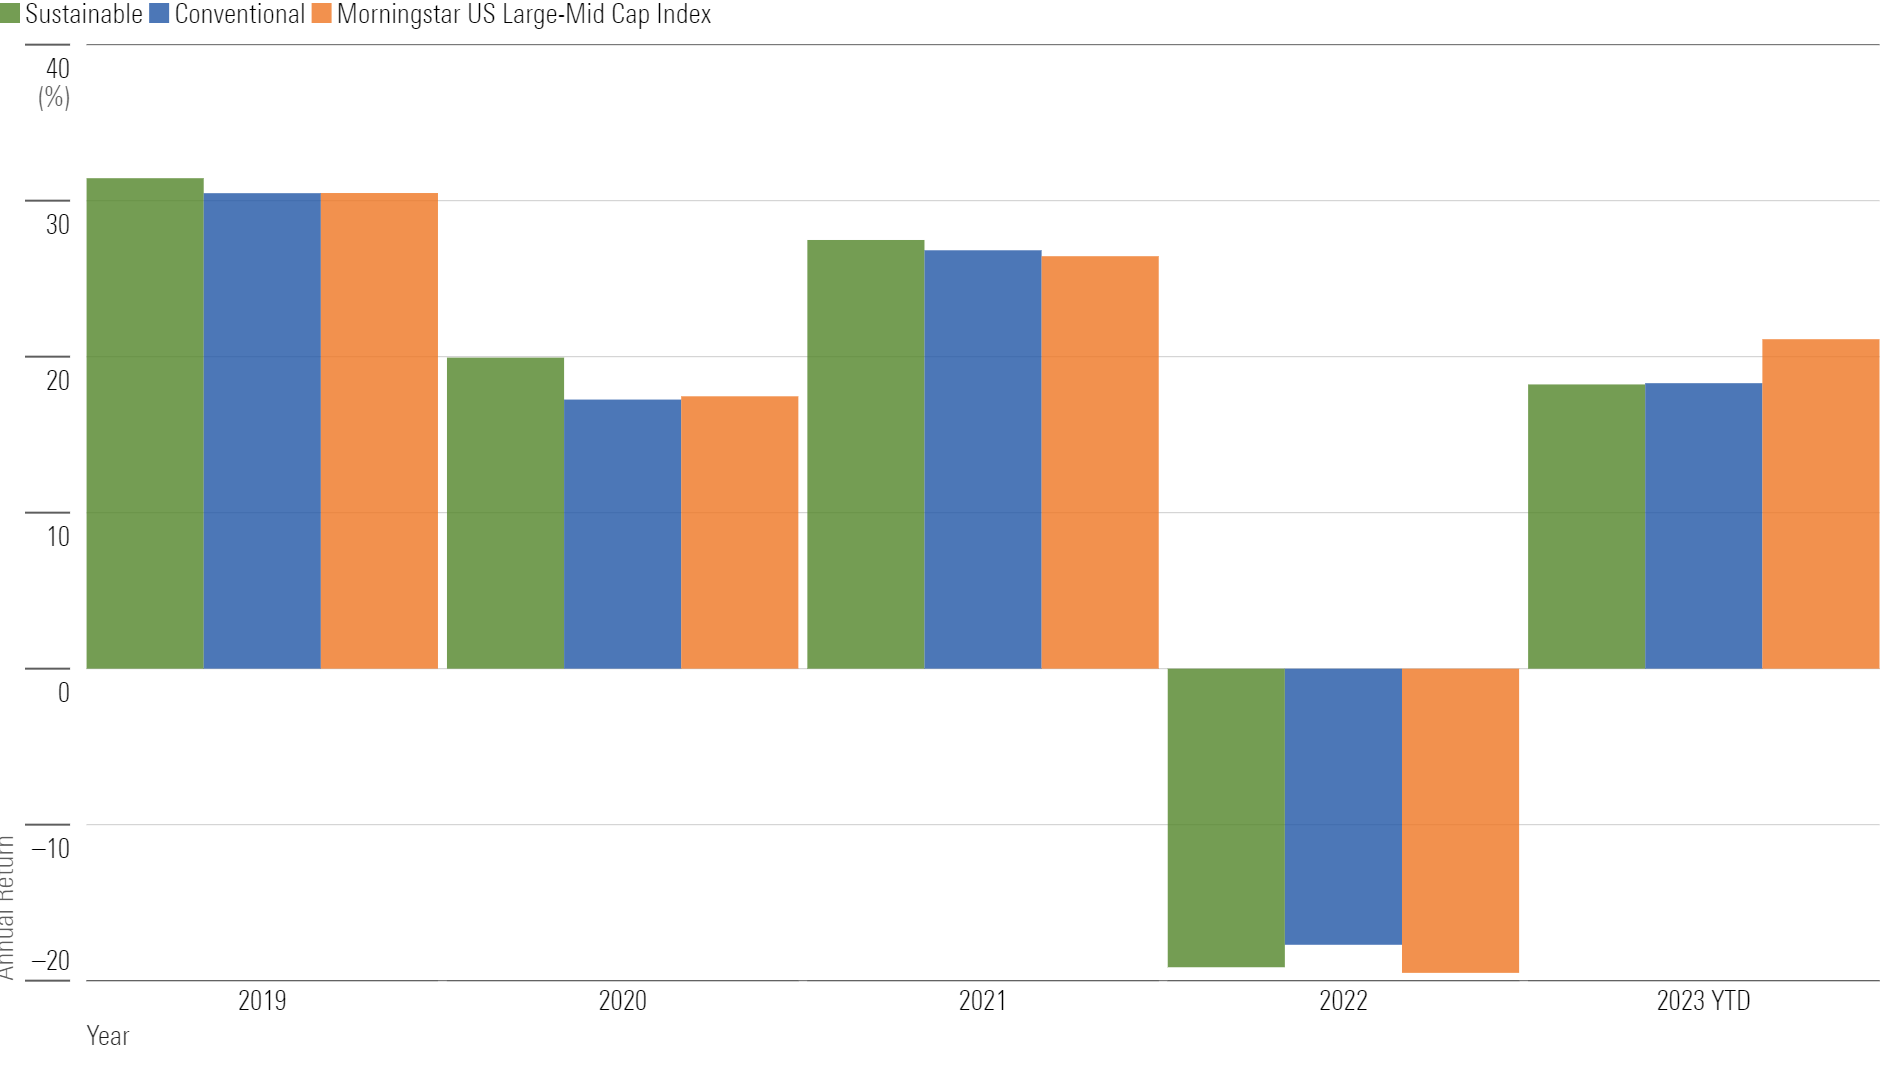
Most of the funds in our sample inherit performance drivers from their respective parent indexes. However, when ESG-friendly sectors and stocks with low levels of ESG risk do well, the funds’ ESG tilts are rewarded, and vice versa. The energy rally drove many conventional funds’ returns in 2022, so sustainable funds’ general underweighting in the energy sector weighed on their returns relative to the benchmark and peers.
By contrast, in 2021, 2020, and 2019, sustainable funds were the place to be. The funds’ sector profiles and bias toward growth stocks worked well in the early years of the COVID-19 pandemic, known as the golden years for technology. According to Tran, funds like iShares ESG MSCI USA Leaders ETF and Fidelity U.S. Sustainability Index piled into major winners such as Tesla TSLA and Alphabet GOOGL, which led the markets in 2020 and 2021. However, those same exposures weighed on returns in 2022 as market trends reversed. When it comes to 2022, any fund that finished the year with positive returns accomplished a significant feat.
More importantly, when looking across a longer horizon, the U.S. sustainable funds landscape posed encouraging results. Over the past five years, the performance of sustainable funds has largely resembled or been better than conventional peers on an annual basis. And in terms of trailing returns, three of the five sustainable funds discussed here—iShares ESG MSCI USA Leaders ETF, iShares ESG Screened S&P 500 ETF, and Fidelity U.S. Sustainability Index—beat the Morningstar US Large-Mid Cap Index over the past three years annualized.
Sustainable funds won’t always outperform peers and benchmarks, but they won’t always underperform, either. As with any other investment strategy, it is important to remember that sustainable funds come in all shapes and sizes and will perform according to their respective approaches.
The author or authors do not own shares in any securities mentioned in this article. Find out about Morningstar’s editorial policies.
/cloudfront-us-east-1.images.arcpublishing.com/morningstar/NNGJ3G4COBBN5NSKSKMWOVYSMA.png)
/cloudfront-us-east-1.images.arcpublishing.com/morningstar/6BCTH5O2DVGYHBA4UDPCFNXA7M.png)
/cloudfront-us-east-1.images.arcpublishing.com/morningstar/EBTIDAIWWBBUZKXEEGCDYHQFDU.png)
:quality(80)/s3.amazonaws.com/arc-authors/morningstar/4295f84a-d866-4f43-8205-3fb777ae9f55.jpg)