
13 Charts On the Q1 Stock Rally That Just Wouldn’t Quit
Stocks soared even as rate cuts drifted further away.


The bull market rolled on for stocks in the first quarter, with returns buoyed by strong earnings and seemingly endless investor appetite for names that are seen to benefit from the nascent artificial intelligence boom.
The Morningstar US Market Index rose 10.2% in the first quarter and 29.8% in the last 12 months. This strong performance came despite many factors that could have caused stock prices to fall. Most significant were stubbornly high readings on inflation, which pushed back and reduced expectations for Federal Reserve interest rate cuts. Bond markets started 2024 predicting five rate cuts beginning in March, but now traders are betting on three cuts, with the first coming in June.
The rally also came despite fears that valuations are beginning to look frothy and that its gains have been too narrowly concentrated in just a handful of stocks. Continued big gains at tech mega-caps like Nvidia NVDA, Microsoft MSFT, and Meta Platforms META were key to the stock market’s resilient performance. During the first quarter, Nvidia’s stock rose by 82%, Microsoft went up 12%, and Meta gained 37%.
It wasn’t all big tech, however. Value stocks gained 8.4% in the quarter, narrowly beating out growth stocks.
While the stock market was able to weather the diminished expectations for Fed rate cuts, the higher-for-longer landscape took the wind out of the bond market’s sails. After a huge rally in the fourth quarter, bond prices fell and yields rose. The Morningstar US Core Bond Index is down 0.8% for the quarter.
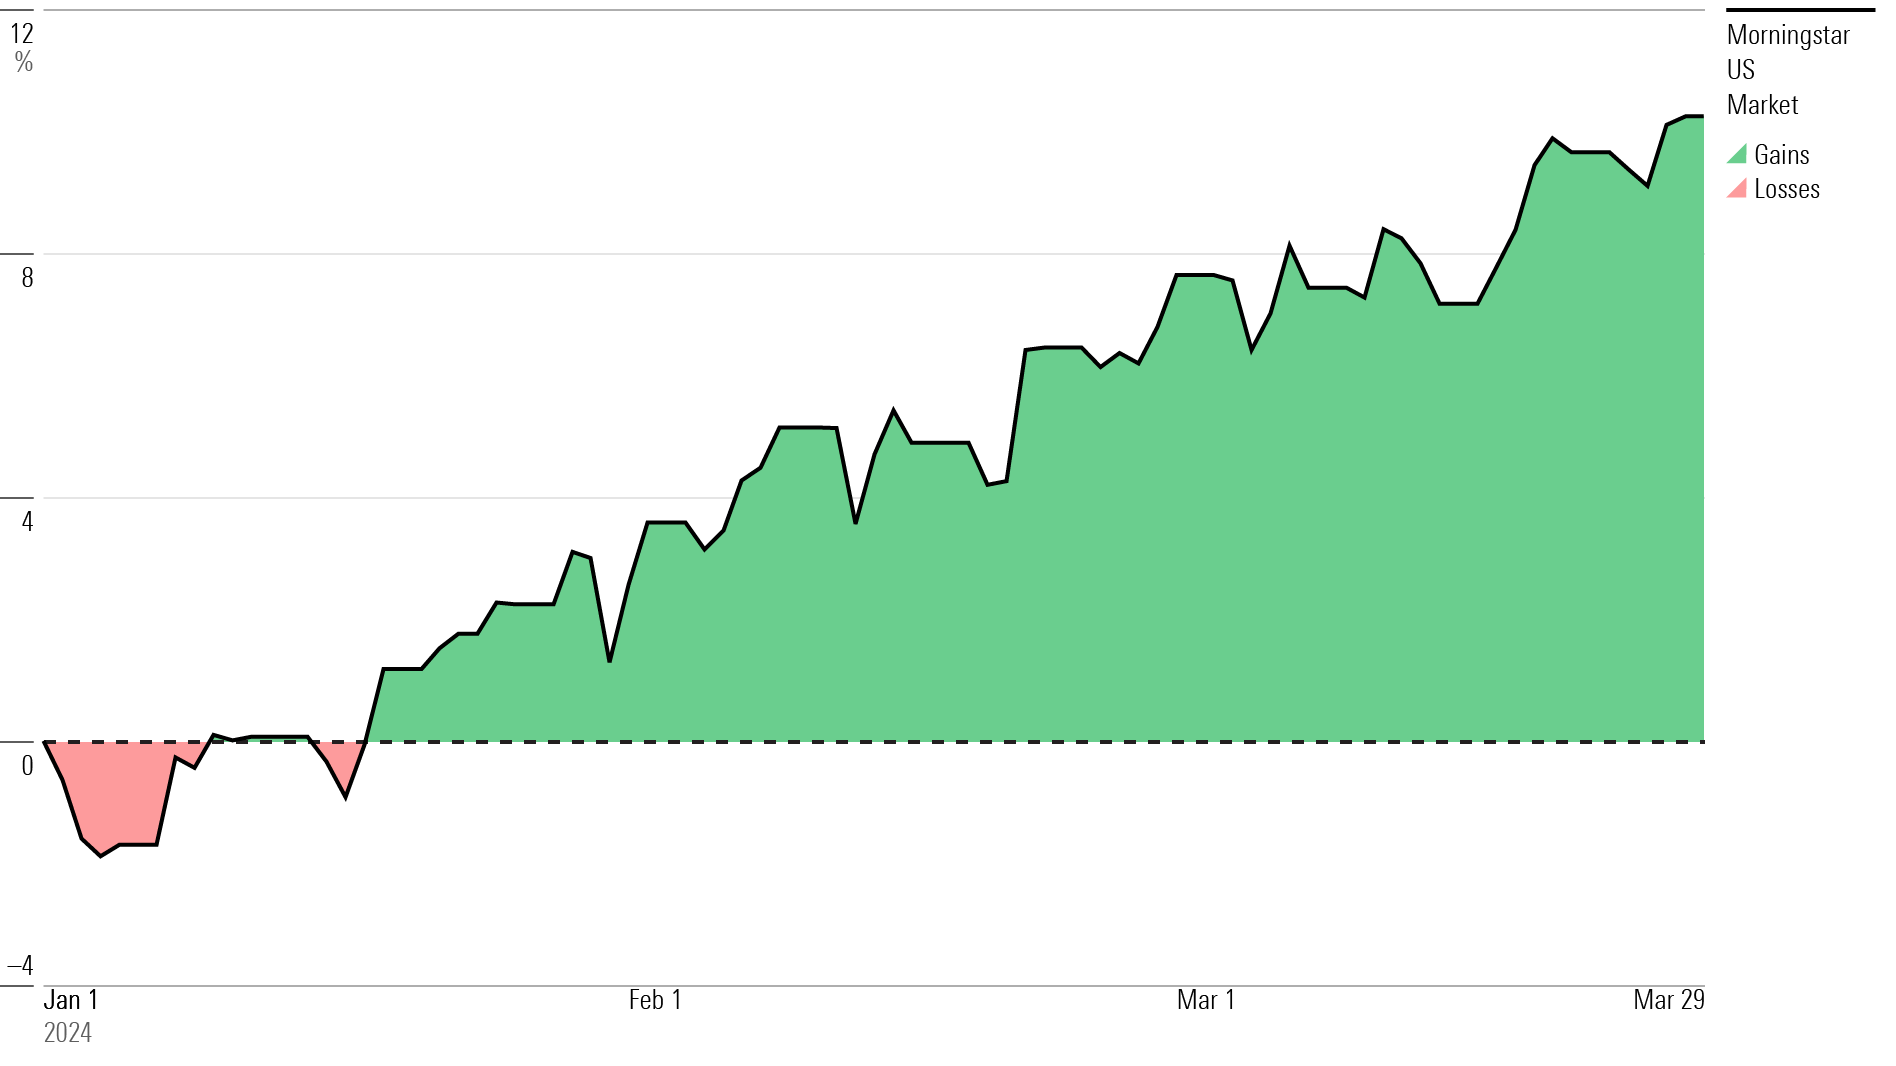
US Stock Market Performance
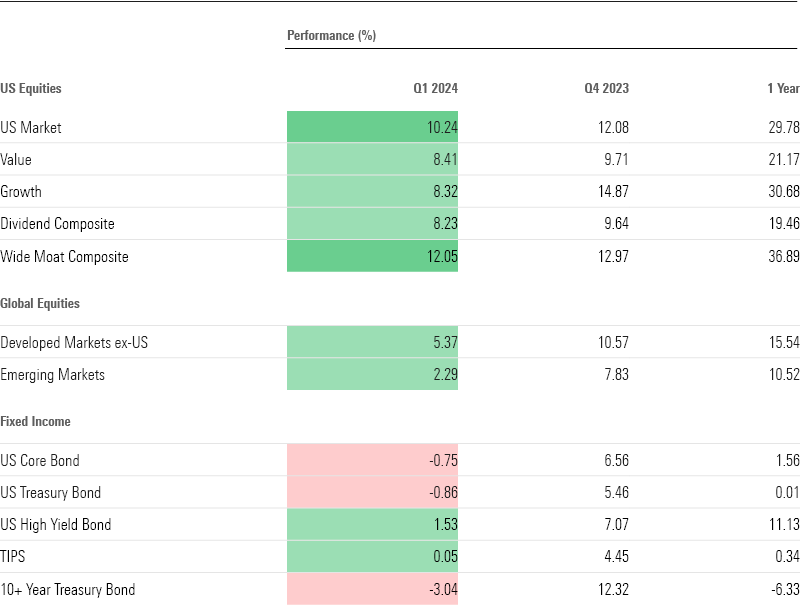
Key Stats: Q1 2024 Stock and Bond Market Performance
- The US Market Index gained 10.2% during the first quarter after stumbling in the first weeks of January. Stocks have more than made up for their losses during the 2022 bear market.
- Value stocks narrowly beat growth stocks.
- Big tech stocks continued to drive market gains, with the US Technology Index up 13.1%. Energy stocks recovered from a tough fourth quarter, while real estate stocks floundered.
- Bonds fell in the first quarter, with the US Core Bond Index down 0.8%.
- Dividend stocks continue to lag the broader market, trailing by 2 percentage points, but they performed better than in previous quarters.
- The Fed kept interest rates steady. Bond futures markets expect the first rate cut to come in June.
- Bond yields ticked up and prices fell, with the largest losses coming from long-term bonds. Investors found price appreciation in high-yield bonds and leveraged loans.
- The yield curve remained inverted.
- Oil prices rose amid geopolitical uncertainties, putting extra upward pressure on inflation.
- The approval of the exchange-traded funds that can own bitcoin spurred an enormous rally in the most popular cryptocurrency. Bitcoin hit a new all-time high and notched gains of more than 60% in the first quarter.
Quarterly Market Performance Barometer
Stock Market Performance
The US stock market climbed 10.2% between January and March—its best first quarter since 2019.
After stumbling in the early days of the new year, stocks officially erased all their losses from the bear market of 2022 when the US Market Index hit a new record on Jan. 24. A slew of new highs followed as the index continued to climb despite unexpectedly strong inflation prints in January and February. Stocks are now 29% above their October 2023 lows.
A handful of mega-cap tech stocks continue to lead the market, though the returns of the so-called “Magnificent Seven”—Nvidia, Tesla TSLA, Meta, Apple AAPL, Amazon.com AMZN, Microsoft, and Alphabet GOOGL/GOOG—are now significantly more dispersed, with Nvidia and Meta leading the way and Tesla and Apple lagging.
AI darling Nvidia continues to astound market watchers. Shares climbed 82% in the first quarter, and the firm contributed 21% of the market’s gain on its own. Other big contributors were Microsoft, Meta, and Amazon.
The Wide Moat Composite Index returned more than 12% for the quarter. Wide-moat stocks are believed to have long-lasting competitive advantages over their peers. The index’s outperformance mirrored that of the broader market—its top holdings are Microsoft, Apple, Nvidia, Amazon, Meta, and Alphabet.
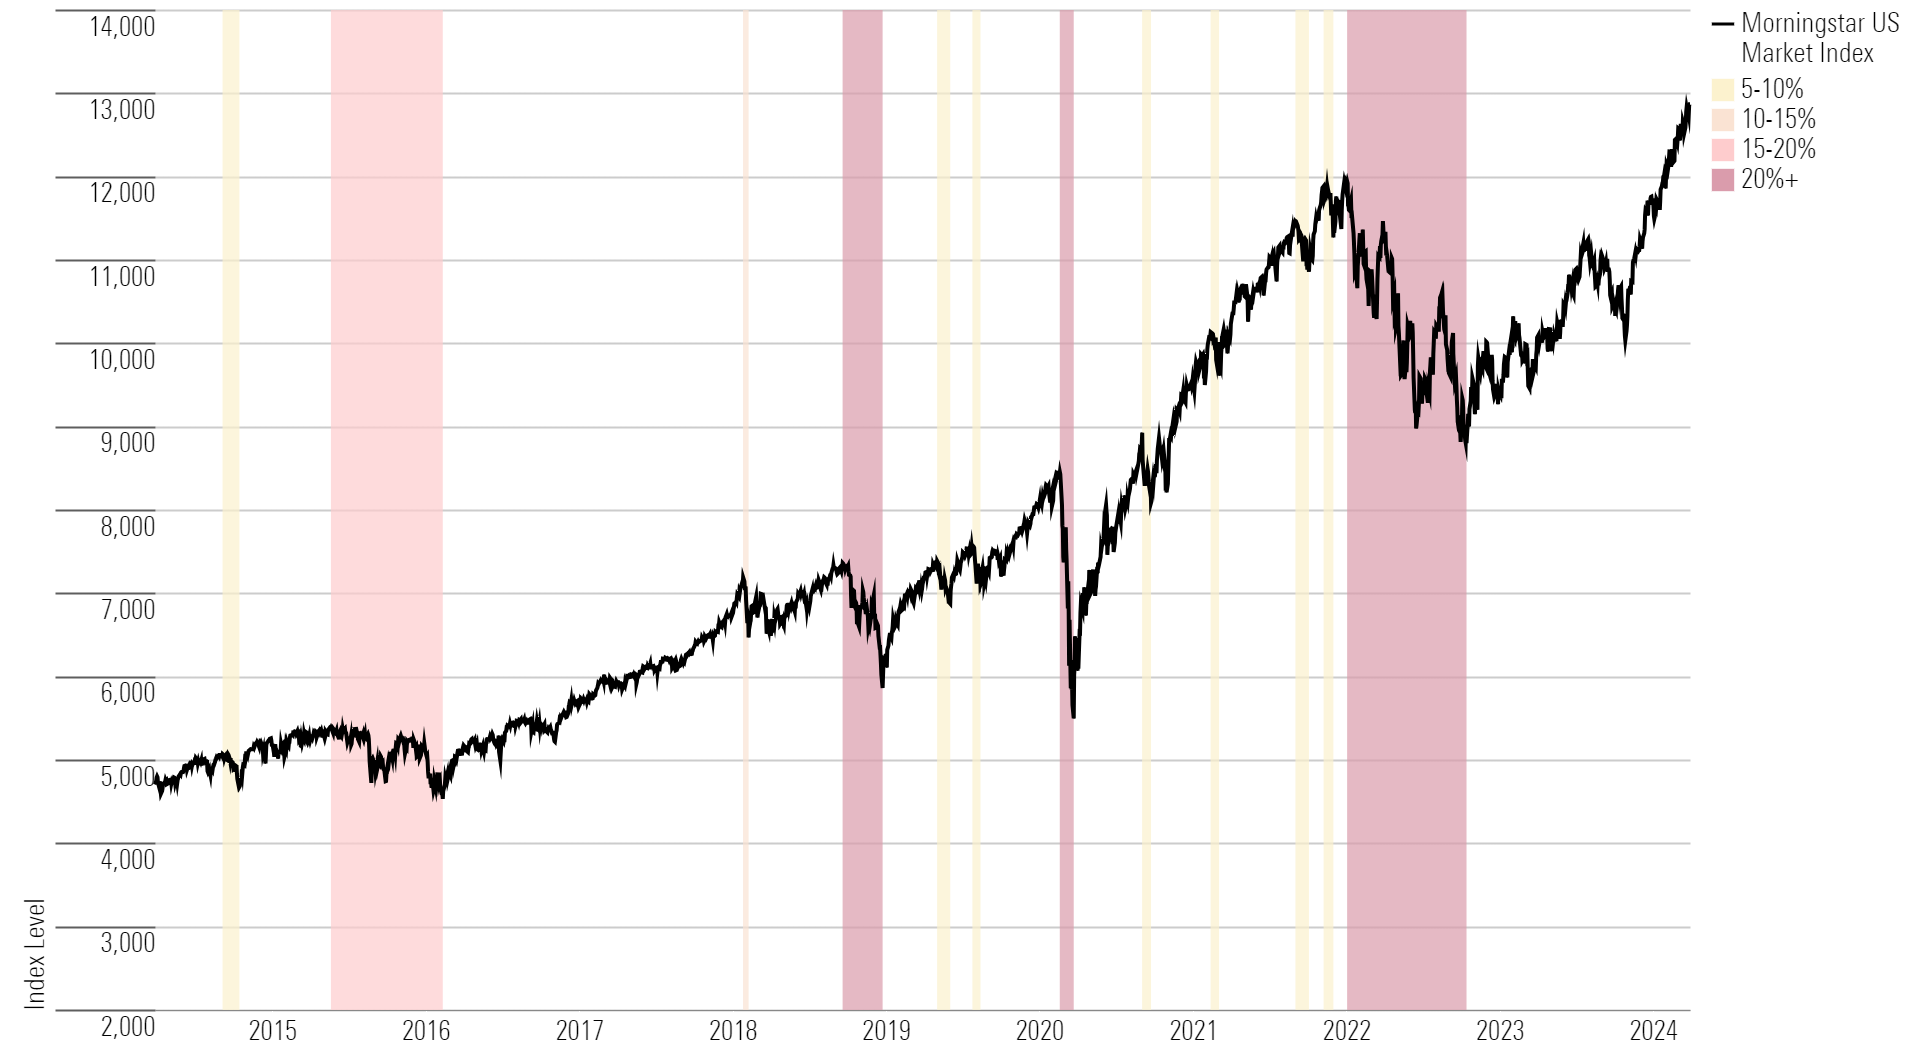
Stock Market Pullbacks
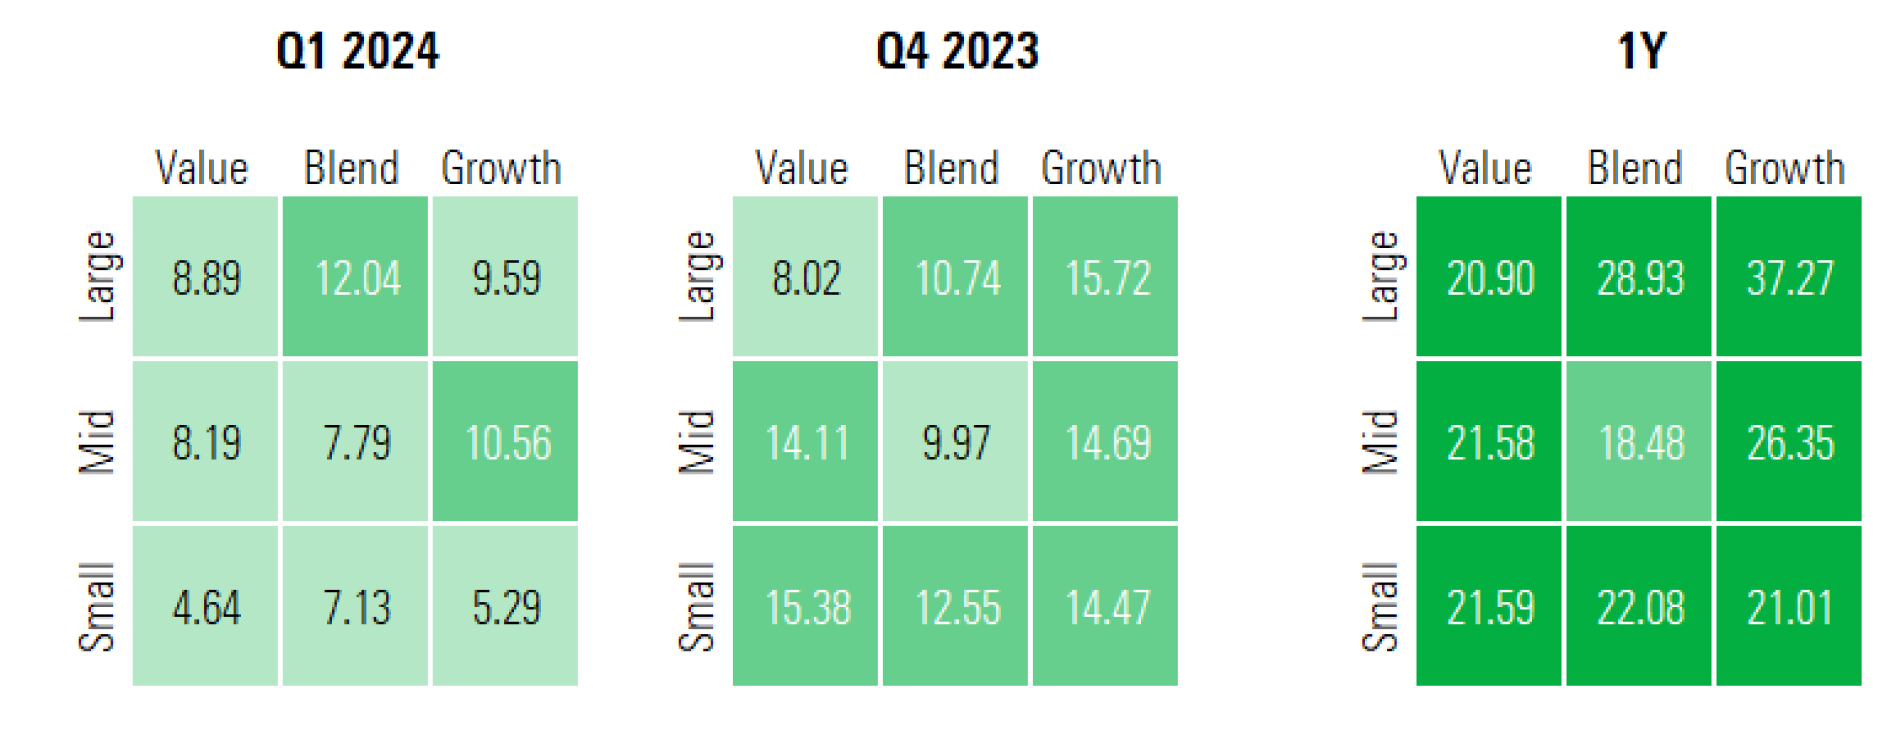
Value Stock vs. Growth Stock Performance
Value stocks narrowly beat growth stocks in the first quarter, with the US Value Index outperforming the US Growth Index by about a tenth of a percentage point at the quarter’s end. Many of the gains in the value category were thanks to financial services and energy stocks.
The stock market continued to climb in every sector of the style box. Though advances were again smaller than last quarter’s in most categories, large-blend stocks led the way with gains of 12%, while midcap growth stocks were close behind with gains of 10.7%.
Small-value stocks notched the smallest gains, unable to keep up with their larger, growthier peers. Over the past year, every sector of the style box is well into the green.
US Equity Style Box Performance
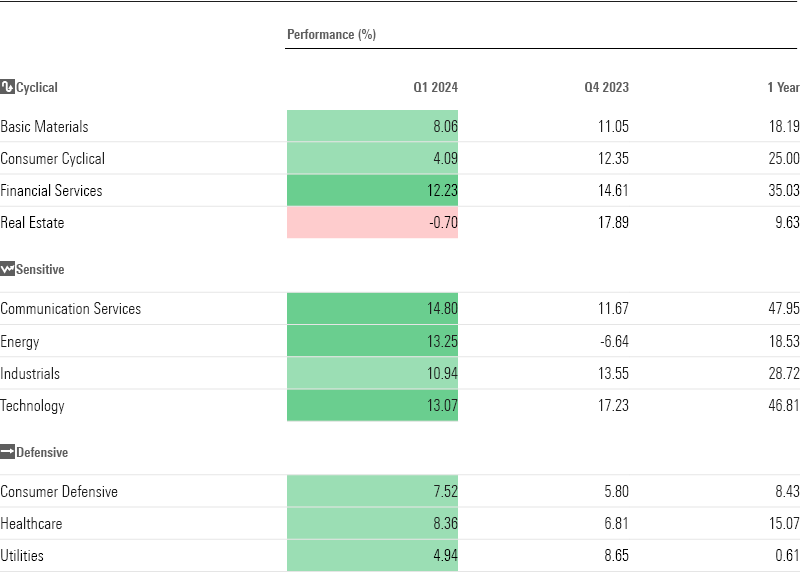
Stock leadership for the overall rally continued to spring from the communications services and technology sectors. Communications services, which include Meta and Alphabet, gained 14.8%. The tech sector, home to Nvidia and Microsoft, rose 13.1%. Overall, rate-sensitive sectors like these, energy, and industrials drove the biggest gains in the market.
Real estate stocks slumped 0.7% as interest rates remained high. That marked a major reversal from the fourth quarter, when these stocks saw gains of nearly 18%. A landmark settlement involving the National Association of Realtors, which could change how brokers are paid, weighed on share prices in March. Over the past year, however, real estate stocks are still up 9.6%.
Energy stocks saw a big turnaround too. It was one of the worst-performing sectors in the fourth quarter of 2023, but it came back to life in this quarter as oil prices ticked higher.
Stock Sector Performance
Dividend Stock Performance
Dividend stocks stayed in the green during the first quarter, though they lagged the broader US market, as was the case in 2023. The US Dividend Composite Index ended the quarter up 8.2%. The US Dividend Growth Index and the US Dividend Leaders Index saw gains of 8.5% and 8.3%, respectively.
Two major tech stocks made headlines by announcing their first-ever dividend payments. Meta stunned markets in early February with a dividend announcement that accompanied blowout earnings, sending the stock up more than 20% in a single day. Software giant Salesforce CRM also announced a dividend that month. Investors reacted positively, but it’s worth noting that the dividend yield on both stocks will likely be lower than that of the overall market.
“With both companies, the dividend rate is relatively small,” David Harrell, editor of Morningstar’s Dividend Investor newsletter, recently said. “I don’t think that either of these stocks are now going to be considered by most investors as a ‘dividend stock.’”
Morningstar Dividend Indexes vs. the US Market

Markets Push Rate Cut Expectations From March to June
Over the past few months, the biggest question mark in markets has been the path of interest rates in the wake of one of the most aggressive monetary tightening cycles in history. The current federal-funds target rate range of 5.25%-5.50% is the highest it’s been since before the 2008 financial crisis.
Investors have been eagerly awaiting confirmation of when rates are likely to fall, and by how much. In January, markets were confident that the Fed had all but beaten inflation and would start cutting rates in March. Traders were anticipating six cuts in 2024 that would bring the target rate range to 3.75%-4.00%.
But consecutive hot Consumer Price Index reports in January and February and a more hawkish tone from the central bankers told a different story. By the end of February, bond market futures shifted dramatically to predict that the first cut will come in June, according to the CME FedWatch tool.
Treasury Yield and Federal-Funds Rate
Q1 2024 Bond Market Performance
After snapping a two-year losing streak in 2023, the bond market stumbled at the beginning of 2024, with prices dropping amid changing expectations for the Fed. Benchmark yields have been steadily ticking higher, with the 10-year US Treasury note notching a new year-to-date high of 4.33% at the end of March.
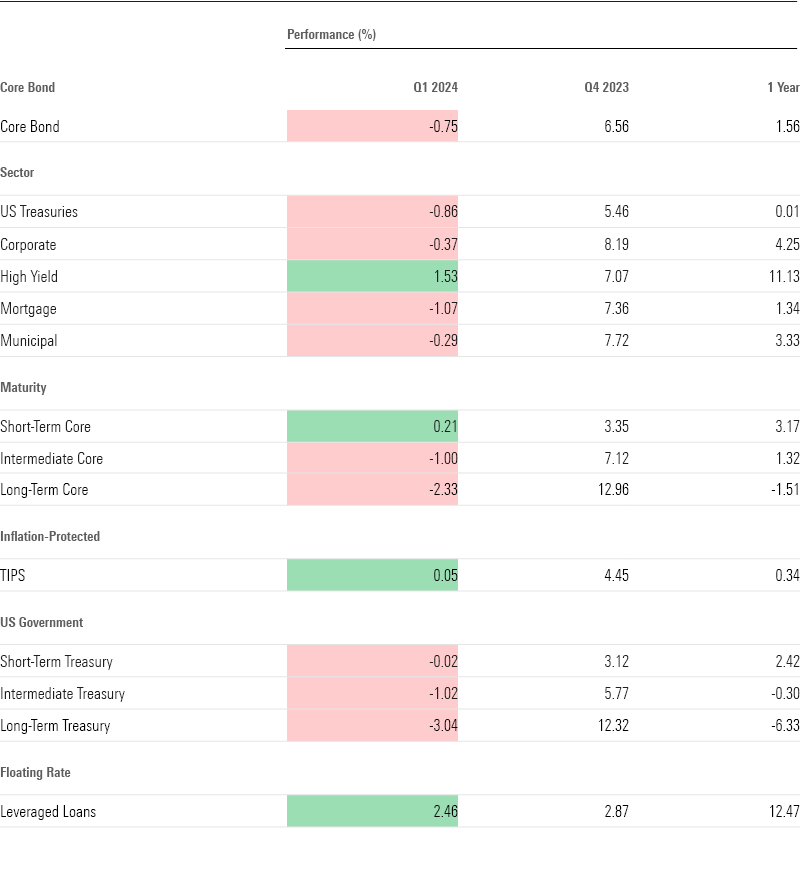
The Core Bond Index ended the first quarter down 0.8%, while US Treasury bonds overall dropped 0.9%.
The biggest losses came in long-term bonds, which tend to be most sensitive to changes in interest rates. The Long-Term Treasury Bond Index fell 3% in the first quarter, which reversed some of the index’s 12% gain in the previous quarter. Meanwhile, the Long-Term Core Bond Index dropped 2.3%. Bonds with shorter maturities performed slightly better, with the Short-Term Core Bond Index eking its way into the green for the quarter with a gain of 0.2%.
But it wasn’t all bad news for fixed income. Investors found pockets of price appreciation in high-yield bonds, which tend to be lower quality and riskier than government-backed or investment-grade assets or leveraged loans. The High-Yield Bond Index gained 1.5% in Q1, while the LSTA US Leveraged Loan Index ended the quarter up 2.5%.
Morningstar Bond Indexes
The Treasury Yield Curve Is Still Inverted
The yield curve has now been inverted for the better part of six consecutive quarters. An inverted yield curve happens when yields on short-term Treasuries exceed those on long-term Treasuries. It’s a sign that investors are pessimistic about the economy’s prospects, and it’s generally seen as a precursor to a recession.
This economic cycle is unusual in how long the curve has remained inverted without an economic downturn materializing. But an inverted yield curve does not always lead to a recession, and continued signs of economic strength have convinced many market watchers that a soft landing is on the horizon or already underway.
The magnitude of the inversion—a 0.39-percentage-point spread between the 10-year and the 2-year at quarter end—hasn’t changed much over the past year, despite elevated volatility in the bond market.
US Treasury Yield Curves
Stock and Bond Market Volatility
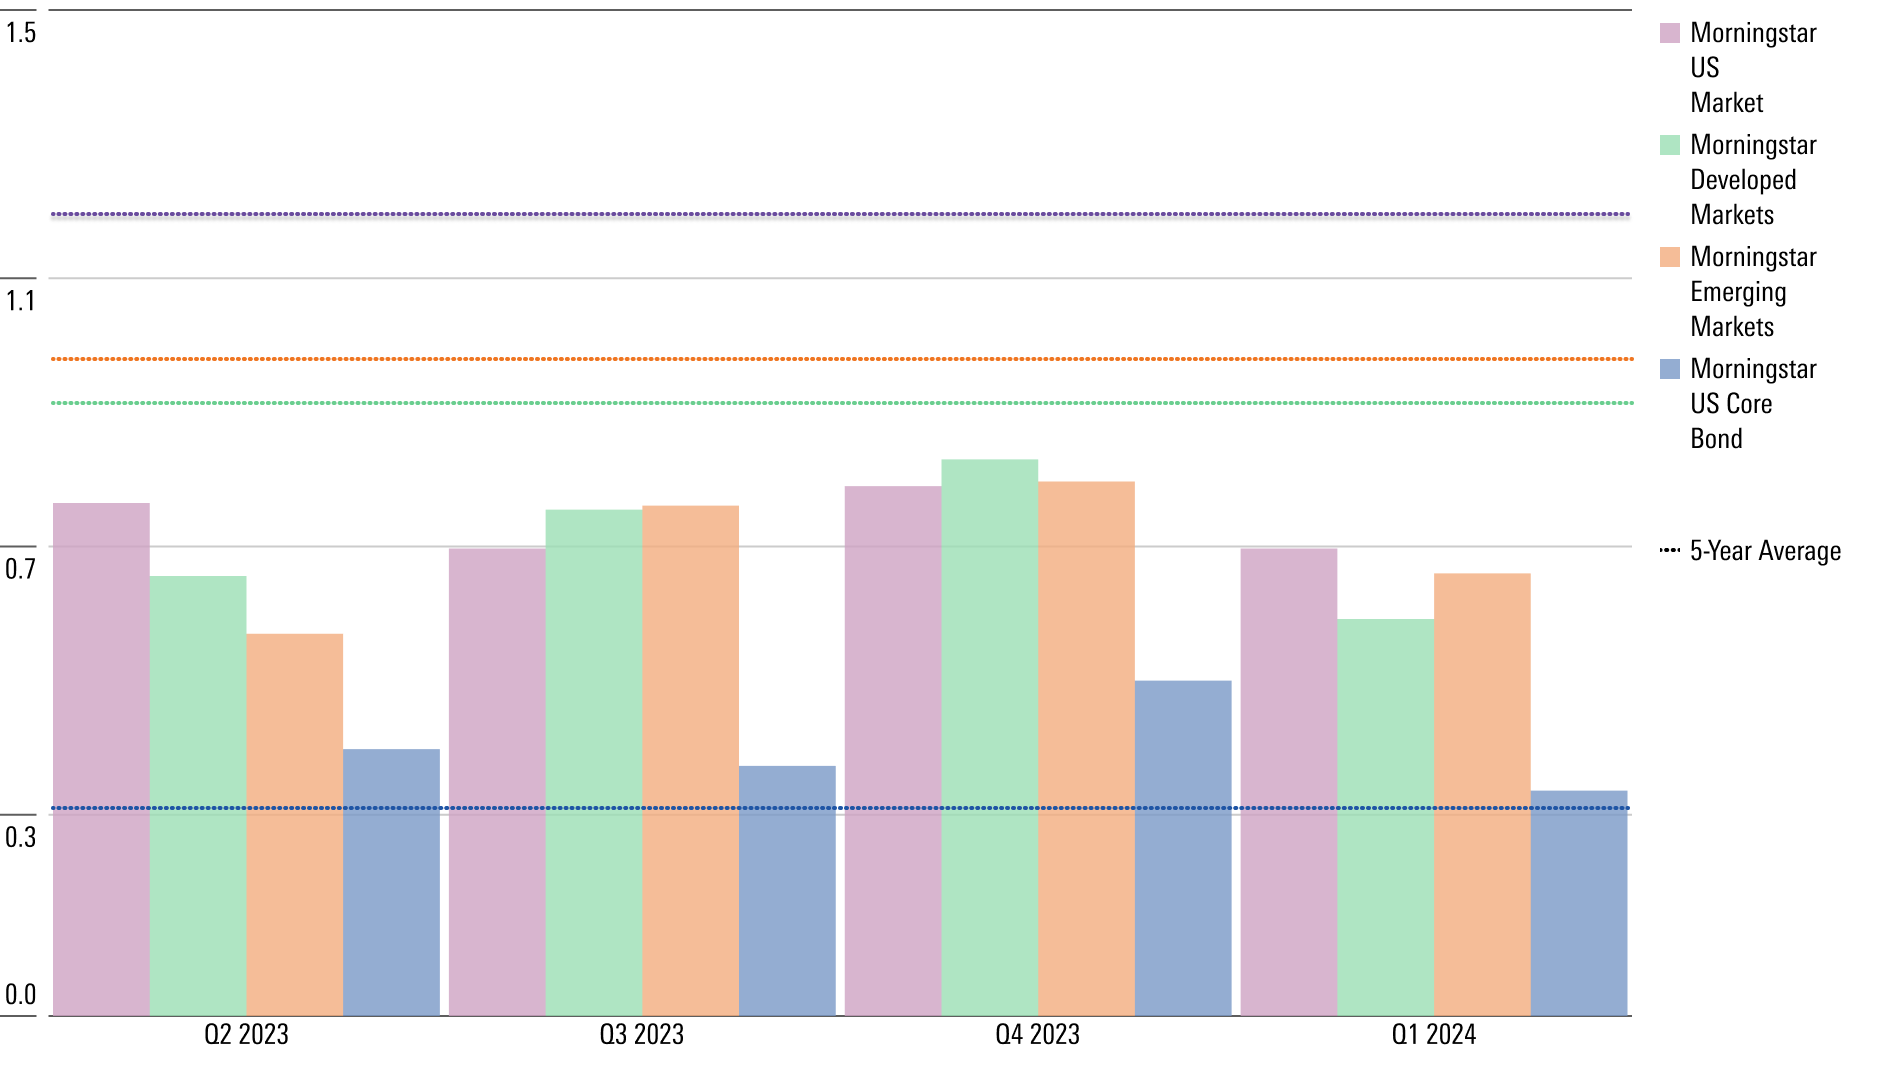
Financial markets were less volatile in the first quarter compared with 2023, but by a relatively narrow margin. Volatility in the US equity market, developed markets, and emerging markets remains low compared to historical trends.
On the other hand, volatility in the bond market remains slightly higher than its five-year average. That’s because of changing expectations for the likely path of interest rates and unexpectedly high inflation, which are soliciting outsized reactions from bond traders.
Historical Standard Deviation
Q1’s Best and Worst Market Performers
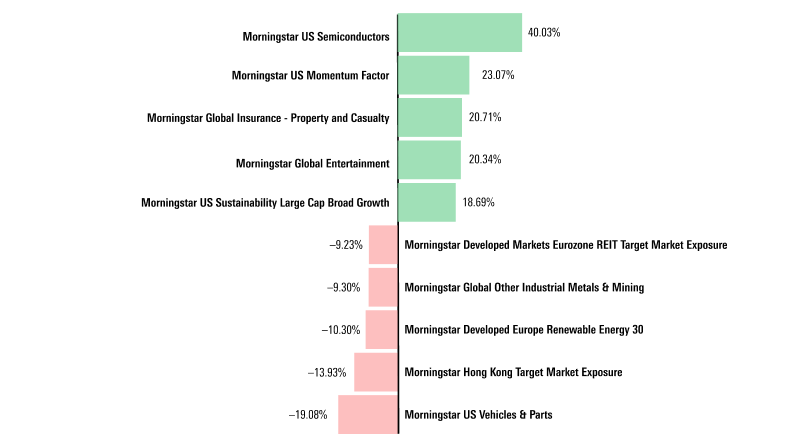
Semiconductor and tech stocks (beneficiaries of the AI boom) led the market in the first quarter.
The US Semiconductor Index ended the quarter up 40%, thanks largely to Nvidia, which accounts for nearly half of the index by weight. The US Momentum Factor Index was next, with gains of 23.1%. The index provides exposure to stocks with a high “momentum” factor—a measure of how much a stock has risen in price relative to other stocks over the past year. Its top holdings include Microsoft, Nvidia, Amazon, and Meta.
On the other end, the US Vehicles and Parts Index lost 19.1% of its value in the first quarter. Embattled electric carmaker Tesla accounts for two-thirds of the portfolio weight of that index and was responsible for most of those losses. Tesla stock has plunged 29% so far this year on waning demand for electric vehicles and warnings of slower growth.
2023 Highlighted Top and Bottom Performers
Commodity Market Performance
Oil prices have been climbing since the start of the year, amid ongoing geopolitical tensions in the Middle East and constraints on production. Crude oil prices rose above $83 per barrel in late March.
In general, higher oil prices mean higher prices for gasoline and consumer goods, contributing to rising inflation. Higher oil prices also tend to act as a tailwind for energy stocks, which gained 13.3% in the first quarter.
Gold and copper prices floundered at the start of the year but ticked up in March. Gold prices ended the quarter up 7.4%, while copper prices gained 3.5%.
The price of gold tends to rise during economic or geopolitical uncertainty. Many investors treat the precious metal as a portfolio hedge against inflation and market volatility. The performance of the copper futures markets is often seen as a window on the health of the global economy, since the metal is used in so many industrial processes. Falling production in China has weighed on prices overall.
Commodity Futures Performance
Q1 2024 Cryptocurrency Performance
Crypto had a banner quarter. The first spot bitcoin exchange-traded funds, which provide investors with exposure to the digital coins, were approved in January. Investors clambered for a piece of the action, and demand for the new funds sent bitcoin and other cryptocurrencies soaring. Bitcoin went to an all-time high of more than $73,000 in mid-March—a far cry from the sub-$30,000 prices it notched a year ago—before giving up a fraction of those gains at the end of the month.
Bitcoin ended the quarter up 64.8%, while Ethereum, the second most popular cryptocurrency, ended the quarter up 53.8%.
Cryptocurrency Performance
The author or authors do not own shares in any securities mentioned in this article. Find out about Morningstar’s editorial policies.
/cloudfront-us-east-1.images.arcpublishing.com/morningstar/MQJKJ522P5CVPNC75GULVF7UCE.jpg)
/cloudfront-us-east-1.images.arcpublishing.com/morningstar/ZYJVMA34ANHZZDT5KOPPUVFLPE.png)
/cloudfront-us-east-1.images.arcpublishing.com/morningstar/S7NJ3ZTJORFVLCRFS2S4LRN3QE.png)