
These Stocks Led the Q1 Value Rally You May Have Missed
The financial services and energy sectors led the return of value stocks in Q1 2024.
/s3.amazonaws.com/arc-authors/morningstar/a8c4d0a1-24c6-4c96-81d6-7bb13a177a1e.jpg)

While many investors were fixated on growth stocks and the artificial intelligence boom lifting big-name technology companies, stodgy value stocks staged a quiet rally in the first quarter of 2024.
After significant underperformance in 2023, value stocks edged out growth stocks during the quarter, with the Morningstar US Value Index gaining 8.4%, just ahead of the 8.3% return on the Morningstar US Growth Index. Financial stocks were a primary driver of that move, and energy, healthcare, and tech stocks in the value category also contributed.
Among the main contributors to the value rally in the first quarter were:
This good news for value investors contrasts sharply with 2023, when growth stocks rose 38.5%, significantly outperforming value stocks, which gained 12% on the year. With big tech names such as Nvidia NVDA and Apple AAPL returning close to 200%, value stocks could not keep up. This trend also contradicts the popular narrative that the market’s rally has been concentrated in just a handful of mega-sized technology names, most notably Nvidia. While it’s true that the overall market was led higher by growth stocks, the picture is more nuanced.
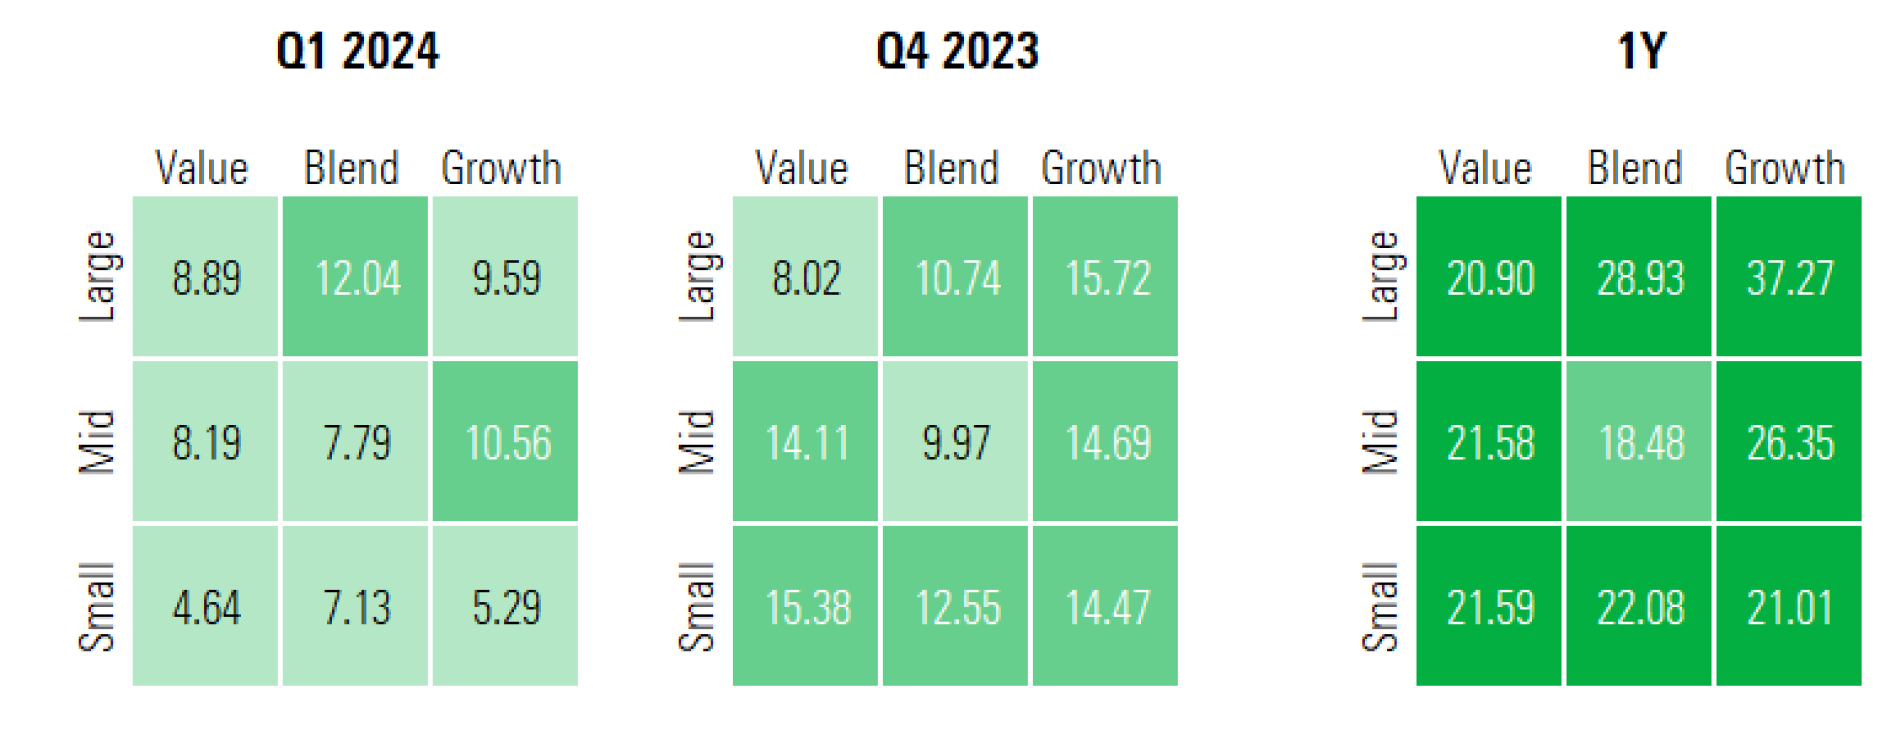
US Equity Style Box Performance
Growth vs. Value Stock Performance History
The first-quarter rebound in value stocks is the latest in a back-and-forth within the market between outperformance and underperformance for value and growth.
Morningstar assigns every stock a style score. These scores are relative, with companies landing in the value, core, and growth categories of the Morningstar Style Box. The score is based on earnings growth rates, sales, book value, cash flow, and other metrics. It also factors in dividend yields and relative valuations like the price/projected earnings ratio, price/book, price/sales, and price/cash flow.
In recent years, the winner of the value/growth battle has largely been determined by how big tech has performed. The 2023 growth rally was driven by the “Magnificent Seven”—Apple, Nvidia, Alphabet GOOGL, Amazon.com AMZN, Meta Platforms META, Microsoft MSFT, and Tesla TSLA. Nvidia returned 239% to lead the pack, Apple returned 194.1%, and Tesla returned 101.7%. Together they contributed 40.2% of the Morningstar US Growth Index’s return.
In the bear market of 2022, value stocks, which saw a 0.7% loss, fell less than growth stocks, which dropped 36.7%. Battered by macroeconomic pressures and fear of an impending recession, the US Technology Index fell 31.6% in 2022, with Tesla down 65%, Meta down 64.2%, and Nvidia down 50.3%.
Before 2022, growth stocks took the crown five years in a row, with the largest margin coming in 2020 when growth stocks gained 44.7% and value stocks lost 1.3%.
Value vs. Growth Annual Performance
Which Value Stocks Have Led the Rally?
Large-cap value stocks returned 8.9% on the quarter to lead gains. Meanwhile, mid-cap value stocks returned 8.2%, and small-cap value stocks returned 4.6%.
Financial services and energy stocks led the US Large Value Index’s 8.9% rally in the first quarter. Financial services (27.4% of the index) returned 13.7%, and energy (10.9%) returned 13.8%. Thanks to those gains, financials contributed nearly 40% of the overall return on the value index and energy more than 15%.
Diversified banks and insurance companies were the industries that contributed most to the rally, accounting for 33.9% of the return on the large value index. Both industries returned 17.9% in the first quarter.
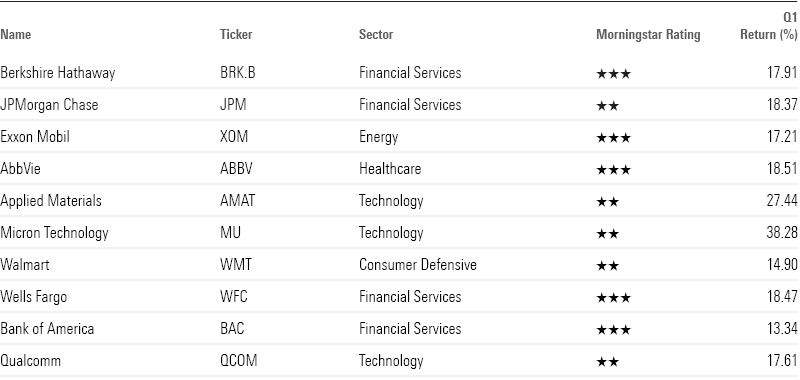
Berkshire Hathaway, JPMorgan Chase, and Exxon Mobil were the leading individual stocks contributing to the performance of the US Large Value Index. Berkshire Hathaway returned 17.9%, JPMorgan returned 18.5%, and Exxon Mobil returned 17.4%. These stocks contributed 31.8% of the return on the US Large Value Index in the quarter.
Large Value Leading Contributors
The financial services sector was the leading contributor to the 8.2% gain on the US Mid Value Index (financial services stocks make up 19.6% of the index). These stocks returned 13.1% in the first quarter.
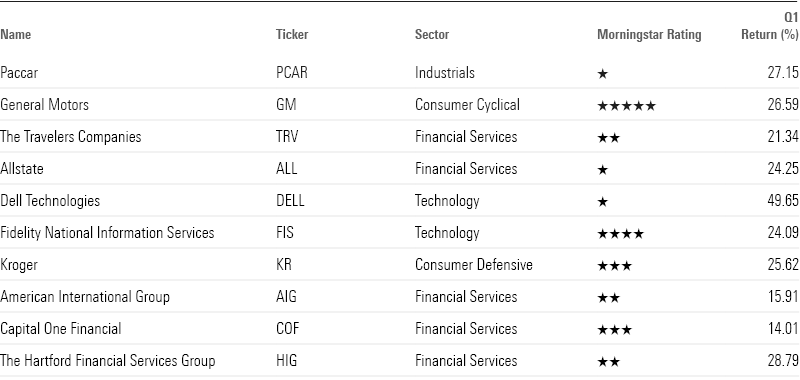
The next-largest contributor was the consumer cyclical sector, which gained 12.6%. Truck manufacturer Paccar PCAR and auto manufacturer General Motors GM drove those gains. Building off a banner year in 2023, Paccar returned 27.2% in the first quarter as trucking demand remained high. GM returned 26.6% as higher inventories increased consumer demand for its vehicles.
Mid Value Leading Contributors
Consumer cyclical and energy stocks drove the 4.6% gain on the US Small Value Index in the first quarter. Small-cap consumer cyclical stocks, which are 21.7% of the index, were up 8.6%. Small-cap energy stocks, (8.1% of the index) returned 14.7%. These two sectors accounted for 65.1% of the index’s gain in the first quarter.
Specialty retail was the largest contributor at the industry level, returning 35.1% and accounting for 15.7% of the gain in the index. Oil and gas exploration and production companies, residential construction stocks, and medical care facilities were additional top contributors.
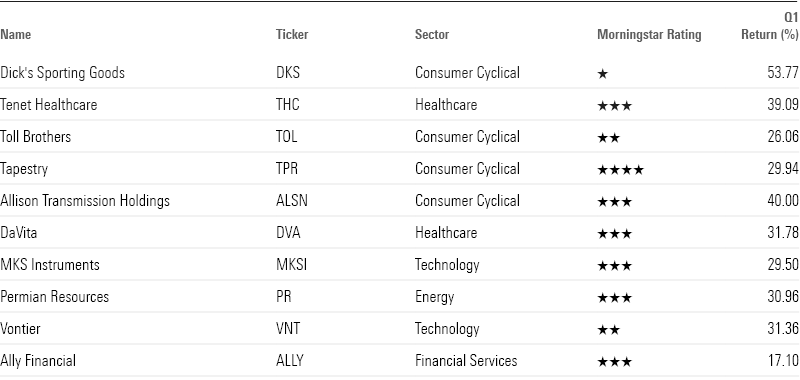
The largest individual contributor to the index was Dick’s Sporting Goods DKS, which gained 53.8% in the quarter and has seen its share price double over the past five months. Tenet Healthcare THC was the second-largest contributor, with a 39.1% return.
Small Value Leading Contributors
The author or authors do not own shares in any securities mentioned in this article. Find out about Morningstar’s editorial policies.
/d10o6nnig0wrdw.cloudfront.net/04-29-2024/t_eae1cd6b656f43d5bf31399c8d7310a7_name_file_960x540_1600_v4_.jpg)
/cloudfront-us-east-1.images.arcpublishing.com/morningstar/PKH6NPHLCRBR5DT2RWCY2VOCEQ.png)
/cloudfront-us-east-1.images.arcpublishing.com/morningstar/GJMQNPFPOFHUHHT3UABTAMBTZM.png)
:quality(80)/s3.amazonaws.com/arc-authors/morningstar/a8c4d0a1-24c6-4c96-81d6-7bb13a177a1e.jpg)