
U.S. Fund Flows: More Meager Inflows in July
Bond funds stayed in favor during another mild month.
/s3.amazonaws.com/arc-authors/morningstar/96a2625e-83c2-4fdb-9fd7-0efcd07c88bb.jpg)
/s3.amazonaws.com/arc-authors/morningstar/30e2fda6-bf21-4e54-9e50-831a2bcccd80.jpg)

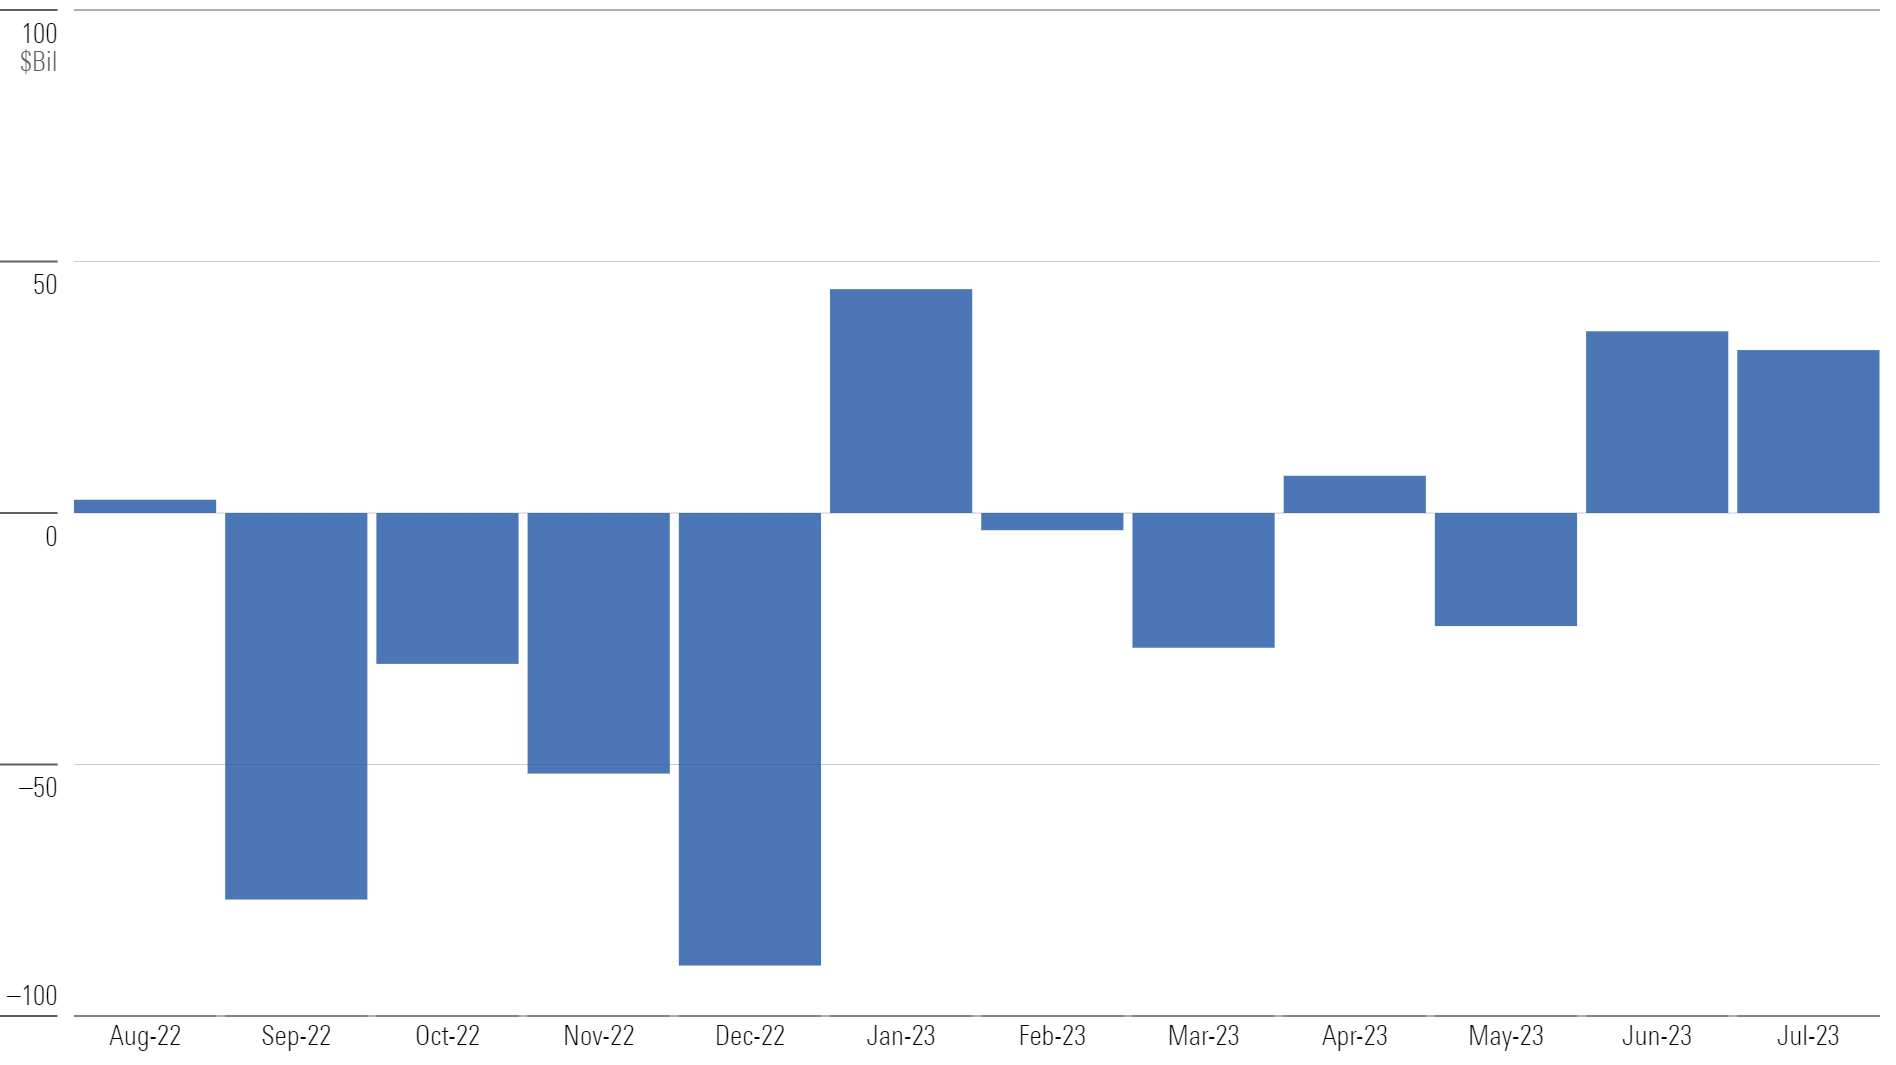
U.S. mutual funds and exchange-traded funds took in about $32 billion in July, a low figure relative to historical standards. It was just the fourth month of overall inflows so far in 2023. Six of the 10 category groups netted new money, while four suffered outflows.
Monthly Long-Term U.S. Fund Flows
U.S. Equity Flows Fall Flat; Value Funds Tumble
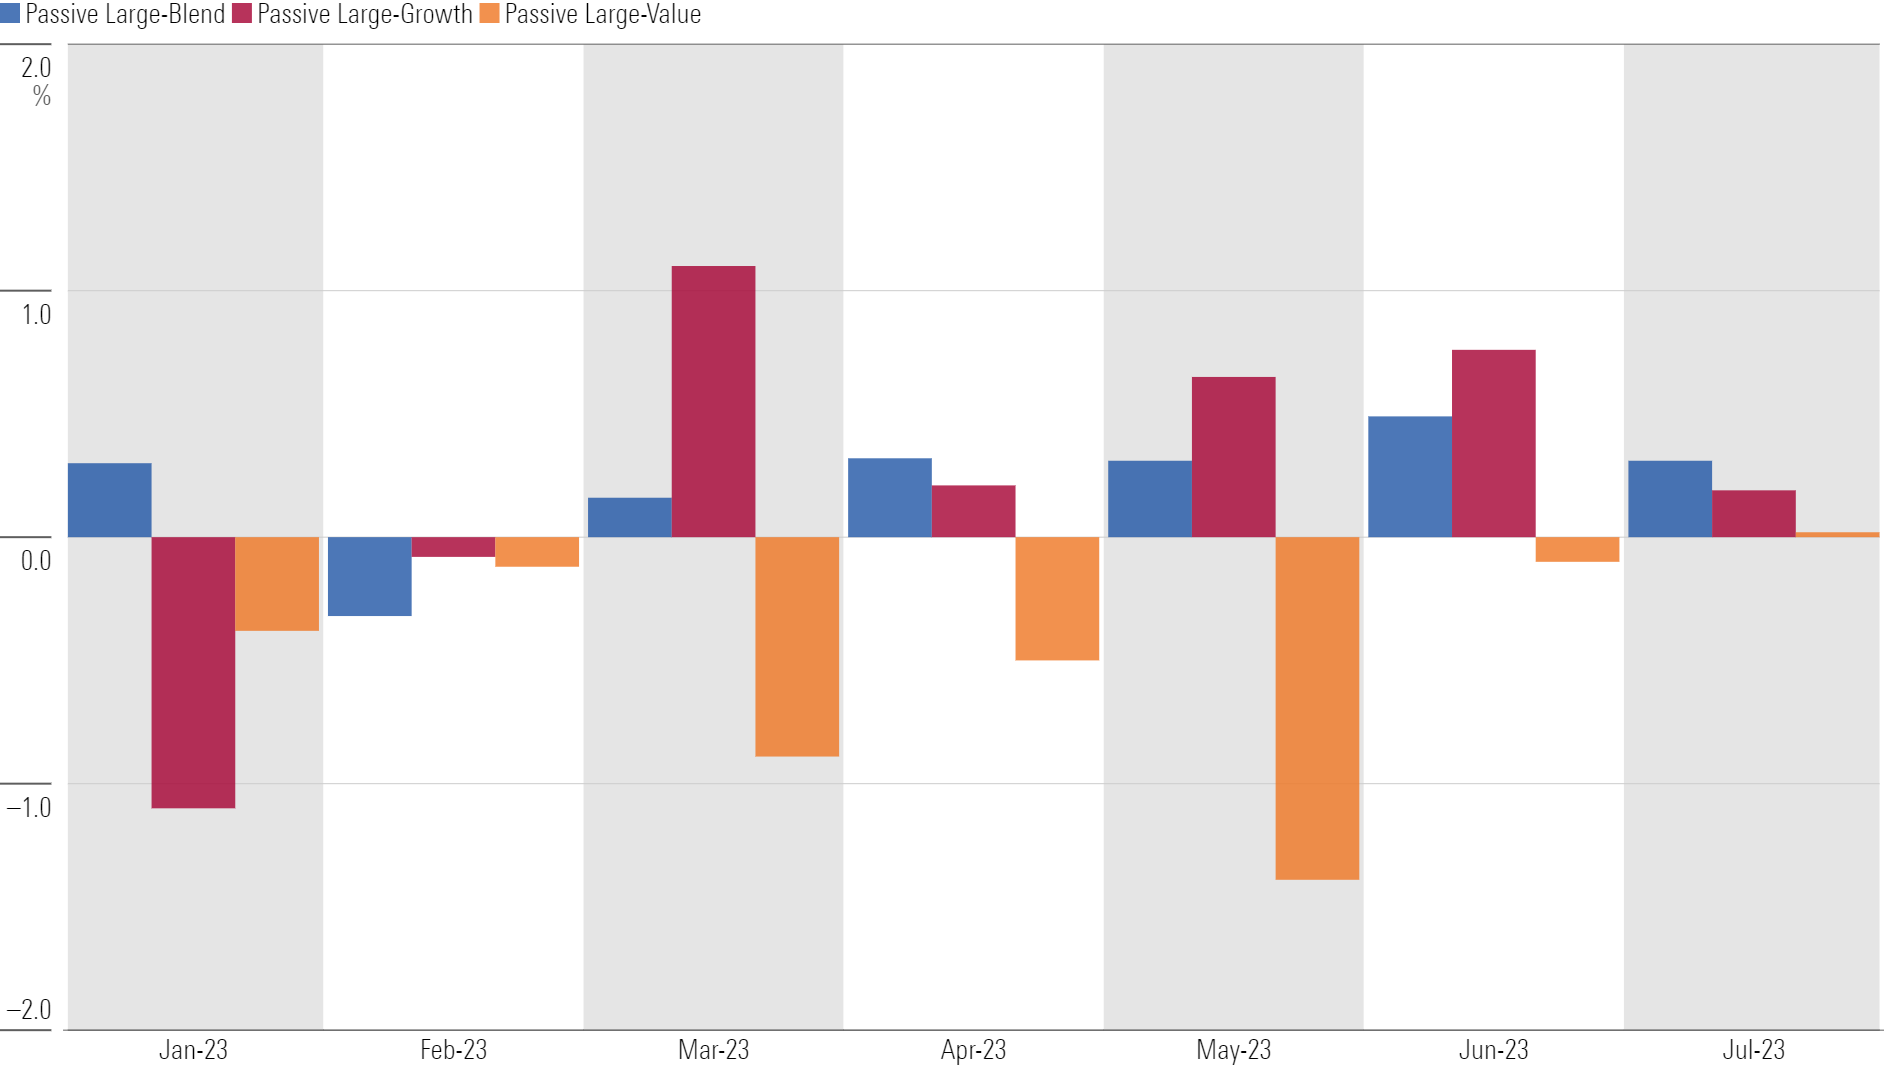
U.S. equity fund flows have gotten out of the red, but they’re hardly raking in assets. After taking in just $5.6 billion in June, they gathered a paltry $1.6 billion in July. For the year to date, U.S. equity funds have shed $71 billion. Large-value funds remain the laggard so far this year. Even passive large-value funds have suffered outflows while passive large-growth and large-blend funds have enjoyed inflows.
Year-to-Date Passive Large-Cap Organic Growth Rates
Sector-Equity Funds Snap Historic Skid in July
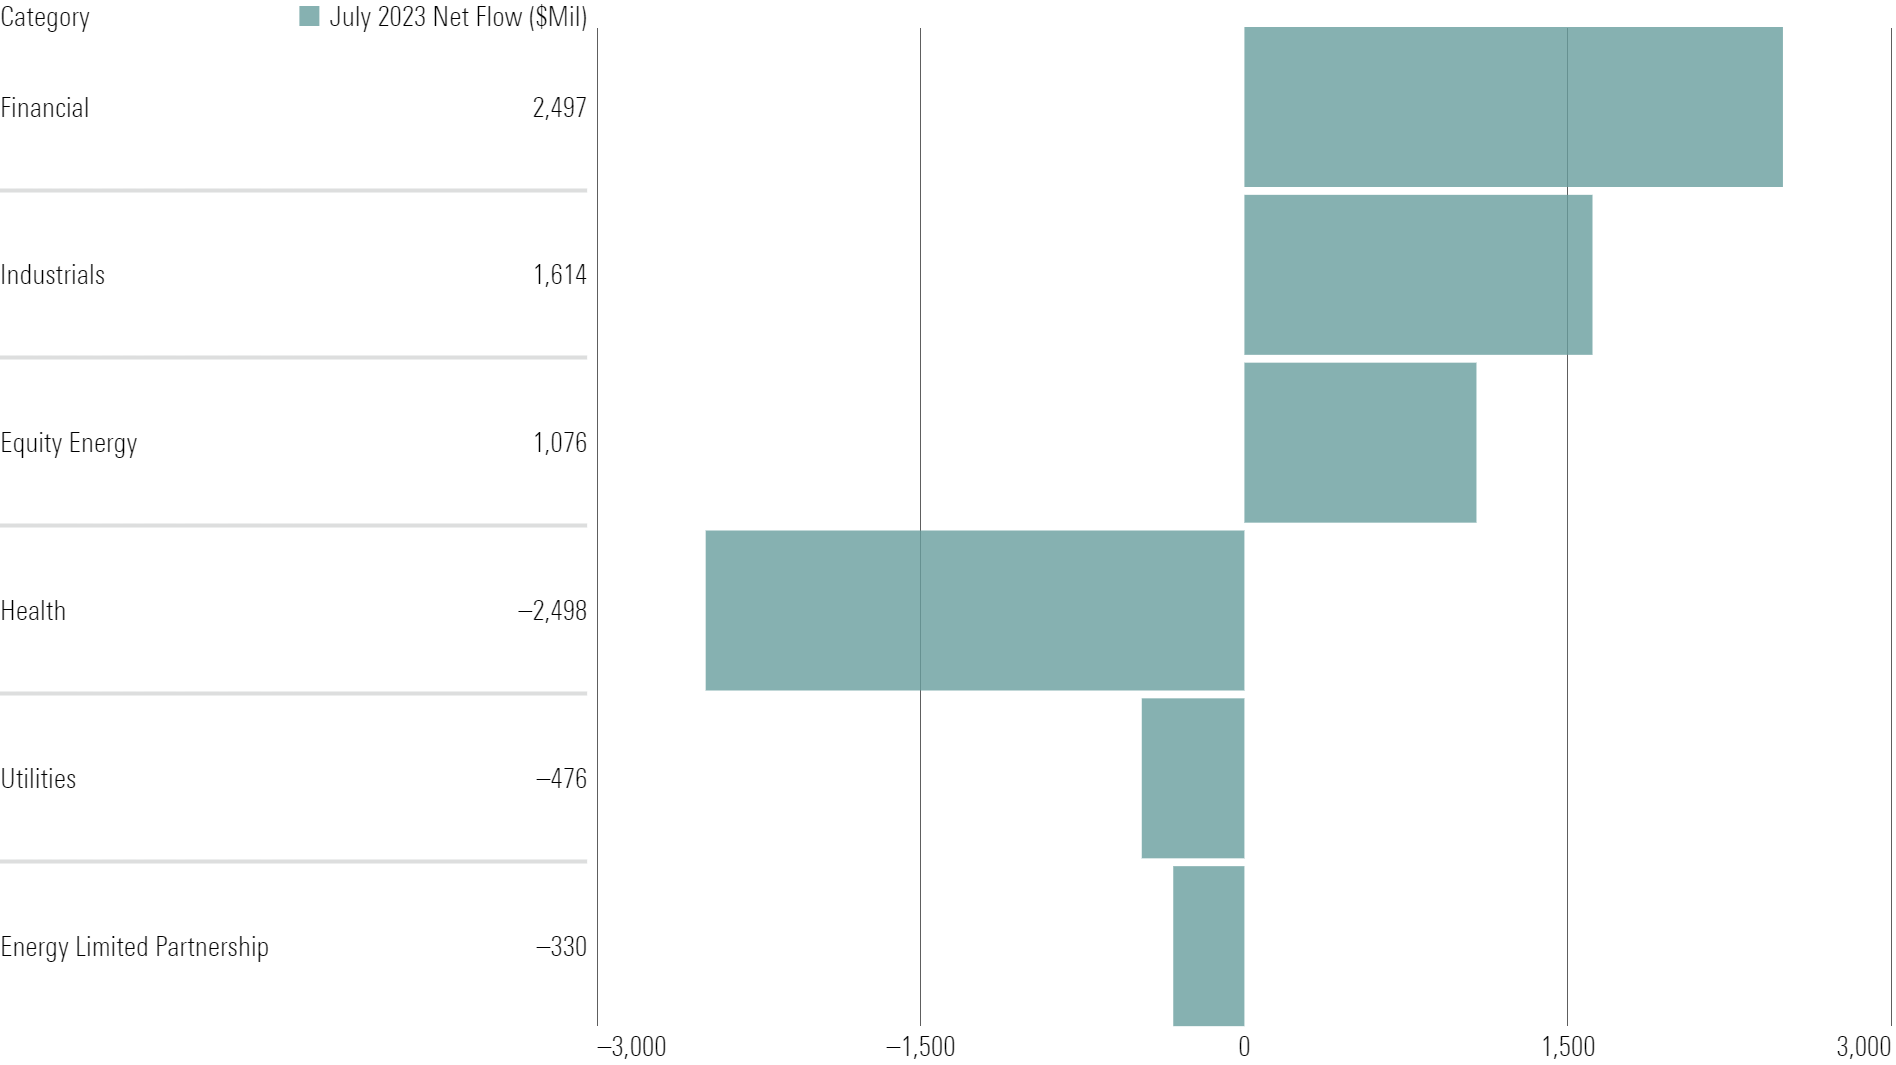
Niche offerings in the sector-equity category came back to life in July, taking in $5.7 billion and ending seven consecutive months of outflows, the category’s longest skid on record. Investors appeared to bet on a cyclical acceleration based on their preference for financial, industrials, and equity energy funds, as well as their distaste for more-defensive healthcare and utilities funds.
July Sector-Equity Flows
Big Inflows Into India Highlight a Dull Month for International-Equity Funds
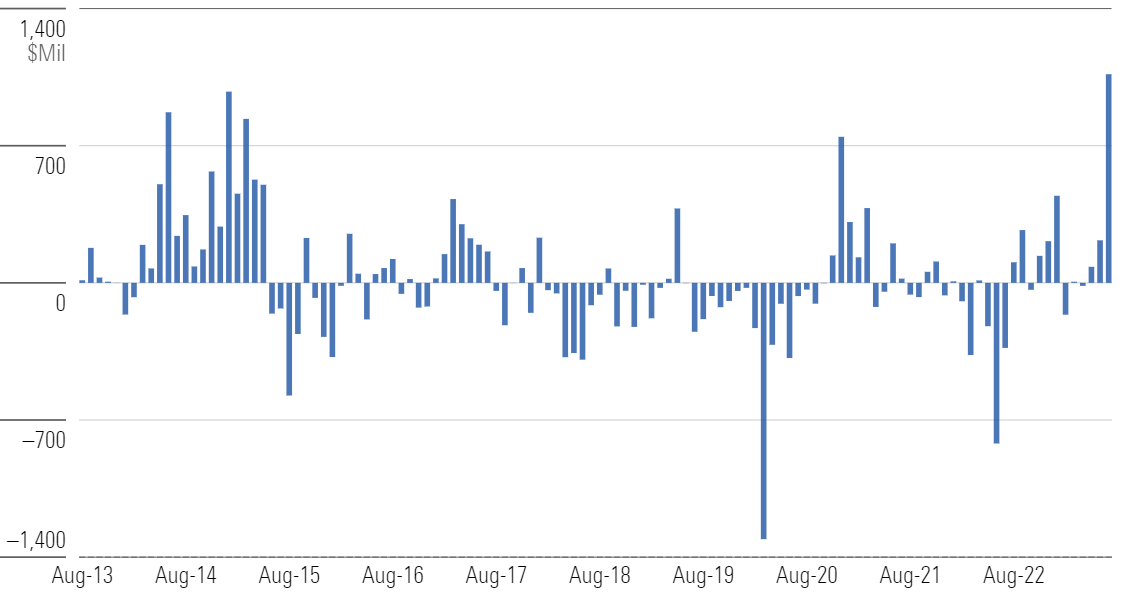
Investors have lost their taste for foreign-stock funds since early 2022. These funds took in just $2 billion in July, bringing their year-to-date total to $22.6 billion—a far cry from 2021′s $258 billion. The India equity Morningstar Category was a surprise performer in July, gathering the second-most assets in the group with a $1.1 billion haul. It’s the category’s highest total since Morningstar began collecting data in 1993.
Historical India-Equity Flows
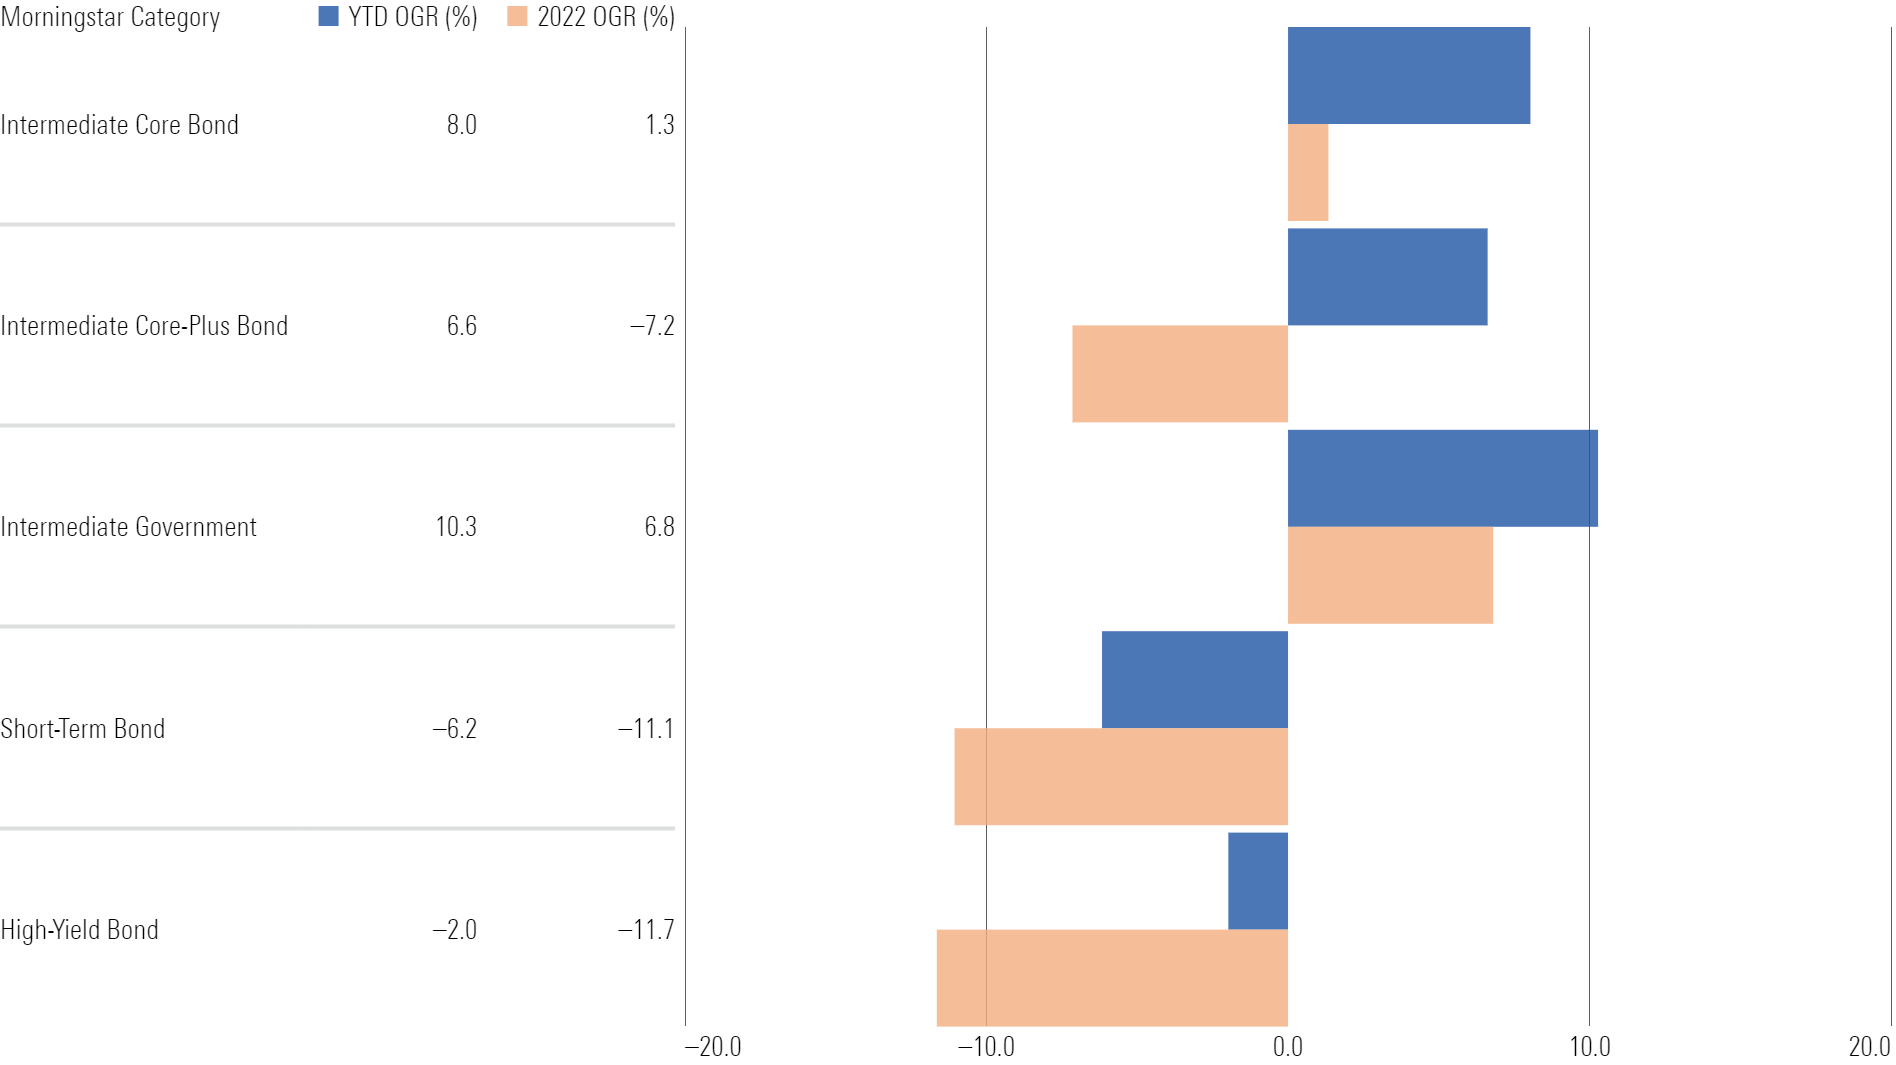
Taxable-Bond Funds Keep Riding the Wave
Taxable-bond funds pulled in a fresh $28 billion in July, pushing their year-to-date haul to $171 billion—about $150 billion more than the next-closest category group. Healthy inflows into the intermediate-core bond categories have powered the cohort. Even pockets that are out of favor, like short-term and high-yield bond funds, have endured milder outflows than they did in 2022.
Taxable-Bond Organic Growth Rates
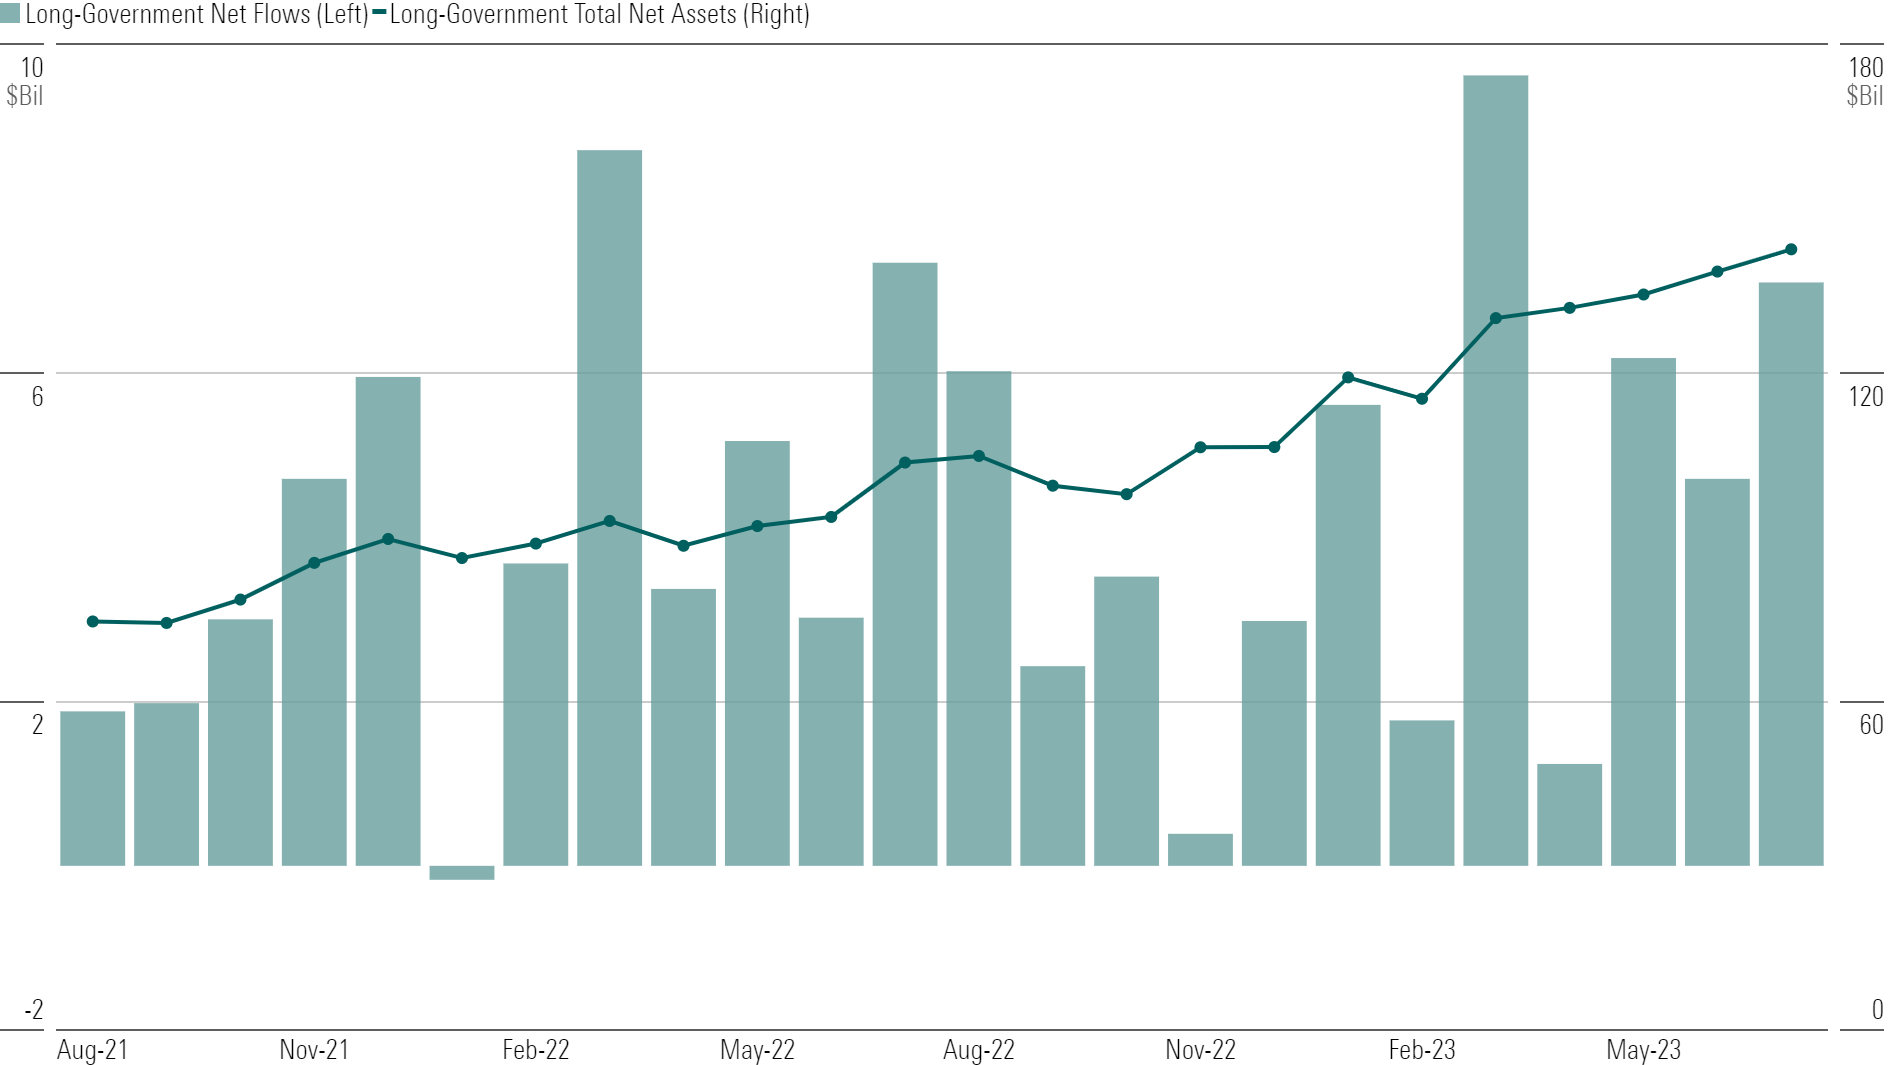
Long-Government Assets Continue to Balloon
Long-term government-bond funds started their tear long before the calendar turned to 2023. The category reeled in more than $100 billion of new money over the two years through July 2023, nearly doubling its total assets (despite a steep decline in bond prices in 2022). This meteoric rise is a testament to investors’ recent comfort with interest-rate risk but distaste for credit risk.
Long-Government Flows
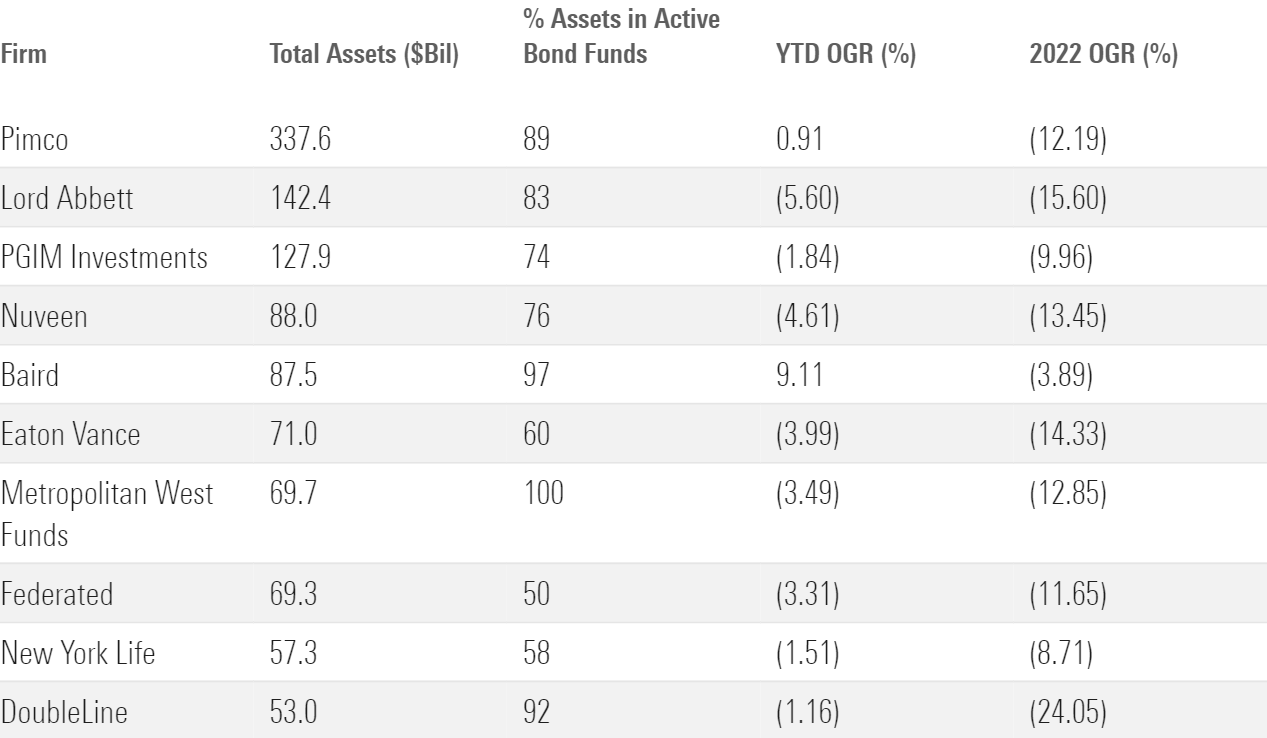
Active Bond-Fund Providers Stop (or Slow) the Bleeding
Investors fled active and fixed-income funds in 2022, making it a brutal year for firms whose core offerings meet both criteria. So far in 2023, most of those shops have corralled those outflows or reversed them entirely. Pimco, for example, absorbed $3 billion for the year to date after shedding $53 billion in 2022.
Active Bond Provider Organic Growth Rates
This article is adapted from the Morningstar Direct U.S. Asset Flows Commentary for July 2023. Download the full report here.
The author or authors do not own shares in any securities mentioned in this article. Find out about Morningstar’s editorial policies.
/cloudfront-us-east-1.images.arcpublishing.com/morningstar/5WSHPTEQ6BADZPVPXVVDYIKL5M.png)
/cloudfront-us-east-1.images.arcpublishing.com/morningstar/OMVK3XQEVFDRHGPHSQPIBDENQE.jpg)
/cloudfront-us-east-1.images.arcpublishing.com/morningstar/BNHBFLSEHBBGBEEQAWGAG6FHLQ.png)
:quality(80)/s3.amazonaws.com/arc-authors/morningstar/96a2625e-83c2-4fdb-9fd7-0efcd07c88bb.jpg)
:quality(80)/s3.amazonaws.com/arc-authors/morningstar/30e2fda6-bf21-4e54-9e50-831a2bcccd80.jpg)