
It’s Official: Passive Funds Overtake Active Funds
But the recovery of U.S. fund flows was weak in 2023.
/s3.amazonaws.com/arc-authors/morningstar/96a2625e-83c2-4fdb-9fd7-0efcd07c88bb.jpg)

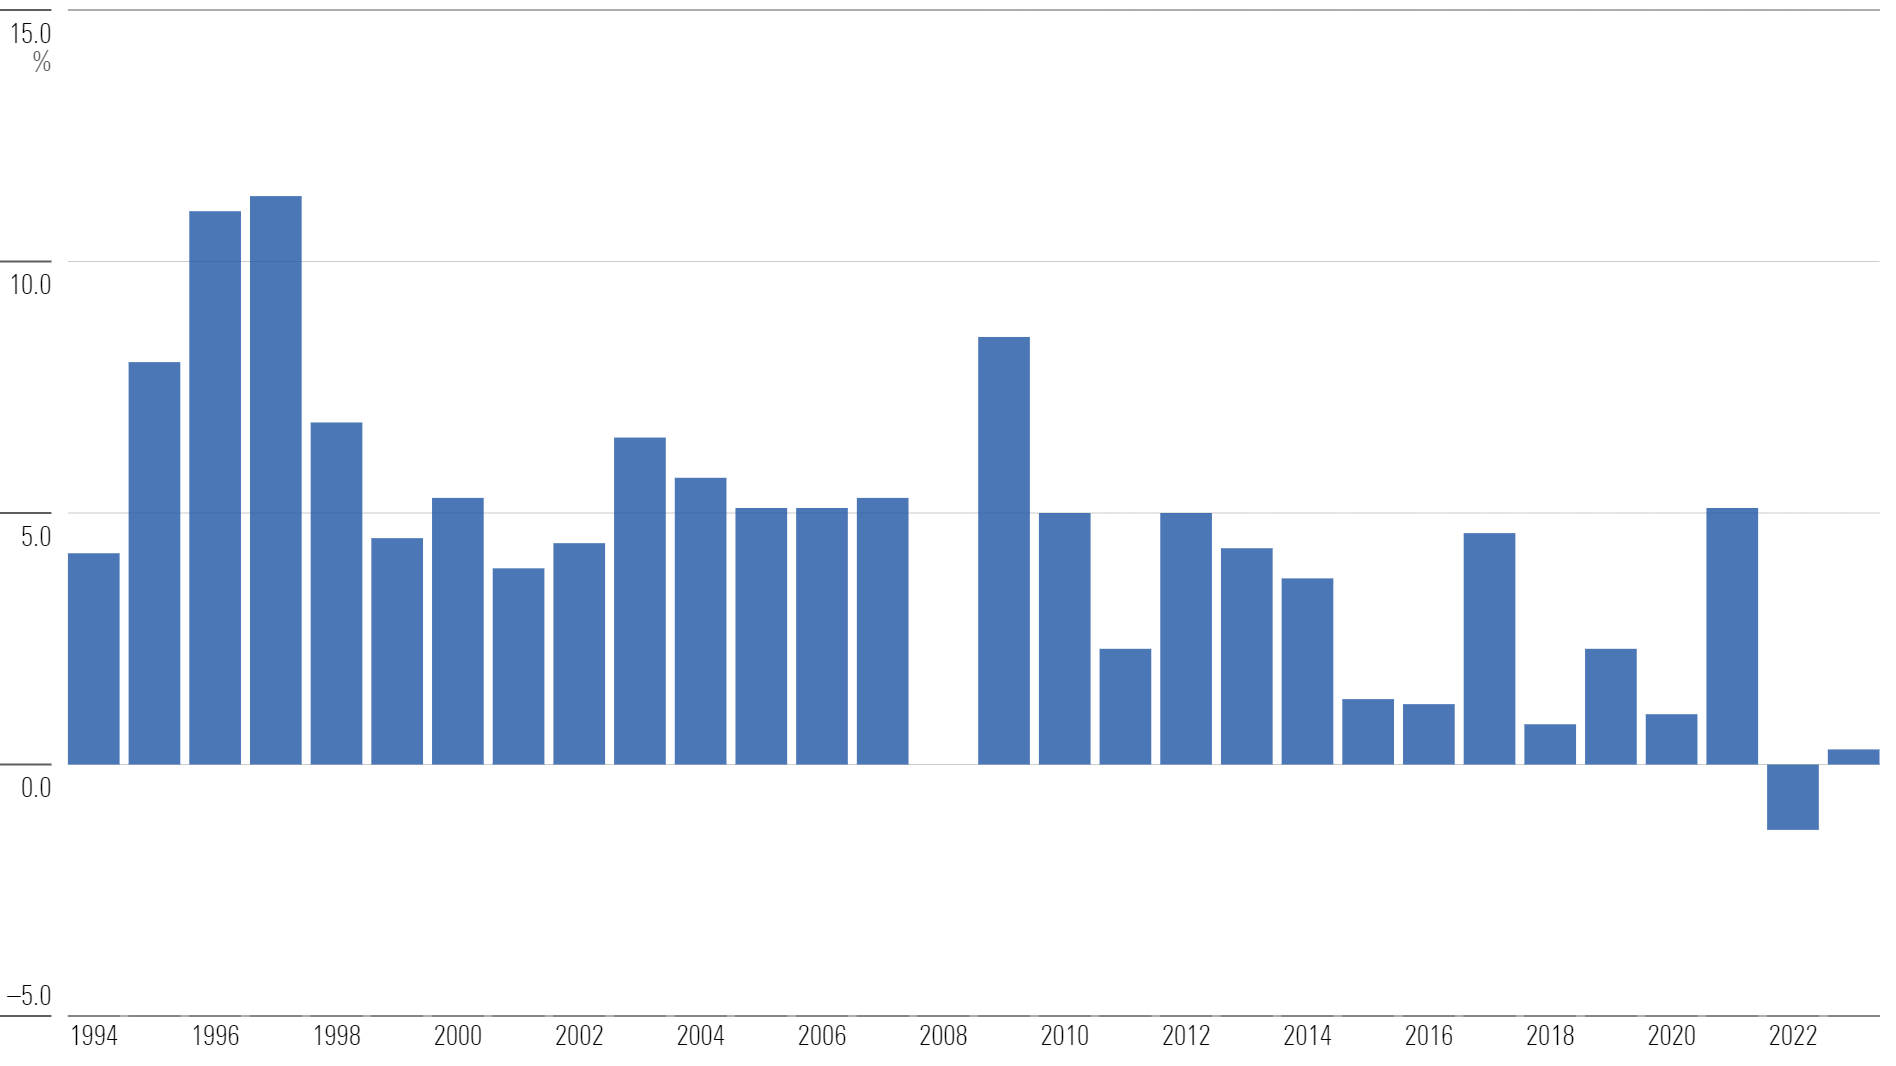
U.S. mutual funds and exchange-traded funds gathered $79 billion in 2023. While that represented a rebound from a historically poor 2022, it was equivalent to the second-lowest positive organic growth rate in Morningstar’s data beginning in 1993. Year-to-date flows were negative through October. Investors plowed $57 billion into U.S. funds in December, the largest monthly sum of the year.
Annual Long-Term U.S. Organic Growth Rates
It’s Official: Passive Funds Overtake Active Funds
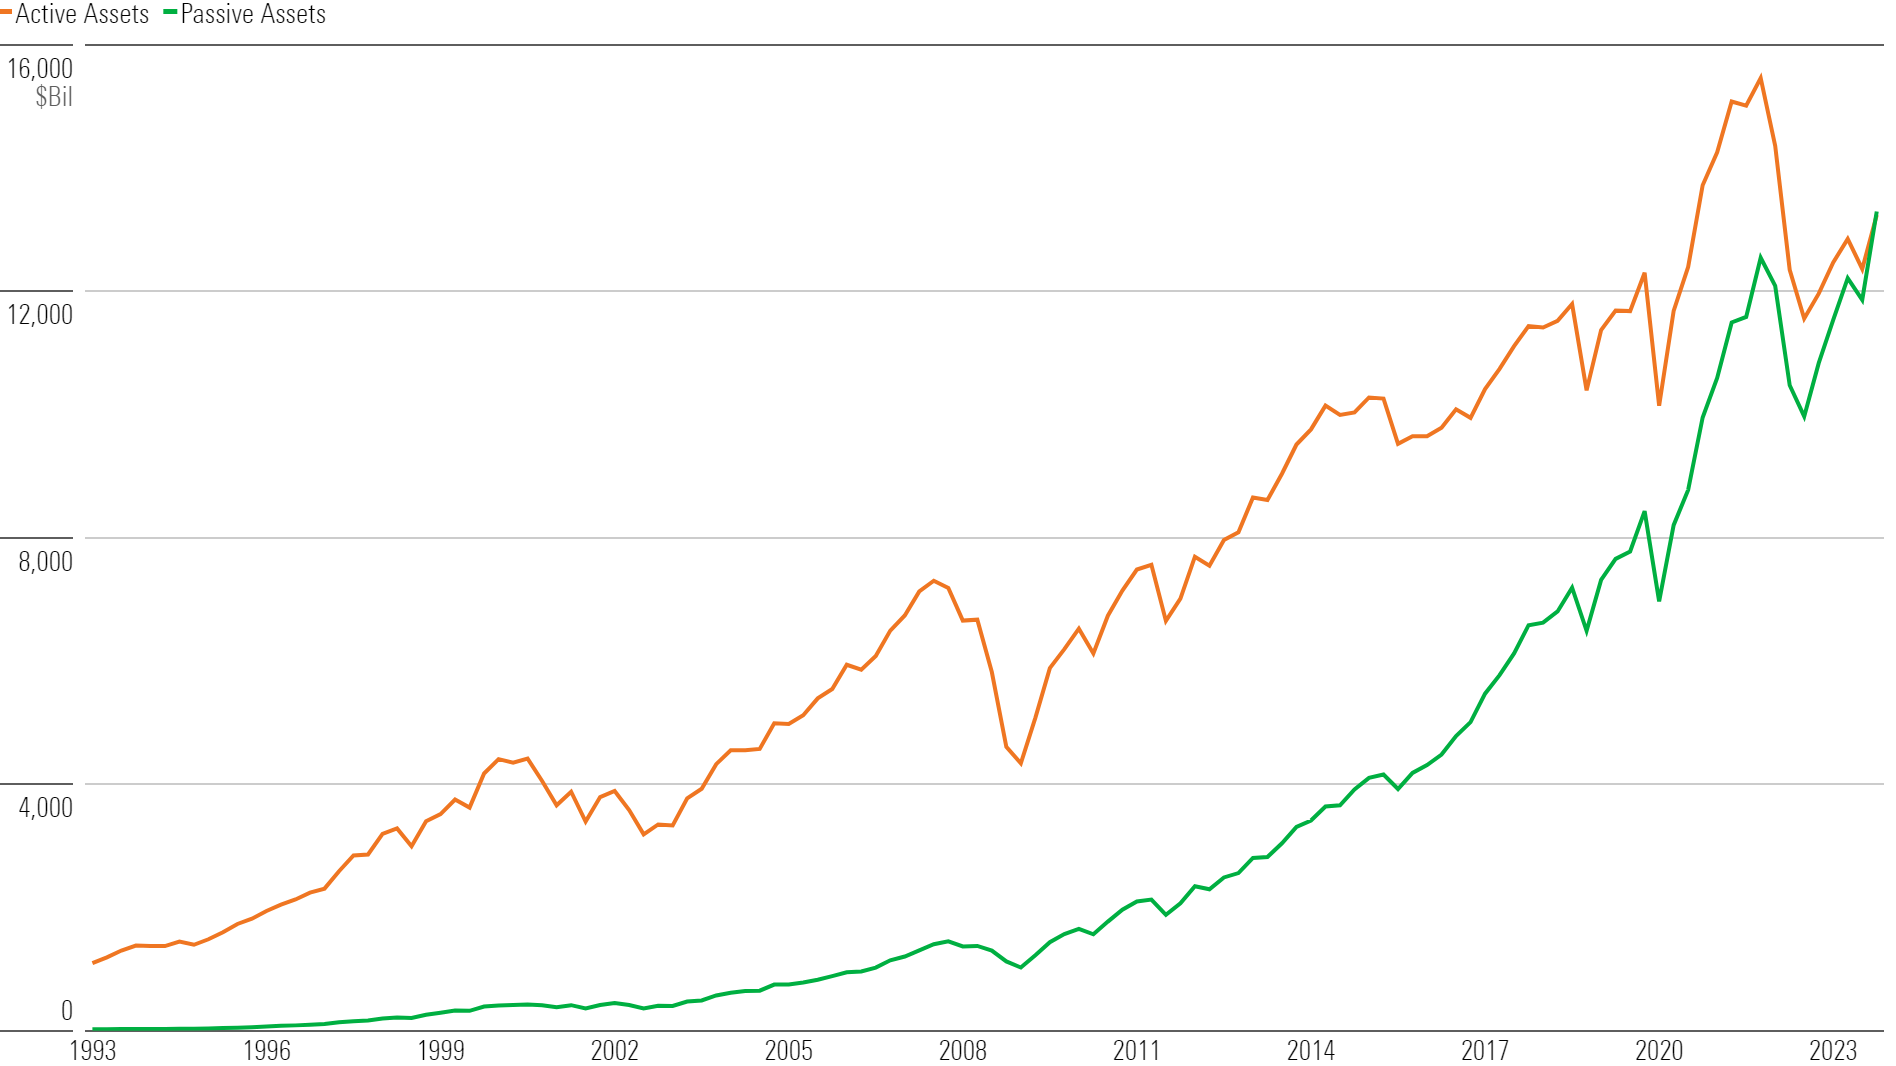
After steadily encroaching on active funds’ turf for years, passive funds closed 2023 with more assets. While U.S. equity flows have long favored passive products, international-equity and bond-fund flows have followed suit, helping to get passive funds over the hump.
Historical Fund Assets: Active vs. Passive
Index Fund Phenomenon Is in Cruise Control
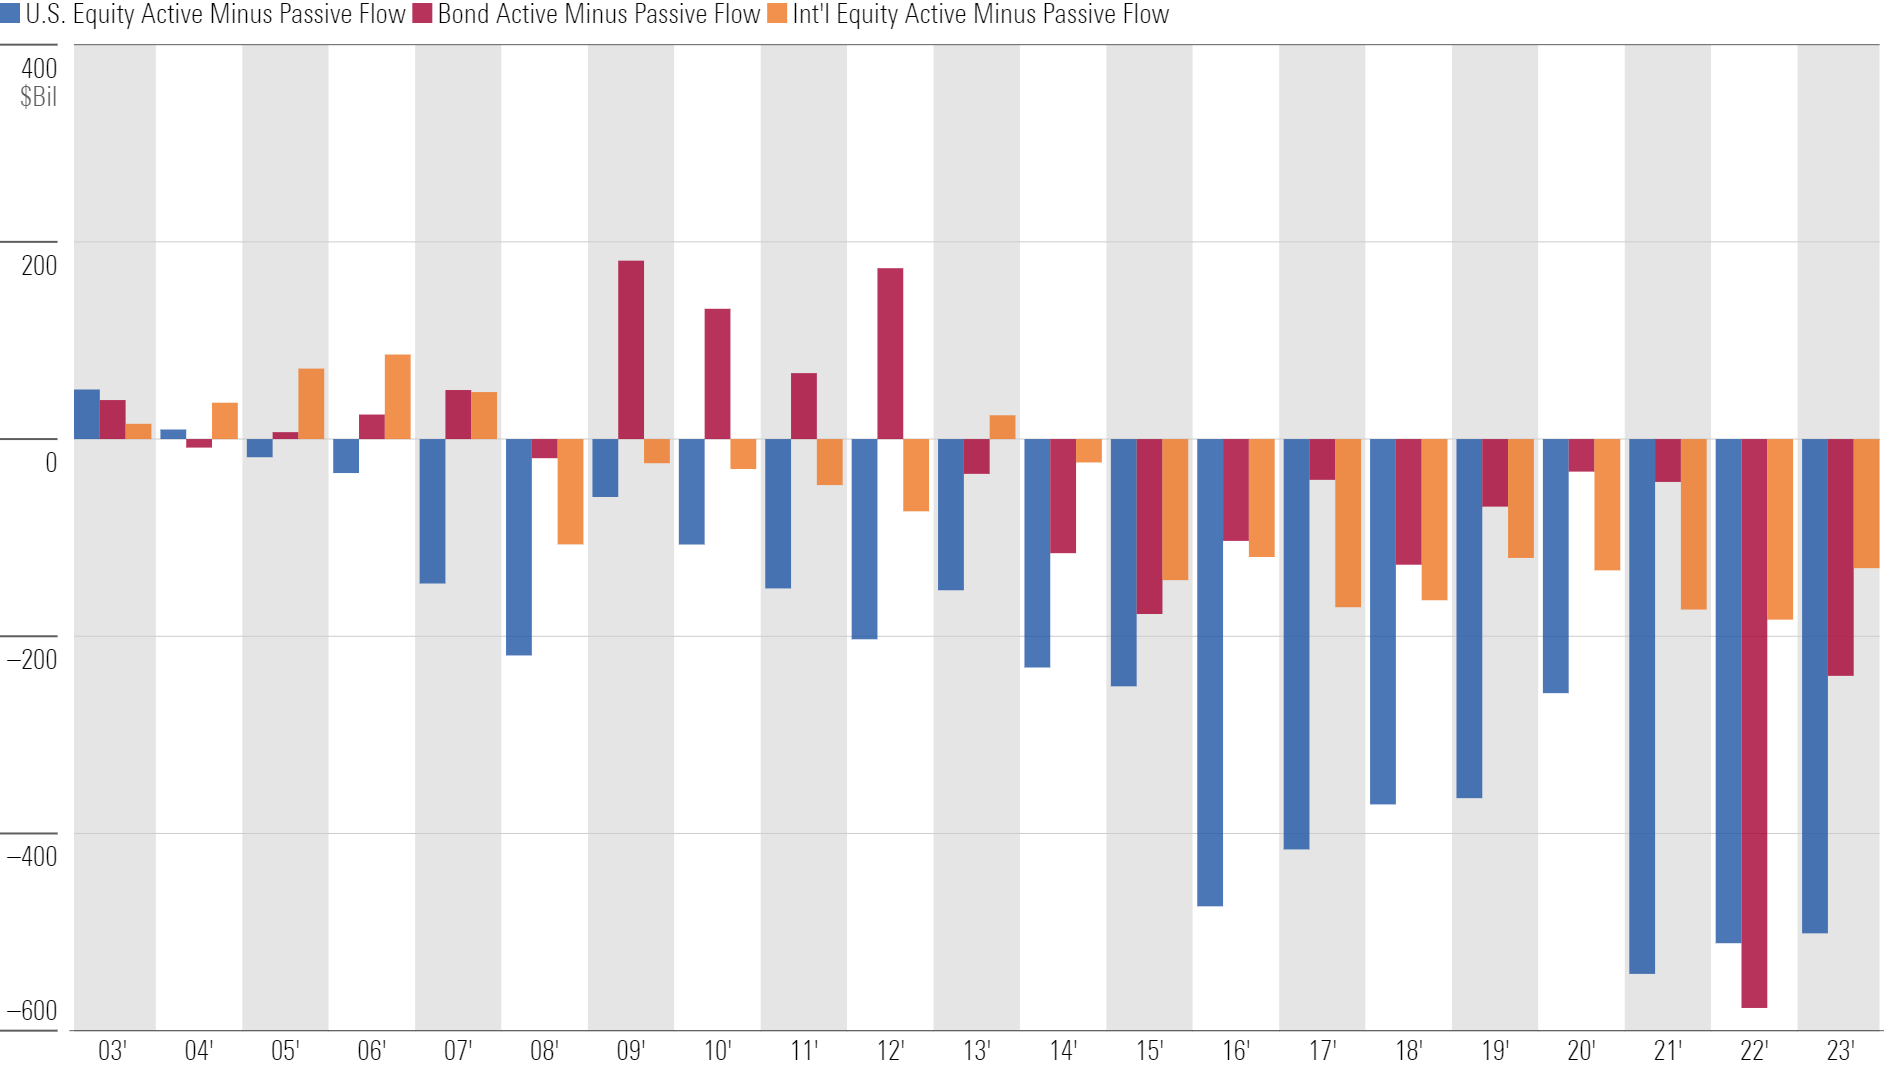
Active bond funds pulled in more dollars on a net basis than passive counterparts for years until 2013. They haven’t achieved that feat in a calendar year since. International-equity fund flows began favoring passives in 2008, and U.S. equity fund flows first turned that way in 2005. It’s been one-way traffic over the past decade.
Historical Active vs. Passive Flows by Category Group
Flight to Passive Impacts Category Flows
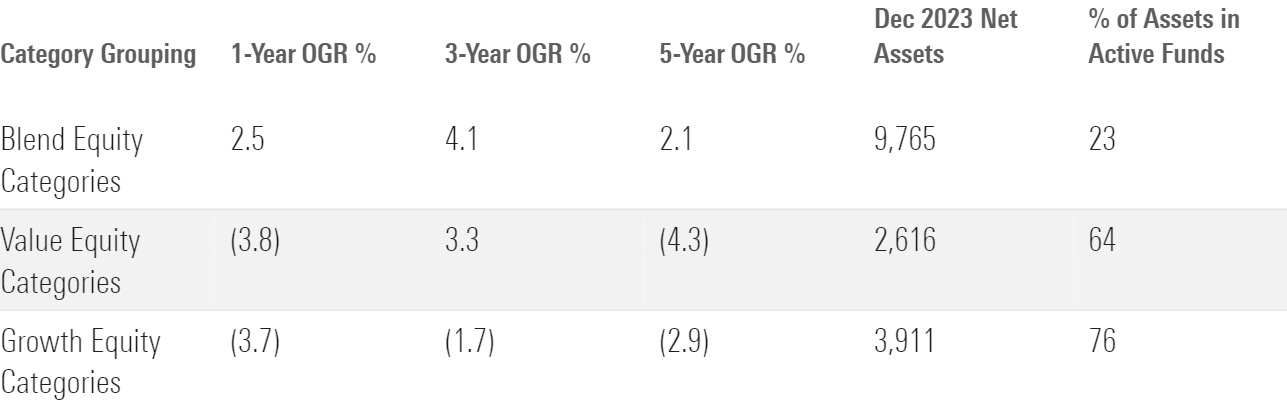
Because the largest and most prominent passive equity funds own the broad market, flows into blend-style categories have been the strongest. Conversely, value and growth categories tend to lean toward actively managed strategies, predisposing them to outflows. The active-to-passive undercurrent complicates the fund flow investment signal at times.
Equity Category Organic Growth Rates and Assets
The Push-Pull of Market Performance and Rebalancing
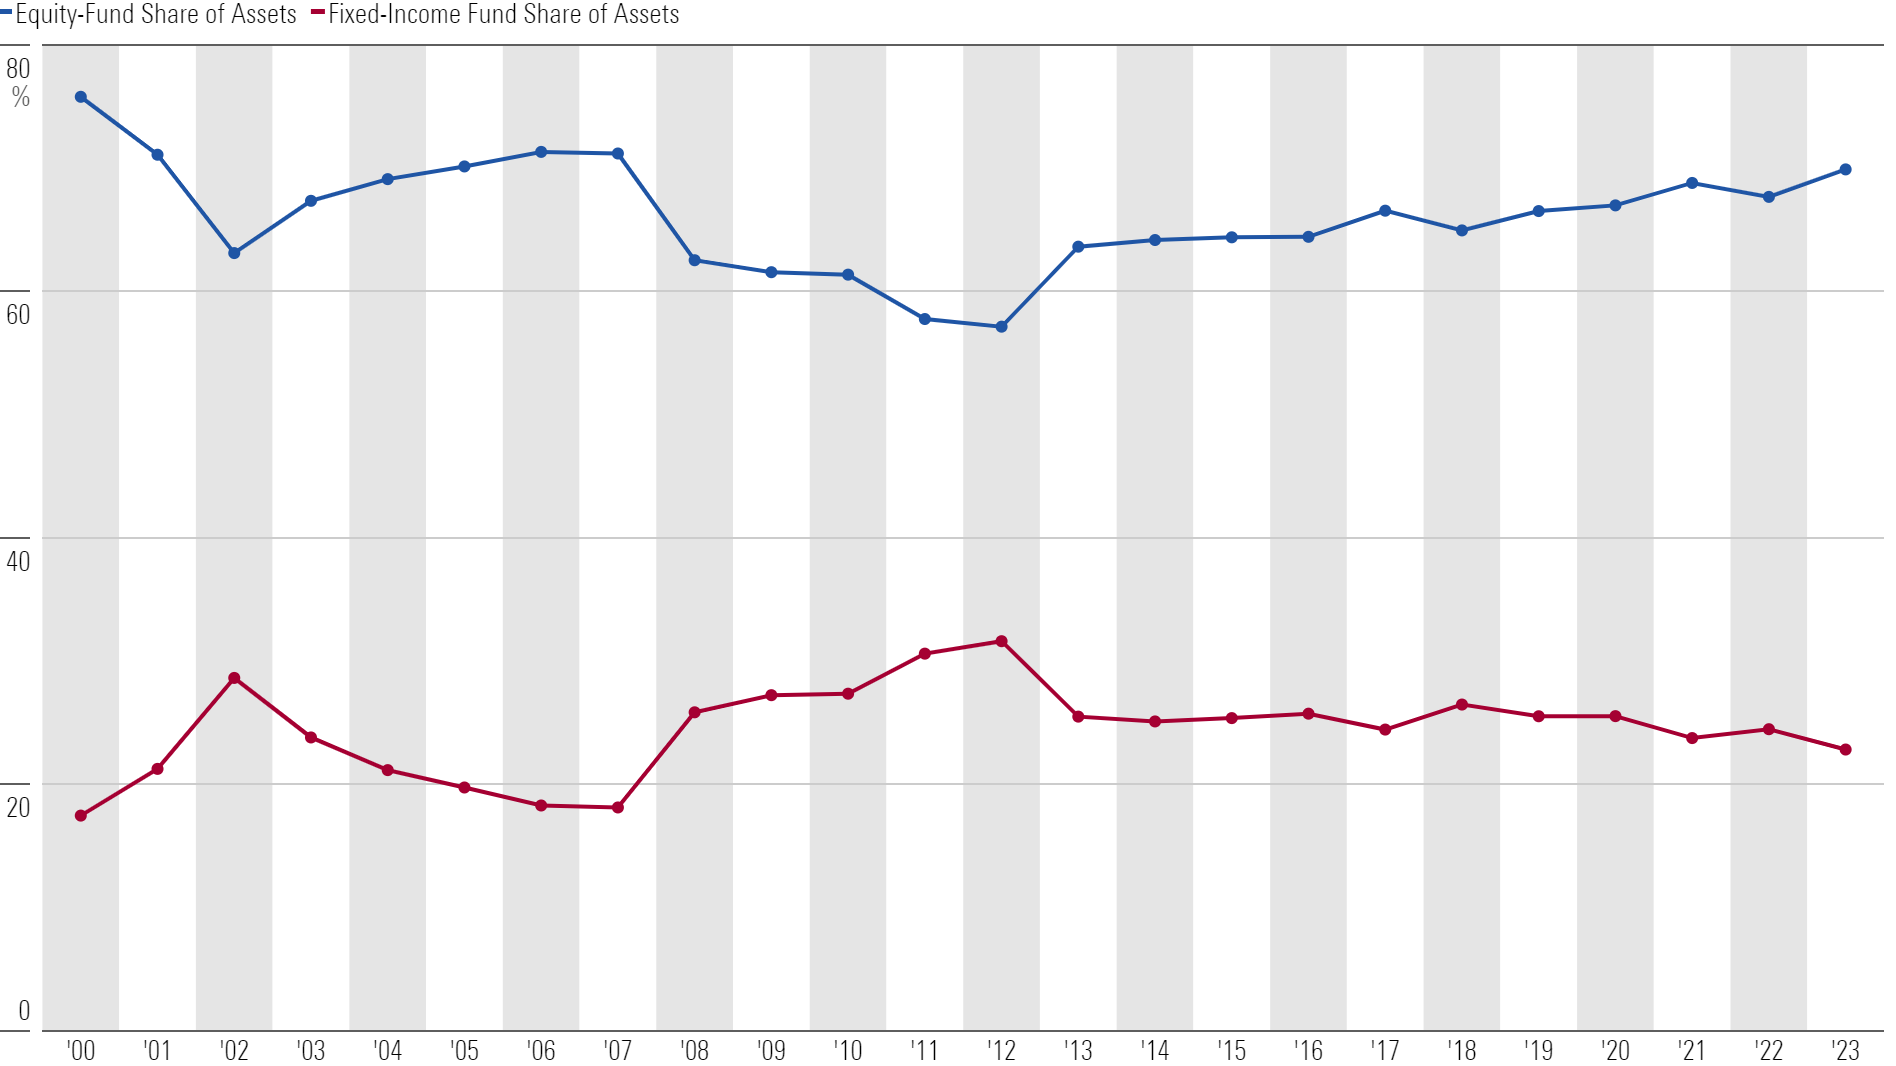
A hot year for stocks expanded equity funds’ share of total U.S. fund assets, but that wasn’t all that different from prior years. Investor activity in aggregate is typically reflective of rebalancing. That was evident in 2023, as taxable-bond funds took in more than $200 billion, while U.S. equity and sector-equity funds posted outflows and international-equity funds took in meager inflows
Historical Asset Share of Equity Funds vs. Fixed-Income Funds
Active Outflows Offset Passive Inflows in Weak Year for U.S. Equity Funds
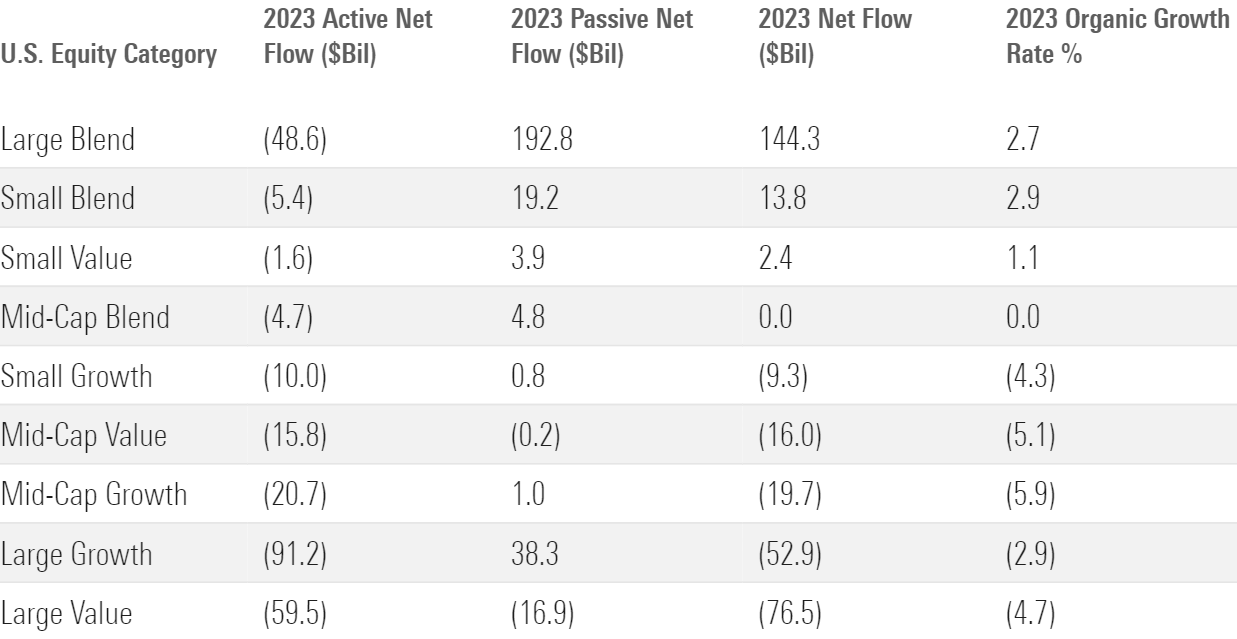
Investors were net buyers of U.S. equity funds in 2022′s horrendous market, but that reversed in 2023 as stocks recovered. U.S. equity funds saw about $14 billion leave in 2023. As usual, passive U.S. equity funds took in a large sum ($244 billion), while active funds suffered widespread net outflows ($257 billion). Active funds shed assets across all nine U.S. equity categories in 2023. Large-value funds suffered their worst year on an organic-growth basis since 2000.
2023 U.S. Equity Category Flows
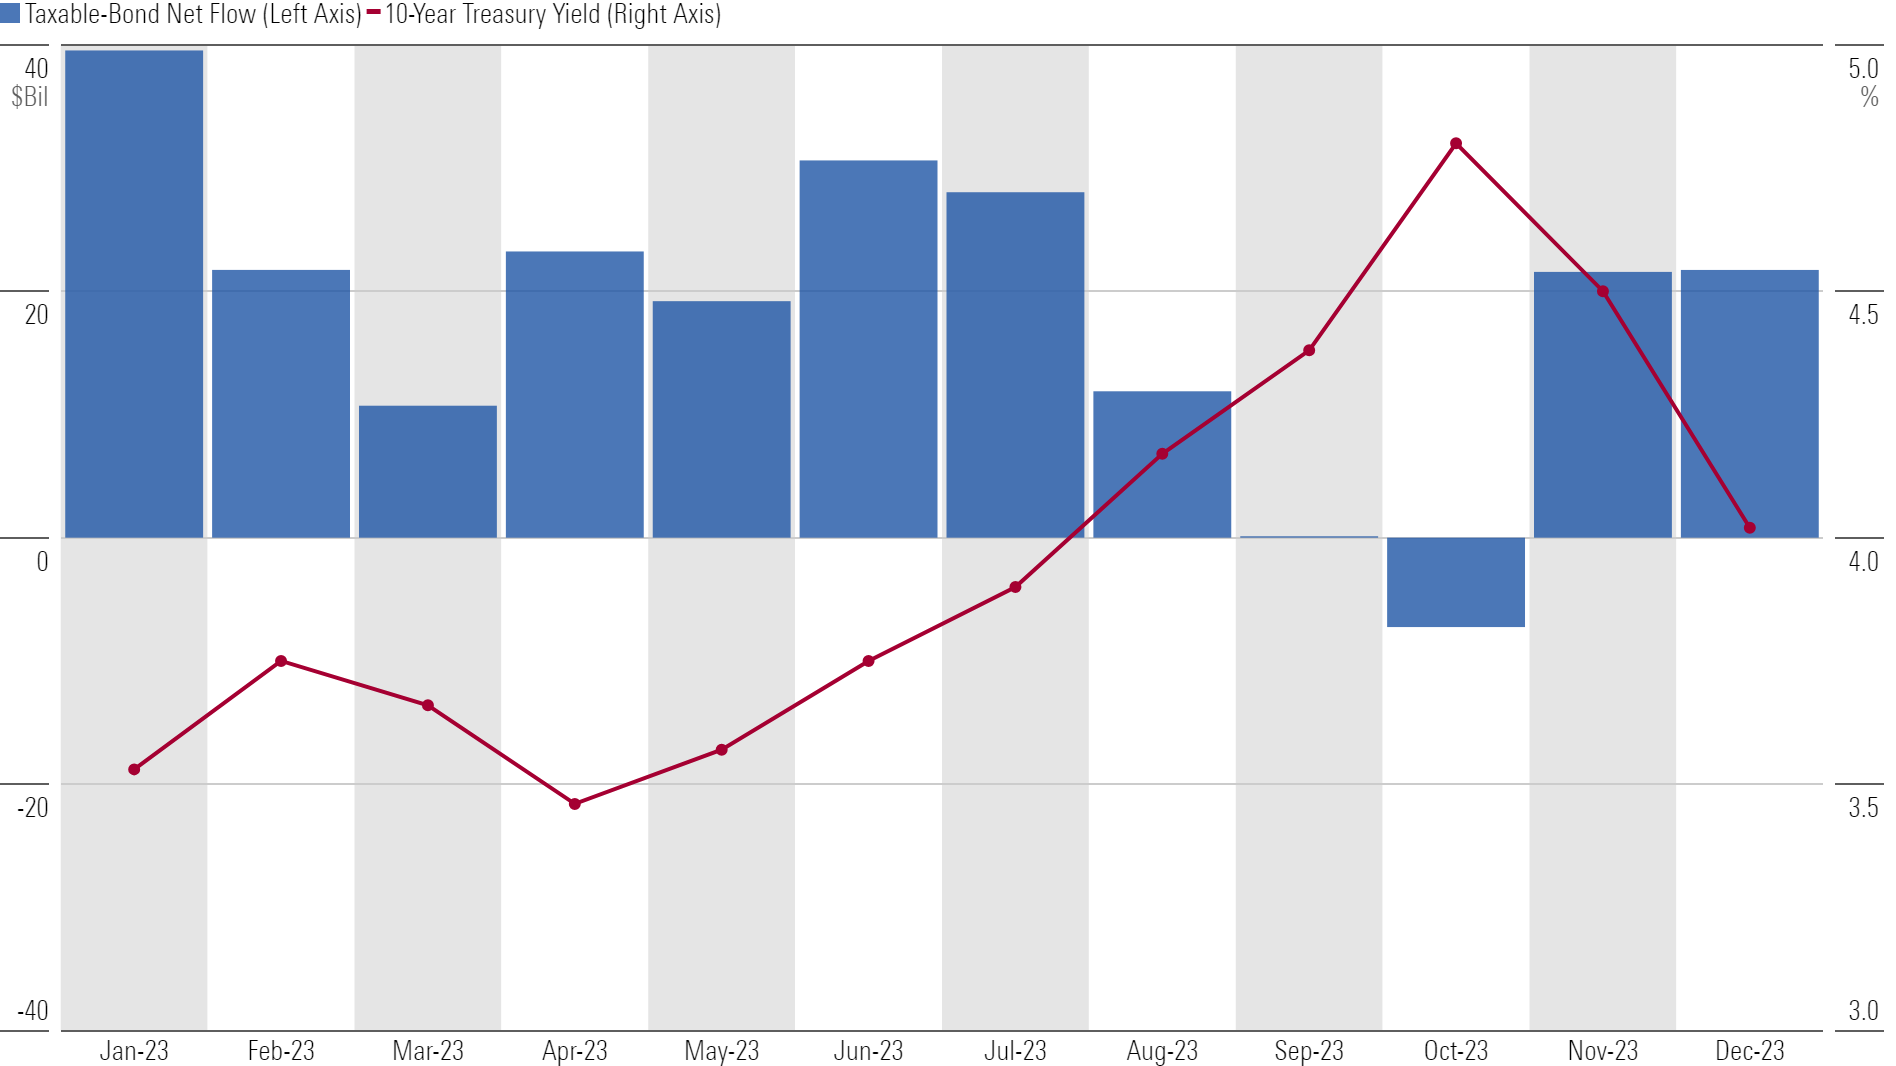
Taxable-Bond Funds Storm Back in 2023
Rising interest rates sent bond investors fleeing in 2022, but higher yields and prospects of future rate cuts brought inflows in 2023. Taxable-bond funds gathered about $220 billion on the year, a healthy sum but one that fell well short of the $400-billion-plus annual inflows from 2019 through 2021. Investors got spooked when rates peaked in the fall but otherwise were steady net buyers.
Taxable-Bond Flows in 2023
The Usual Suspects Dominated Fund Family Flows
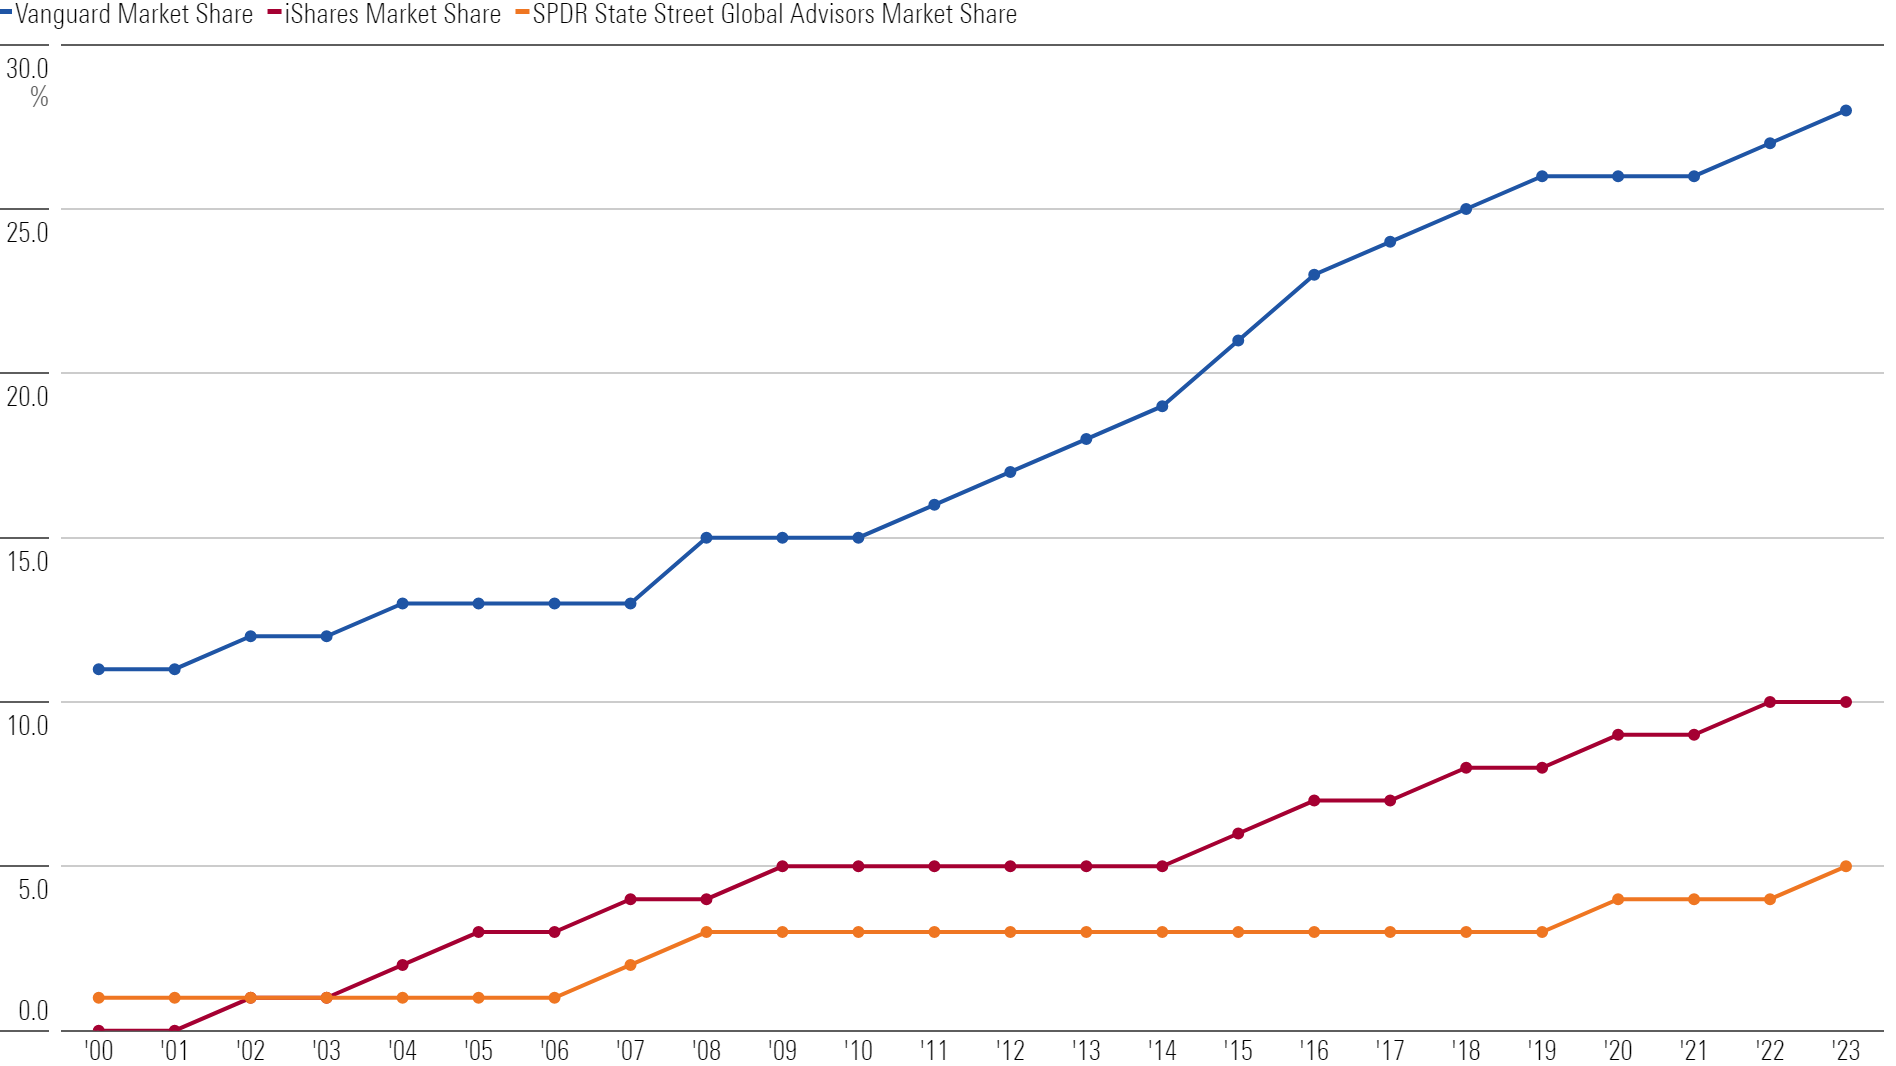
IShares gathered about $107 billion in 2023 to lead all fund families. State Street and Vanguard weren’t far behind. J.P. Morgan deserves a nod given its fourth-place finish and focus on active funds. But the times belong to passive-investing titans whose market share continues to steadily climb. As of December 2023, nearly 30% of U.S. fund assets sat with Vanguard.
Historical Fund Family Market Share
This article is adapted from the Morningstar Direct U.S. Asset Flows Commentary for December 2023. Download the full report here.
The author or authors do not own shares in any securities mentioned in this article. Find out about Morningstar’s editorial policies.
/cloudfront-us-east-1.images.arcpublishing.com/morningstar/FGC25JIKZ5EATCXF265D56SZTE.jpg)
/d10o6nnig0wrdw.cloudfront.net/04-25-2024/t_d30270f760794625a1e74b94c0d352af_name_file_960x540_1600_v4_.jpg)
/cloudfront-us-east-1.images.arcpublishing.com/morningstar/DOXM5RLEKJHX5B6OIEWSUMX6X4.png)
:quality(80)/s3.amazonaws.com/arc-authors/morningstar/96a2625e-83c2-4fdb-9fd7-0efcd07c88bb.jpg)