
7 Charts on U.S. Fund Flows in September 2023
It was the fifth month of outflows this year.
/s3.amazonaws.com/arc-authors/morningstar/96a2625e-83c2-4fdb-9fd7-0efcd07c88bb.jpg)
/s3.amazonaws.com/arc-authors/morningstar/30e2fda6-bf21-4e54-9e50-831a2bcccd80.jpg)

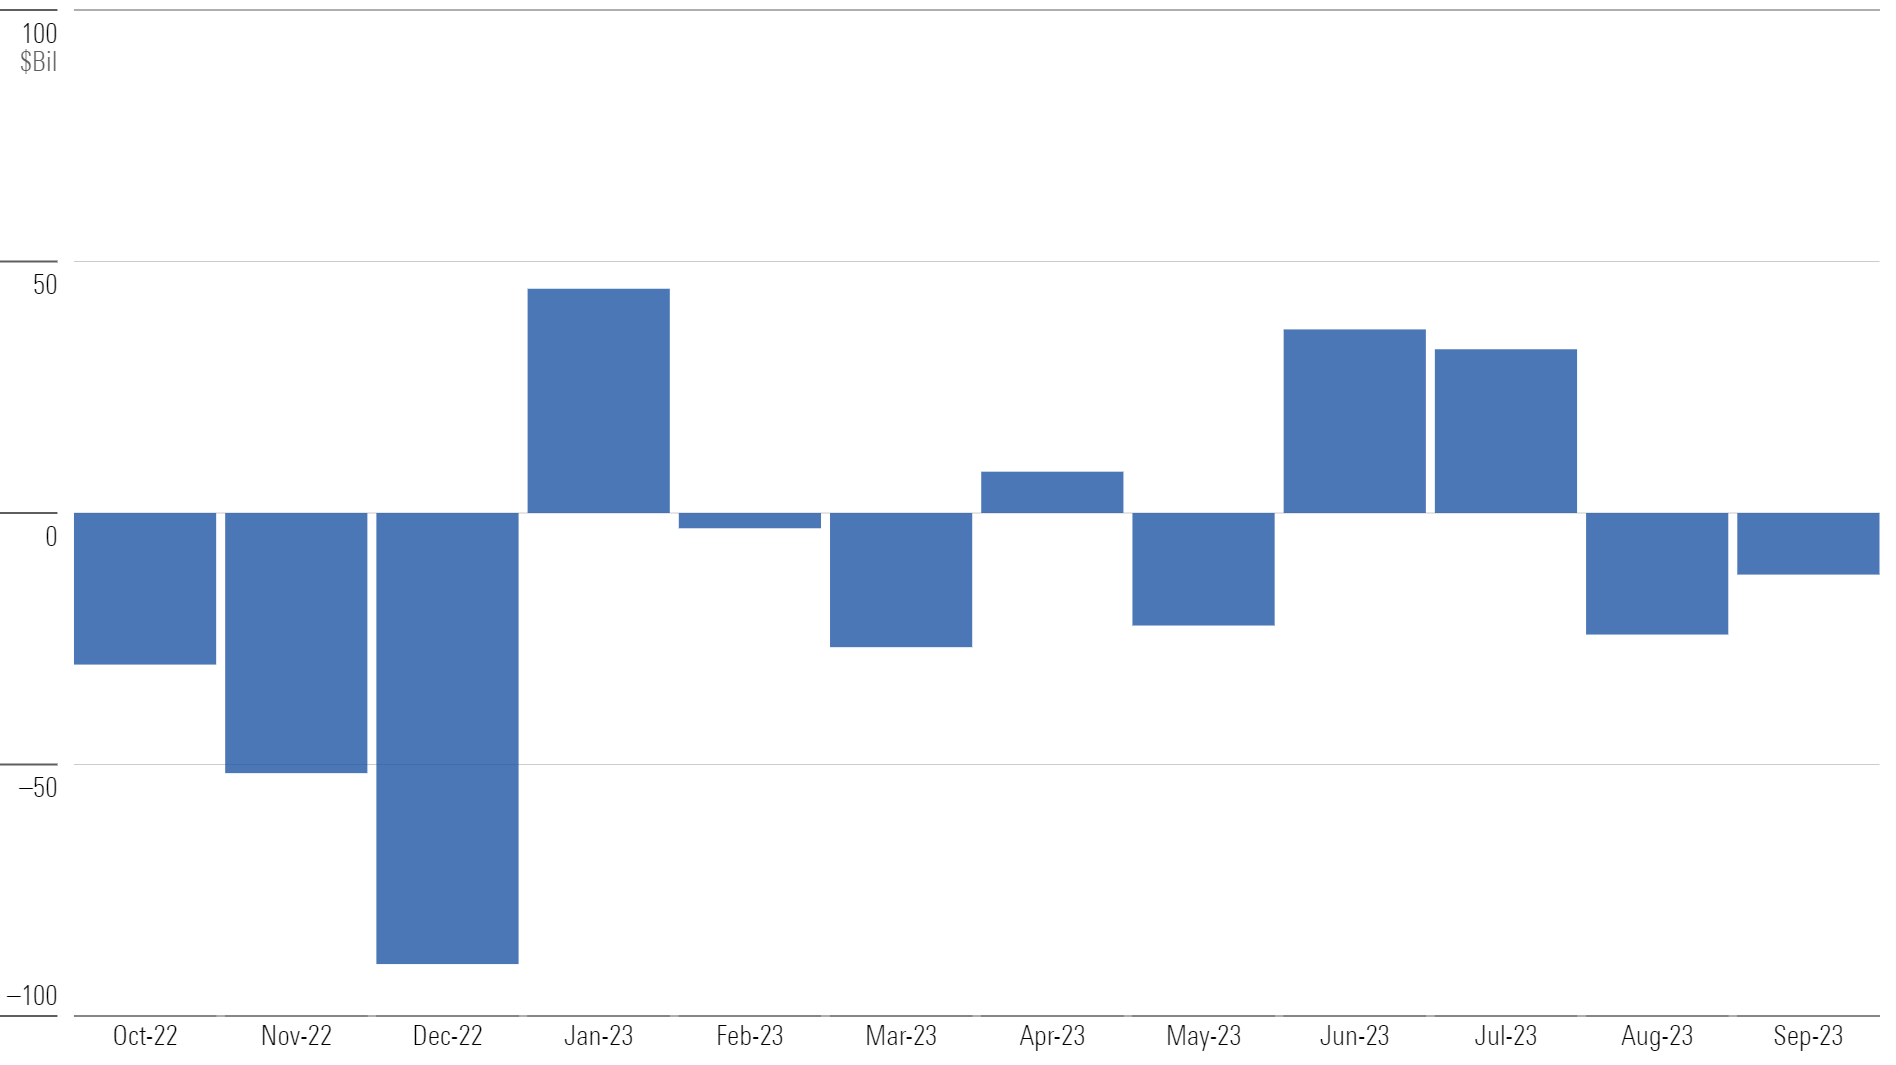
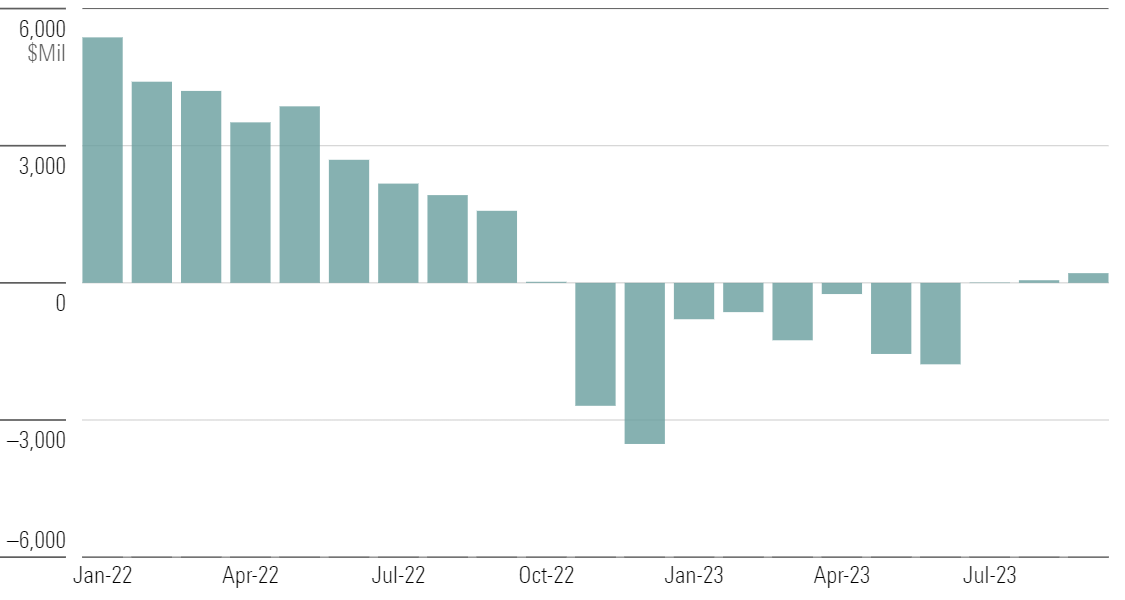
U.S. mutual funds and exchange-traded funds gave back $12 billion in September. It was the fifth month of outflows so far this year. While that doesn’t indicate that investors are running for the hills, it’s meaningful in that U.S. fund flows are typically positive. The third quarter saw nearly $4 billion in outflows.
Monthly Long-Term U.S. Fund Flows
U.S. Equity Funds Post Modest Inflows
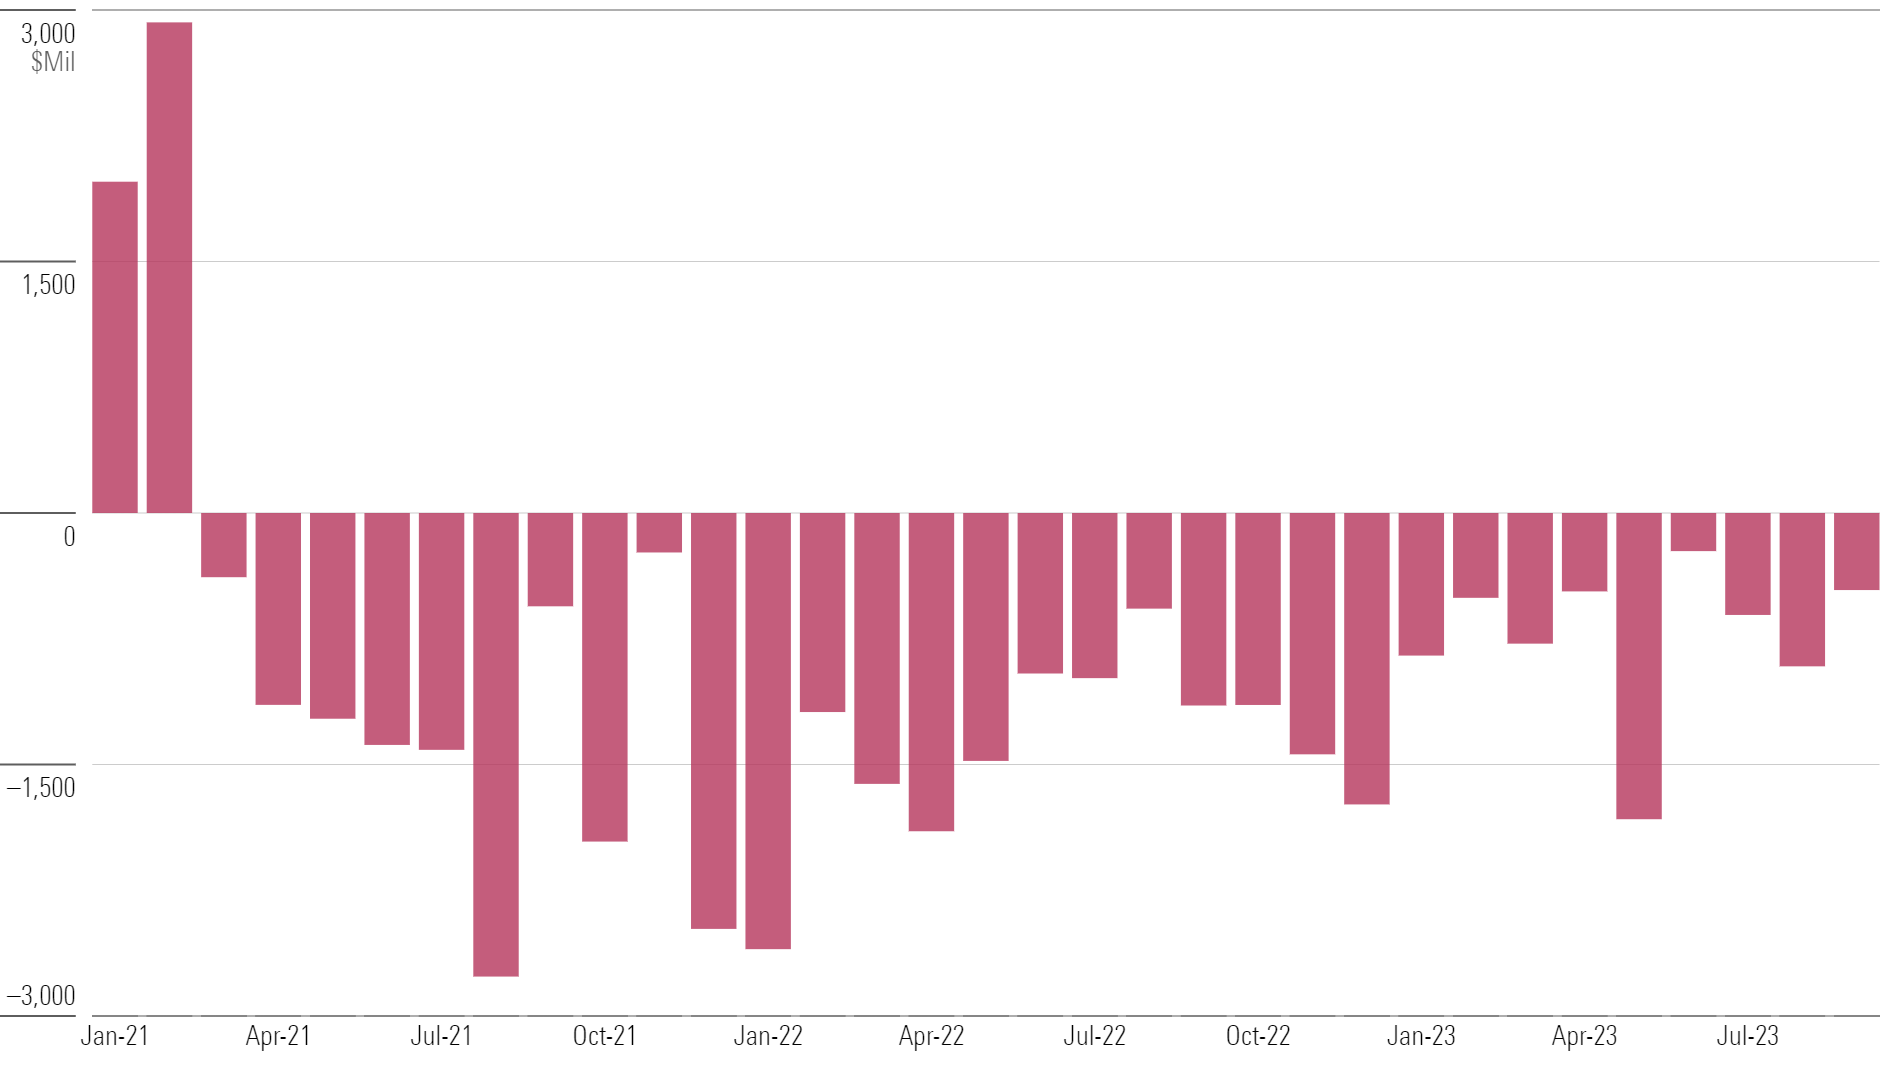
September saw about $9.8 billion flow into U.S. equity funds, but they are hardly a loved cohort. They’ve shed $100 billion during the trailing 12 months. Passive large-blend funds have been the main bright spot as investors dove into S&P 500-tracking funds. Meanwhile, certain categories skewed toward active management, such as small growth, haven’t seen monthly inflows in years.
Small-Growth Net Flows
Bond Investors Unfazed by Poor Performers
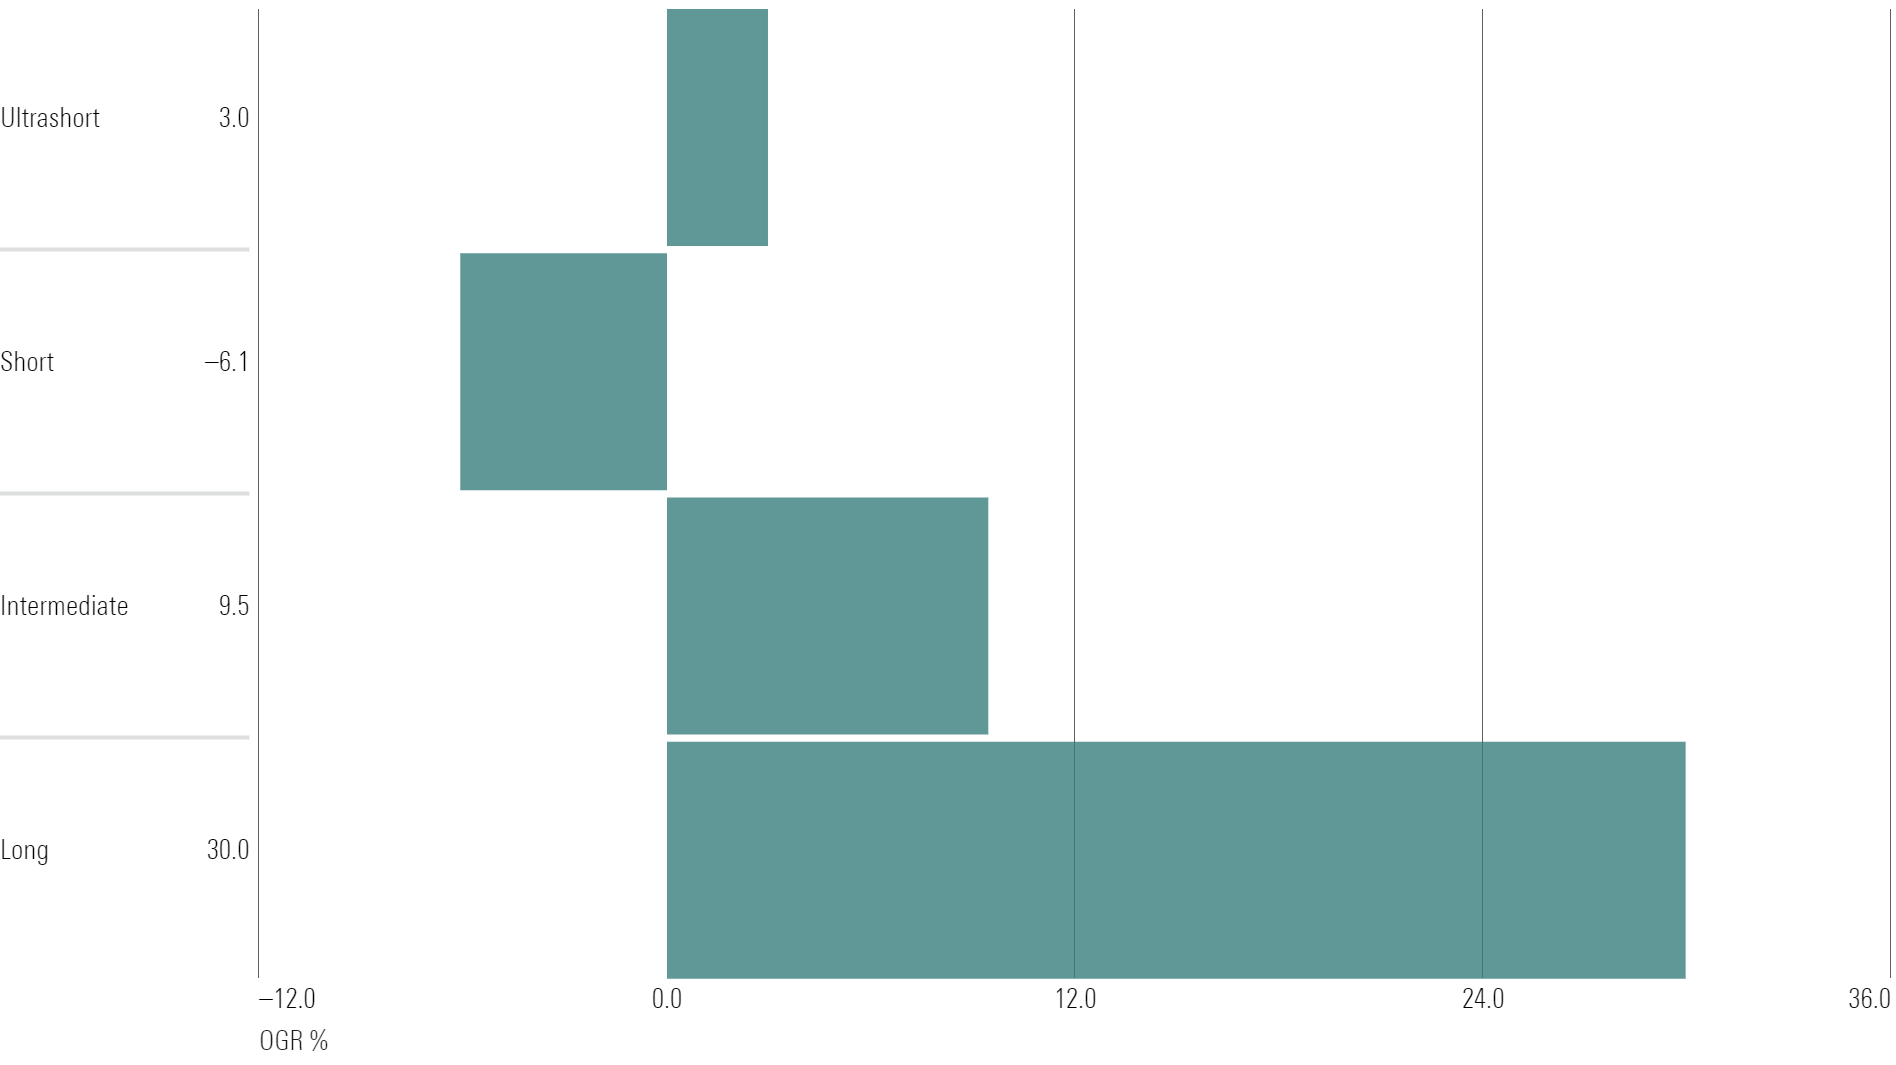
Taxable-bond funds in September endured their first outflows of 2023. That said, investors continued piling into long-term bond portfolios to lock in attractive yields. Early adopters of this trade have been punished this year as yields continued to climb through September: The Morningstar US 10+ Year Treasury Bond Index has lost 8.7% for the year to date.
Taxable-Bond Year-to-Date Organic Growth Rates
Municipal-Bond Flows Find Middle Ground
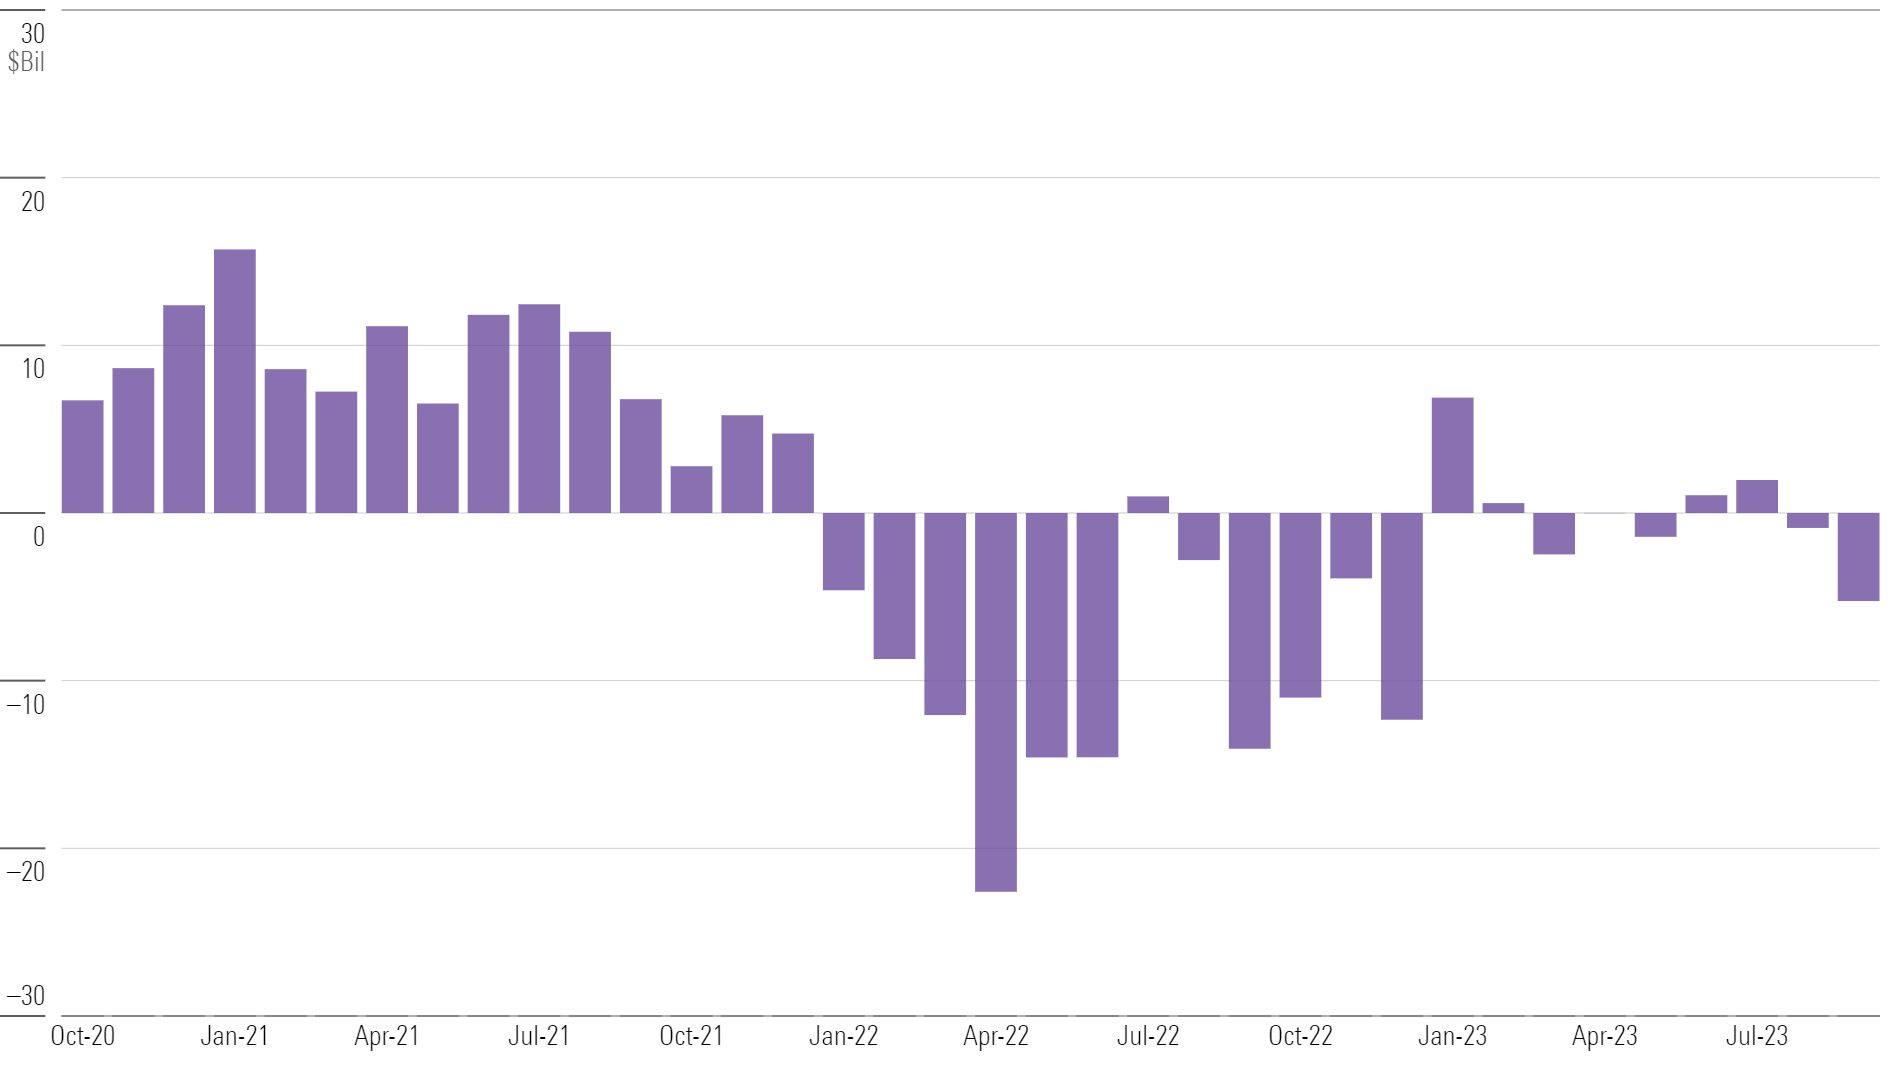
Municipal-bond funds set annual records for inflows in 2021 ($104 billion) and outflows in 2022 ($120 billion). This year has been far milder. Muni-bond funds’ net flows so far in 2023 are under $1 billion. September marked the year’s worst month for muni- and taxable-bond flows, as climbing yields sparked poor performance by funds in both cohorts.
Municipal-Bond Net Flows
Alternative Funds Potentially Turning the Corner
As interest rates continue to surprise markets to the upside, the “all-clear” signal for investors to embrace bonds and stocks has gotten murky. Alternative funds might be benefiting from that sentiment. After a streak of monthly outflows, the category group eked out a $200 million intake in September—its third consecutive month of inflows.
Alternatives Net Flows
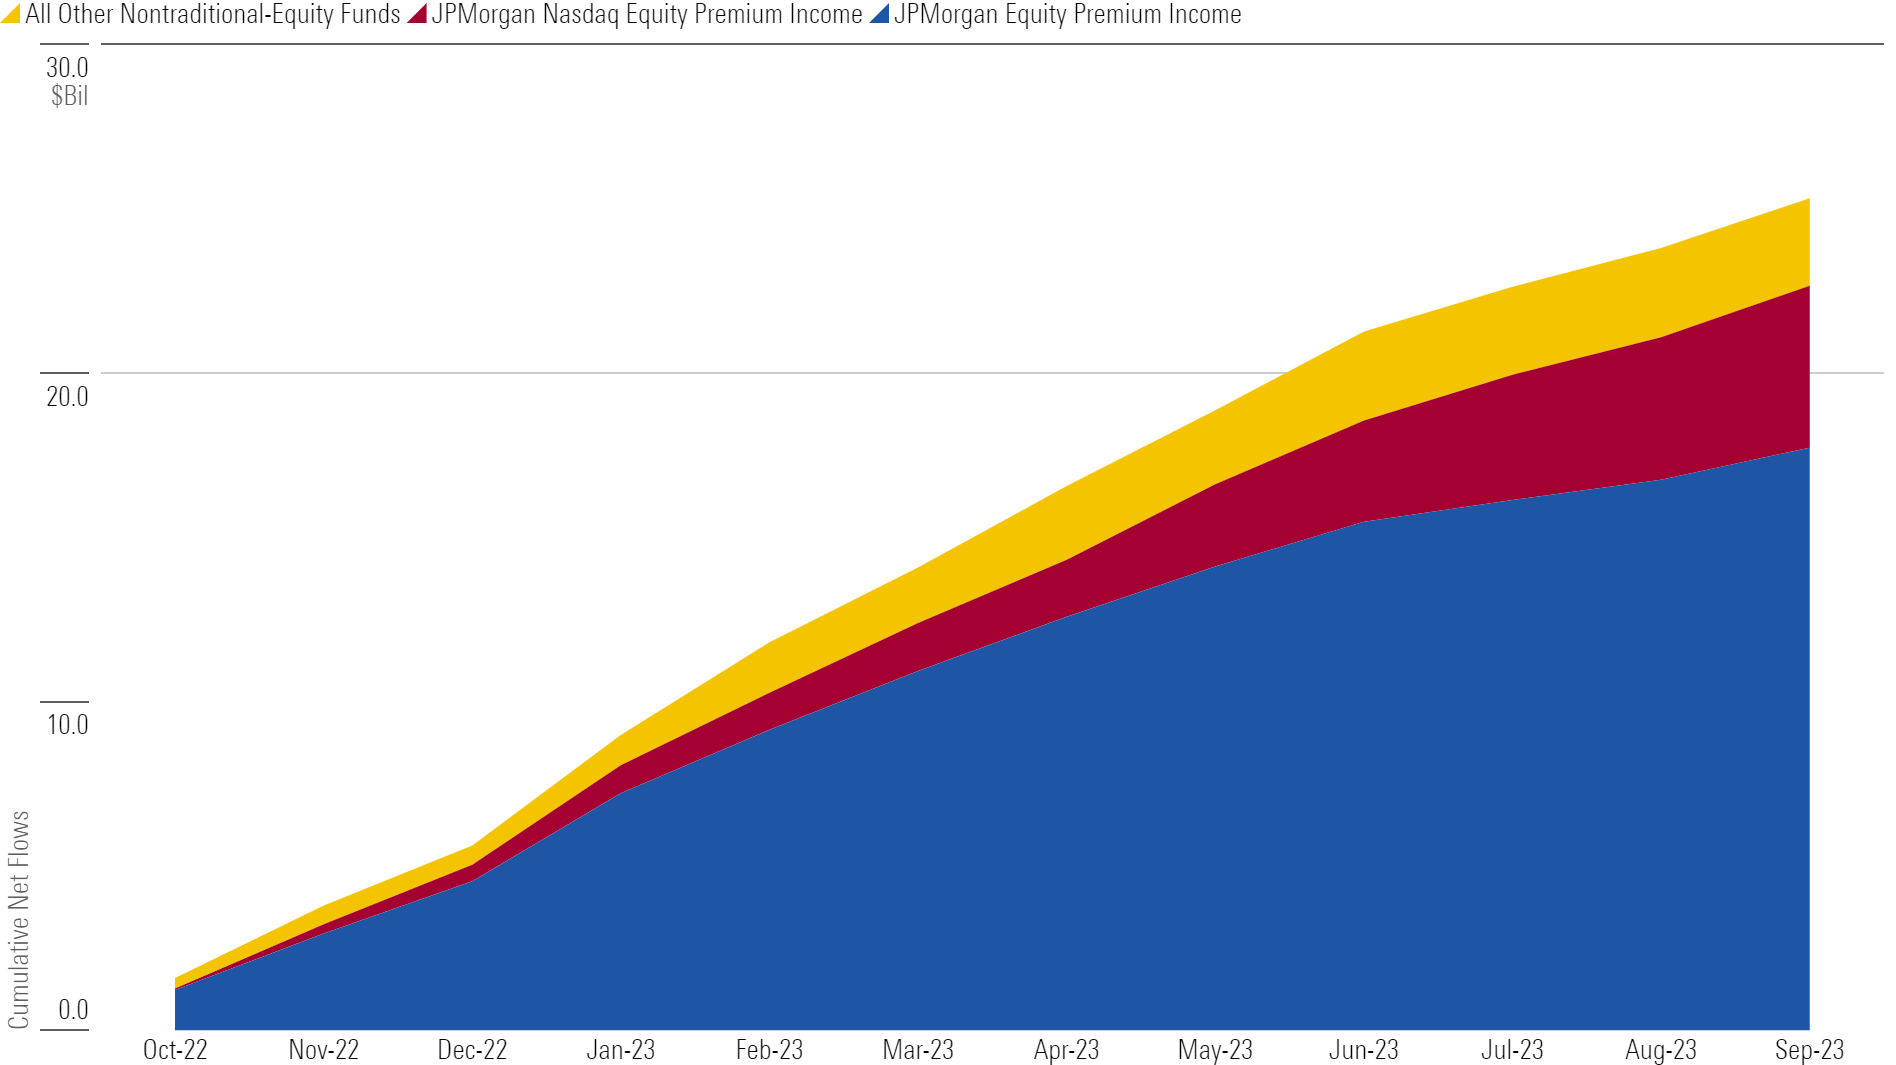
Nontraditional-Equity Isn’t a One-Man Band
JPMorgan Equity Premium Income has dominated the flows landscape, reeling in $36 billion since the ETF iteration JEPI debuted in May 2020. Now JPMorgan Nasdaq Equity Premium Income JEPQ, launched two years after its covered-call sibling, has arrived. Investors poured $4.9 billion into the fund over the 12 months through September, which easily ranked second among nontraditional-equity funds.
Nontraditional-Equity Net Flows
Hi, Fidelity
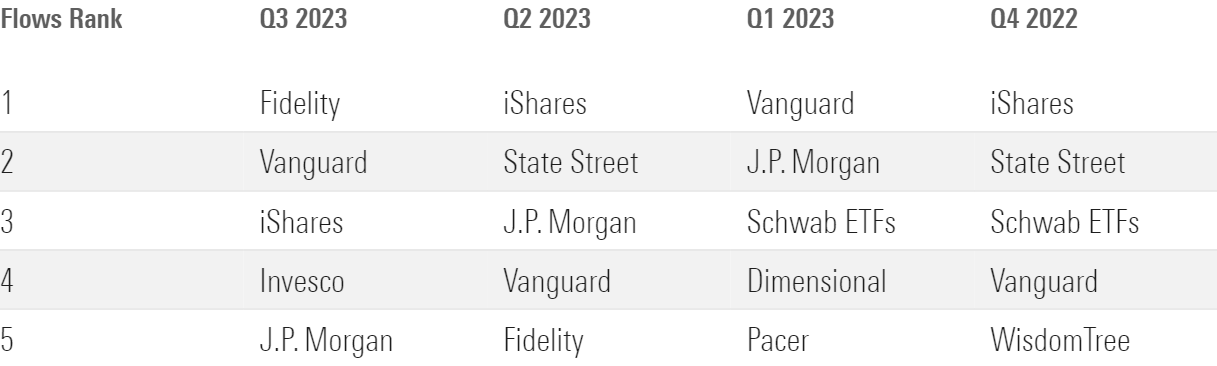
Fidelity raked in nearly $23 billion in the third quarter to lead all fund families for the first time since 1996’s first quarter. This time, Fidelity did it with passives: Investors poured more than $23 billion into its index-tracking funds and pulled about $400 million from its active ones. Fidelity 500 Index FXAIX led the resurgence, collecting nearly $8 billion during the quarter.
Fund Family Net Flows
This article is adapted from the Morningstar Direct U.S. Asset Flows Commentary for September 2023. Download the full report here.
3 Funds Whose Tax Bills Might Tick Up
Correction: A previous version of this article had incorrectly identified Fidelity 500 Index as a zero-fee fund.
The author or authors do not own shares in any securities mentioned in this article. Find out about Morningstar’s editorial policies.
/cloudfront-us-east-1.images.arcpublishing.com/morningstar/5WSHPTEQ6BADZPVPXVVDYIKL5M.png)
/cloudfront-us-east-1.images.arcpublishing.com/morningstar/OMVK3XQEVFDRHGPHSQPIBDENQE.jpg)
/cloudfront-us-east-1.images.arcpublishing.com/morningstar/BNHBFLSEHBBGBEEQAWGAG6FHLQ.png)
:quality(80)/s3.amazonaws.com/arc-authors/morningstar/96a2625e-83c2-4fdb-9fd7-0efcd07c88bb.jpg)
:quality(80)/s3.amazonaws.com/arc-authors/morningstar/30e2fda6-bf21-4e54-9e50-831a2bcccd80.jpg)