
ETFs Start Second Half With Widespread Inflows
Economic headlines bolstered stocks and sparked ETF flows in July.
/s3.amazonaws.com/arc-authors/morningstar/30e2fda6-bf21-4e54-9e50-831a2bcccd80.jpg)

Key Takeaways
- A positive economic outlook lifted the Morningstar Global Markets Index 3.77% in July.
- The Morningstar US Core Bond Index finished the month 0.08% lower than where it started.
- U.S. exchange-traded funds hauled in an estimated $60.2 billion in July, their second-best month of 2023.
- Strong flows into U.S. broad- and sector-equity funds helped stock ETFs rack up more than $45 billion of net new money.
- Fixed-income ETFs grew faster on an organic basis, led by the $6 billion that rushed into the long government Morningstar Category.
- More outflows from sustainable ETFs pushed their 2023 outflows to nearly $7 billion.
- IShares led all ETF providers with $18.6 billion of inflows, while Invesco reeled in $10.1 billion, its best haul since March 2022.
Bonds Post a Quiet Month
The exhibit below shows July returns for a sample of ETFs that serve as proxies for major asset classes. A blended portfolio generated a 2.18% return last month, as global equities rallied, but bonds took a small step back.
July Market Performance Through the Lens of Morningstar Analyst Rated ETFs
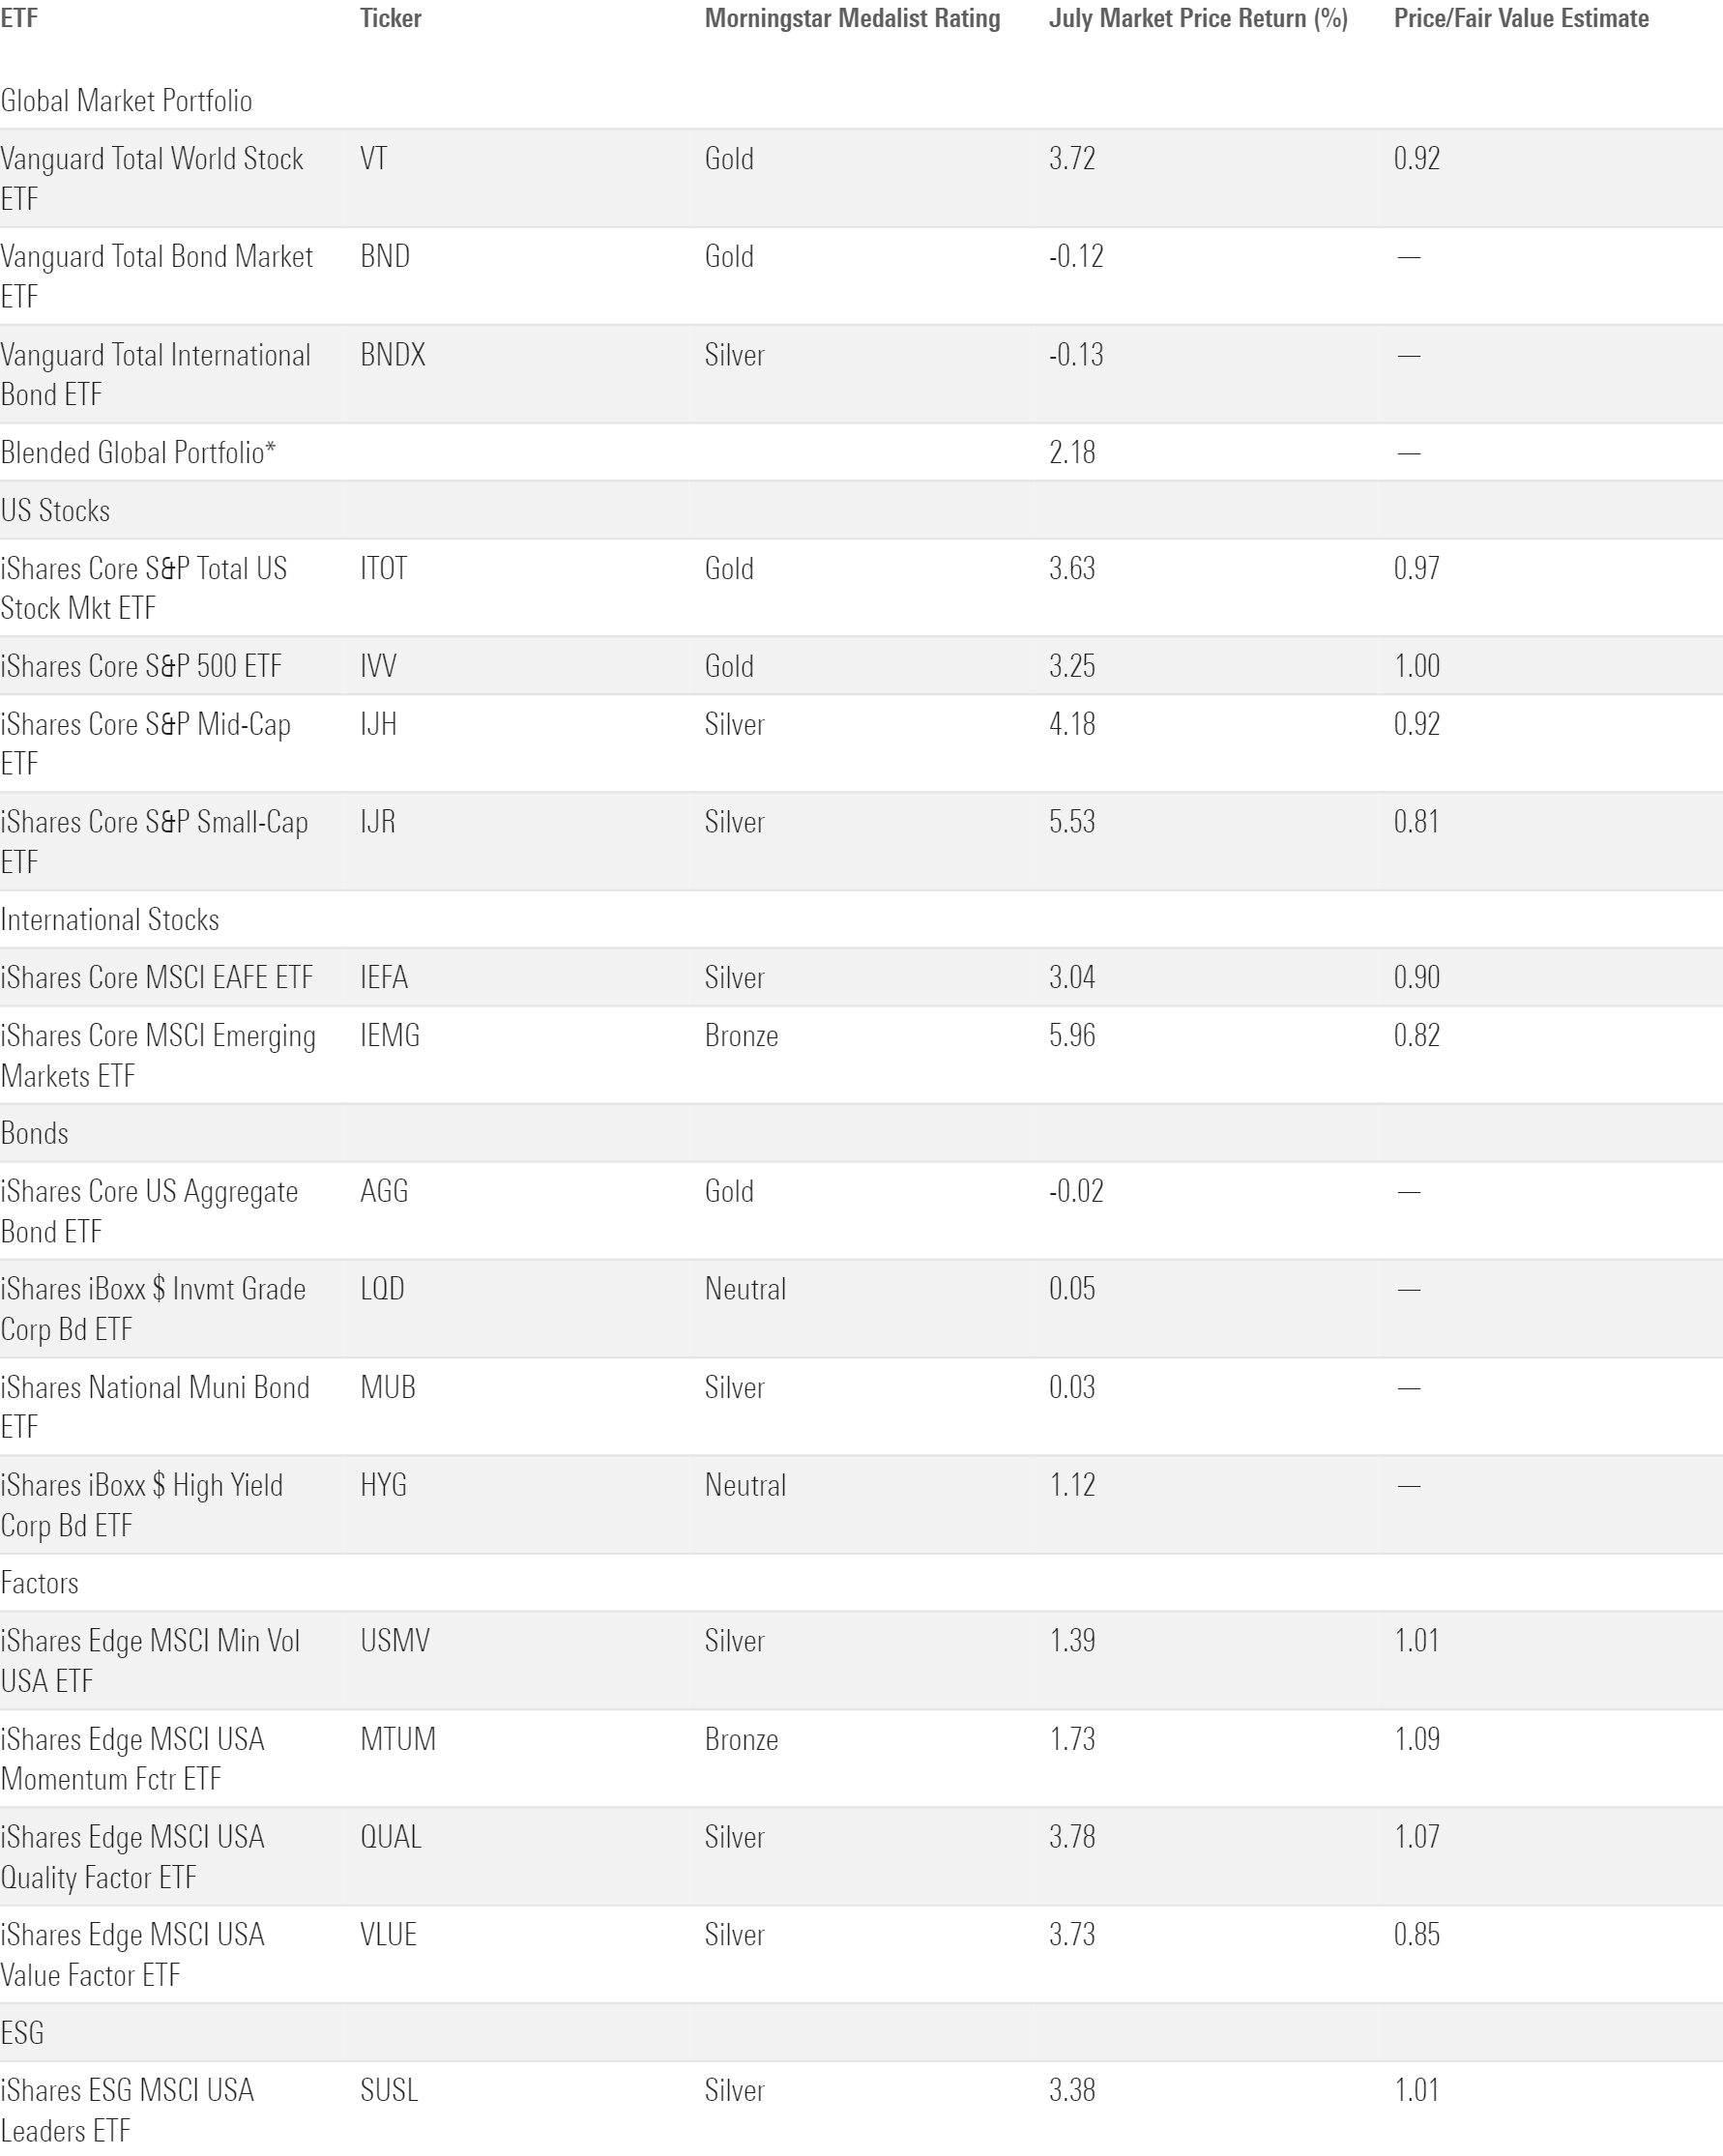
*Blended Global Portfolio represents a 60% allocation to VT, 20% allocation to BND, and 20% allocation to BNDX.
Vanguard Total Bond Market ETF BND and Vanguard International Bond ETF BNDX receded 0.12% and 0.13% last month, respectively. Bond markets have been acutely sensitive to economic data and the Federal Reserve’s responses to it, and they seemed to mull the wealth of economic news that emerged in July. As expected, the Fed raised interest rates by 25 basis points. Inflation data came in below expectations, but second-quarter economic growth data remained strong. Those contrasting results—low inflation, strong growth—fit the “soft landing” criteria that the Fed has sought since it started to hike rates.
Bond markets seemed unconvinced that the needle will thread perfectly, however, as longer-duration bond ETFs peeled back in July. IShares 20+ Year Treasury Bond ETF TLT slid 2.54%, though most short-term options, like iShares Short Treasury Bond ETF SHV, finished the month in the black. Futures markets indicate a 20% probability that another rate hike awaits at the Fed’s late-September meeting. But the climbing yields on longer-dated debt last month may suggest that more investors believe higher interest rates may persist.
The market didn’t reward interest-rate risk last month, but credit risk paid off nicely. SPDR Bloomberg High Yield Bond ETF JNK climbed 1.33% as credit spreads tightened. IShares Broad USD Investment Grade Corporate Bond ETF USIG scratched out a 0.30% gain. These segments of the bond market tend to be more correlated with stocks than government bonds, so it came as little surprise to see them rise alongside their equity counterparts in July.
Stocks Spread the Wealth
Vanguard Total World Stock ETF VT, which single-handedly constitutes the blended portfolio’s stock sleeve, climbed 3.72% in July. Vanguard Total International Stock ETF VXUS posted a 3.89%, edging out Vanguard Total Stock Market ETF VTI by 23 basis points last month.
Emerging-markets stocks, which constitute about one fifth of VXUS, powered its performance in July. IShares Core MSCI Emerging Markets ETF IEMG ascended 5.96% last month—its best month since January—while iShares Core MSCI EAFE ETF IEFA added a respectable 3.04% of its own. Excelling Asian markets were a boon for IEMG. Chinese equities have spent most of the year languishing behind the rest of the global market, but the Morningstar China Index exploded with a 9.98% gain in July. The MSCI Korea Index advanced 6.5%. Even after its strong month, VXUS remains about 6 percentage points off of VTI in 2023, and debates over the need for international stocks continue to swirl.
Stateside, a once-concentrated market rally continued to even out last month. Mega-cap growth stocks dominated the scene from January through May, but for the second consecutive month it was small caps that led the charge. IShares Core S&P Small-Cap ETF IJR gained 5.53% to beat iShares Core S&P 500 ETF IVV by 2.28 percentage points in July. Strong economic growth likely benefited IJR more acutely than IVV, as small-cap stocks tend to be more sensitive than their more-established brethren.
Vanguard Value ETF VTV squeezed past Vanguard Growth ETF VUG by 10 basis points in July, just the second month this year it bested its richer foil. It was largely a sector story. Soaring oil prices helped energy stocks—which constituted 8% of VTV but only 1% of VUG—lead all sectors in July. Energy Select Sector SPDR ETF XLE advanced a lotterylike 7.77% in July, clawing itself into positive-return territory for the year to date.
Financials stocks fared well, too. Financial Select Sector SPDR ETF XLF gained 4.81% behind stellar earnings reports from banks. JPMorgan Chase JPM, Bank of America BAC, and Wells Fargo WFC climbed between 8% and 12% each after reporting strong net interest income and trading revenue results. Further down the market-cap ladder, midtier regional banks had an excellent month as well: Buy-the-dip cult favorite Invesco KBW Bank ETF KBWB soared 11.6%. It still traded roughly 20% lower than it did six months ago, though, as it tries to piece together the fragments from regional-bank implosions in March.
Checking in on Factors
IShares MSCI USA Quality Factor ETF QUAL has been the crown jewel of iShares’ suite of single-factor funds in 2023. After tacking on a fresh 3.78% July gain, its year-to-date return stood at 23.57%, about 3 percentage points ahead of the Morningstar US Market Index and 15 percentage points of the next-closest iShares factor fund (iShares MSCI USA Value Factor VLUE). Heavier stakes in a handful of this year’s standout performers—namely Nvidia NVDA and Meta Platforms META—underpinned its sparkling returns.
IShares MSCI USA Momentum Factor ETF MTUM has not had the same success. It is sensibly constructed, but horrible rebalance timing luck has continually left it flat-footed over the past three years, a span in which it ranked in the bottom 10% of large-growth funds. The most recent hard-luck rebalance came in May 2023, when the fund cut back on languishing value companies and doubled its exposure to red-hot growth stocks. It was a little late; the Morningstar US Value and Growth indexes posted nearly identical returns over the subsequent two months. It is difficult for momentum strategies to keep up when market regimes flip-flop, and MTUM has borne the brunt of that in recent years.
Stock ETF Flows Stay Hot
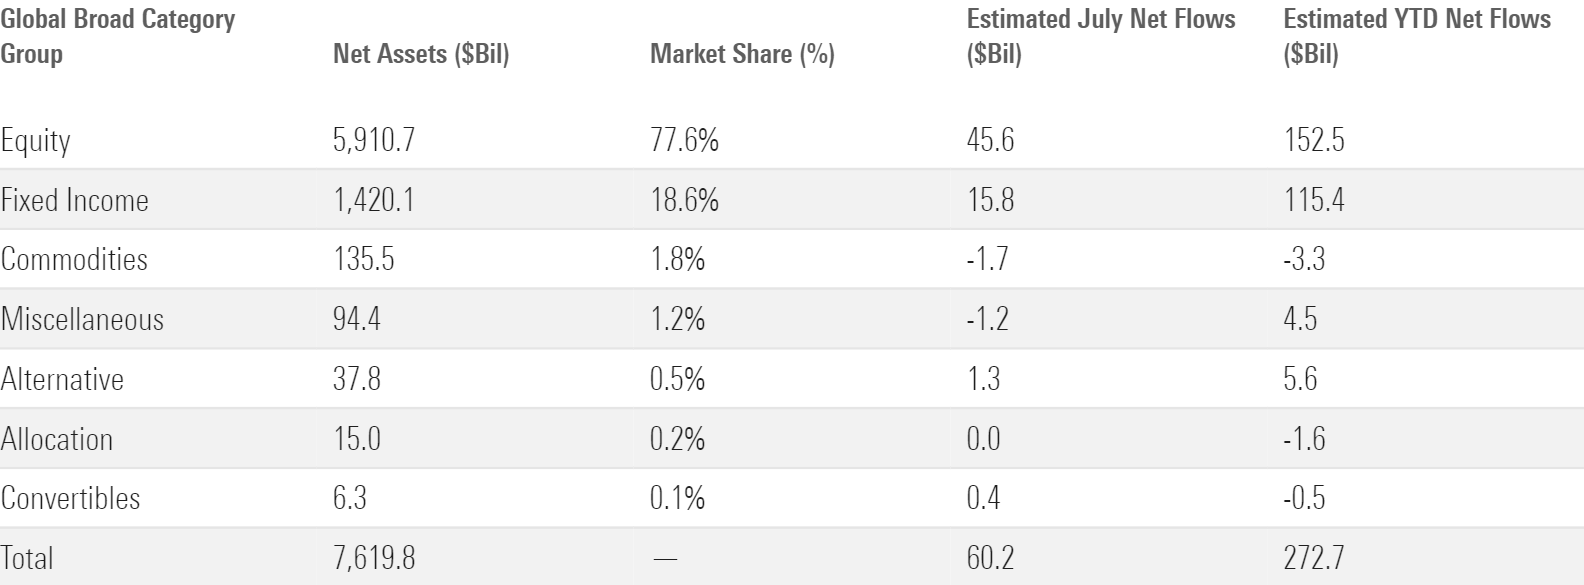
Equity ETFs notched another solid month of inflows, collecting $45.6 billion on the heels of their $56 billion breakout in June. U.S. stock funds collected $29.4 billion of that money. It comes as little surprise that large-blend strategies set the pace ($16.4 billion of inflows), but there was some divergence among the category’s heaviest hitters. IVV led all ETFs by collecting $11 billion, while SPDR S&P 500 ETF Trust SPY shed $3 billion to finish July last among all equity strategies.
July Flows Across Morningstar Broad Category Groups
Investors’ interest in U.S. stocks extended beyond the top rung of the market-cap ladder. The six categories that make up the mid- and small-cap U.S. market collectively absorbed $6.8 billion last month after collecting just $6.2 billion over the prior six months. The mid-cap blend segment hauled in $3.9 billion behind strong inflows into Invesco S&P 500 Equal Weight ETF RSP; its balanced portfolio may have attracted investors growing wary of the market’s top-heavy first-half performance.
After a brutal first half with nearly $19 billion of outflows, sector equity ETFs started the year’s second act on the right foot. They reeled in $7.9 billion in July, their best month of flows since October 2022. Financials sector ETFs led the pack with $2.6 billion of net new money. Industrials and energy pulled in $1.6 billion and $1.3 billion, respectively, while healthcare ETFs weighed on the cohort with about $1.3 billion in outflows.
Bond ETF Flows Remain Consistent
Fixed-income ETFs ruled the first half. Though their $98 billion first-half inflow fell a bit short of equity ETFs in absolute terms, their 7.7% organic growth rate was far stronger. Bond ETFs continued to punch above their weight in July, reeling in $15.8 billion of fresh investment.
Morningstar Categories With the Largest July Flows
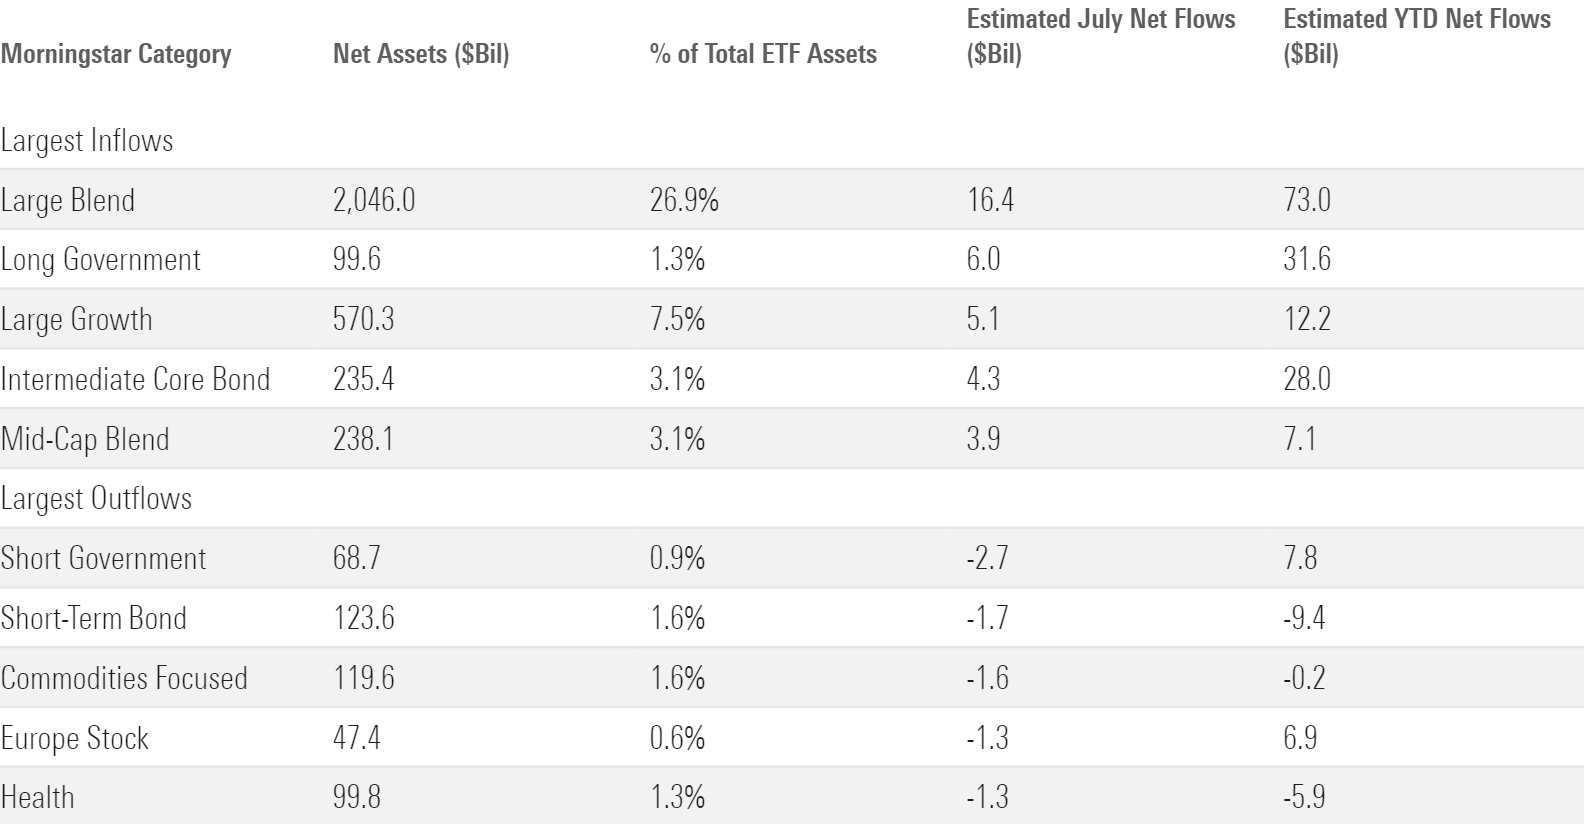
Investors favored the nearest and furthest ends of the yield curve in July. The long government category led the way with $6 billion of inflows. It now leads all bond categories in year-to-date inflows with $31.6 billion, a remarkable feat for a group that entered 2023 with about $69 billion under management (46% OGR). Ultrashort bond ETFs accumulated a solid $3.6 billion of their own in July. Short-term territory seems to be the sour spot for ETF flows: The short-term bond and short government categories shed $4.4 billion between them in July. That clinched short-term bond funds’ sixth straight month of outflows, a span over which they’ve shed more than $9 billion.
ETFs With the Largest July Flows
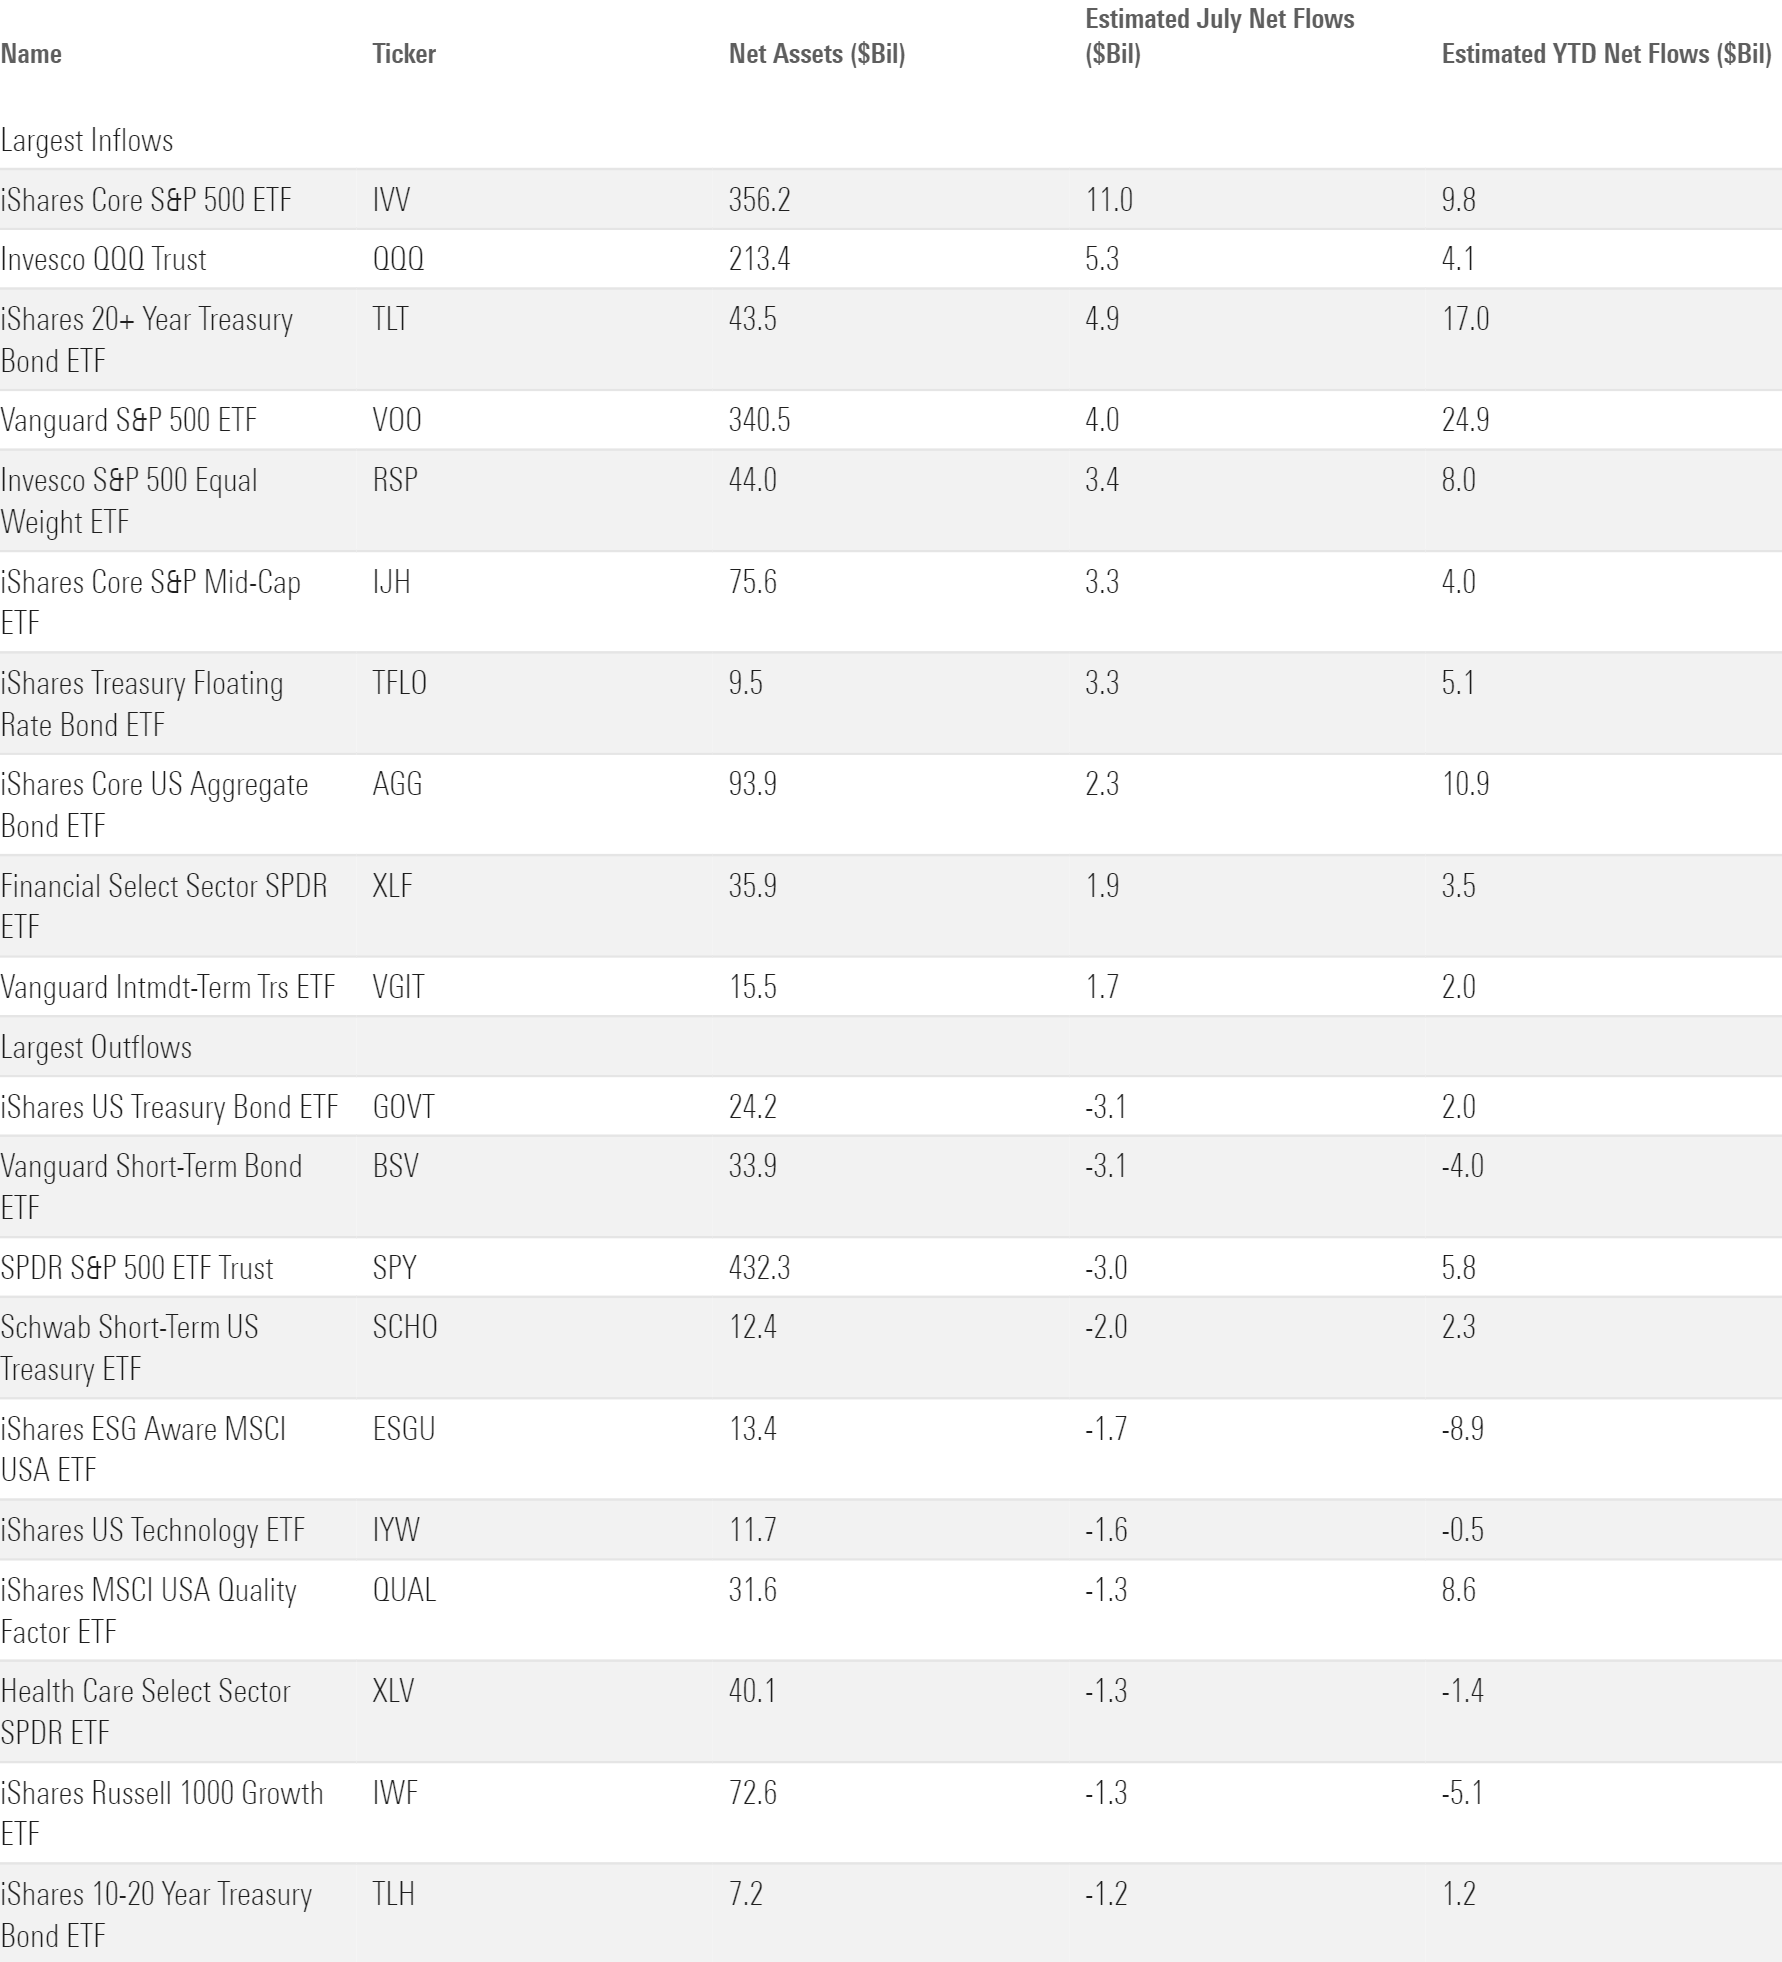
Tightening credit spreads may have propelled riskier bond strategies back into investors’ good graces. High-yield bond ETFs absorbed about $1.5 billion in July, continuing a solid recovery that followed a disastrous start to the year. After bleeding $8.6 billion in the first quarter—the worst among all categories—the funds have welcomed $6.2 billion since. Corporate bonds saw similar success. The category reeled in a fresh $1 billion of its own, lifting its organic growth rate to 9.9% on the year.
Booming Buffer Funds
Defined outcome ETFs, also known as buffer funds, have been on a tear over the past 18 months. These strategies use equity options on an underlying index to protect investors’ downside when the market drops (though that caps their upside during rallies). Morningstar’s defined outcome primer breaks down the mechanics further. These funds burst onto the scene during the bear market in 2022, and their popularity has only grown since. The options trading category in which they sit has reeled in nearly $5.7 billion this year after a fresh $1.3 billion July haul. That translates into a cool 25.3% organic growth rate for the year to date through July. Whether these funds prove to be a legitimate force or flavor of the moment remains to be seen, but they have undoubtedly carved out a niche in the ETF ecosystem.
Sustainable Slowdown
Sustainable ETFs were once the hot new item on the ETF shelves, but flows into these products ground to a halt and reversed. In July, these funds shed $1.2 billion, equivalent to roughly 1.2% of their asset base. IShares ESG Aware MSCI USA ETF ESGU leaked $1.7 billion itself, pushing its year-to-date outflow to $8.9 billion, the most among all ETFs on the market. ESGU is a fairly broad, light-touch sustainable fund, but the story hasn’t been much different for narrower impact strategies. Funds listed under the “energy transition” theme have collectively shed $892 million in 2023, though “resource management” funds have gathered $202 million. A market-share cannibal as recently as two years ago, sustainable ETFs have hit a rough patch in 2023.
IShares Takes a New Way to the Top
IShares led all ETF providers with $18.6 billion of inflows in July. IShares’ bond ETFs have bolstered the firm all year—their $47 billion first-half inflows concealed the stock lineup’s $19 billion of outflows—but the equity offerings stepped up in July. Behind robust inflows into the core U.S. lineup (IVV, iShares Core S&P Mid-Cap ETF IJH), the iShares stock ETFs pulled in $9.7 billion, while the steady fixed-income suite came through with a $9.3 billion haul of its own. For iShares to catch Vanguard in the 2023 flows race, it will need to build on the stock ETF flow momentum that started this summer.
July Flows for the 10 Largest ETF Providers
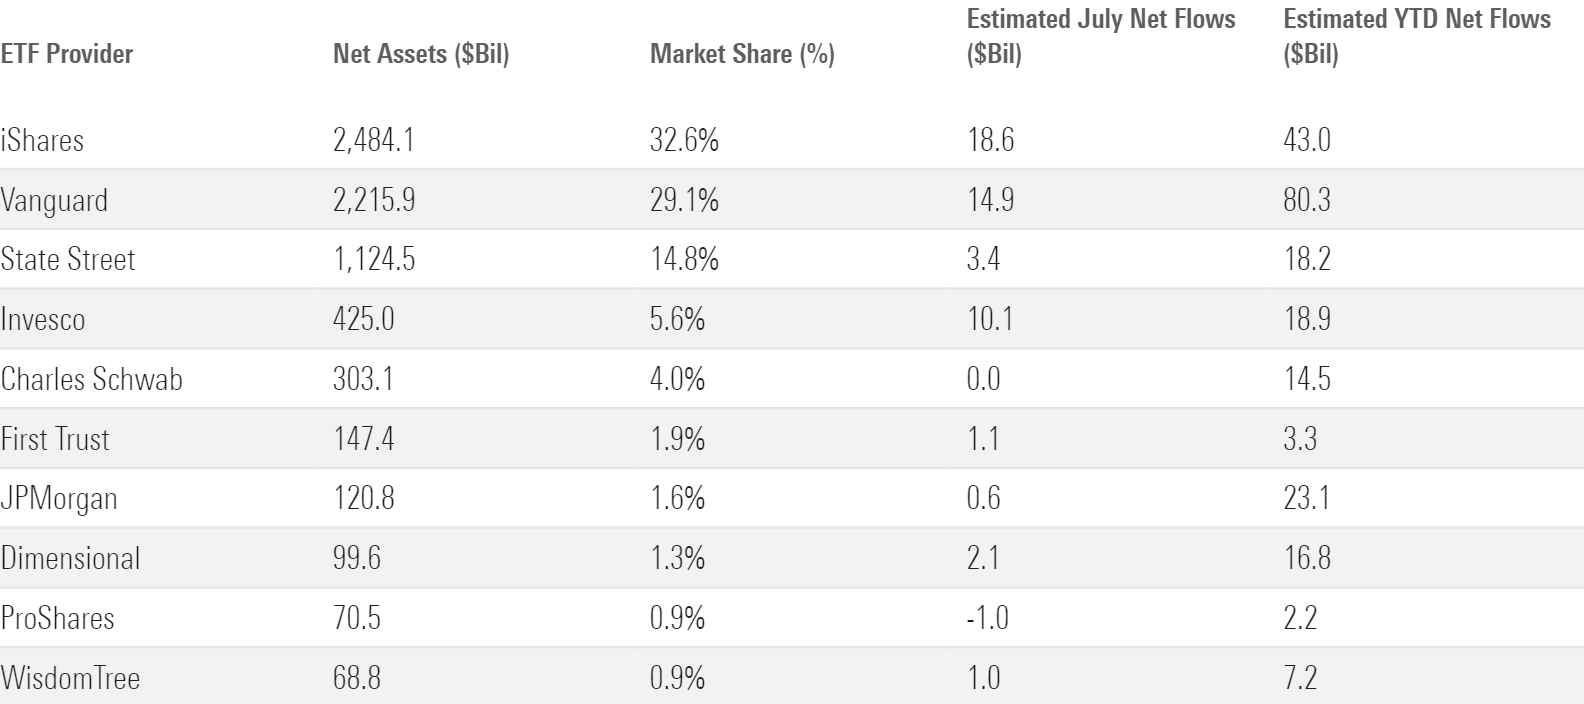
Invesco raked in $10.1 billion in July, exceeding its total inflows from the first half. Most of the new money rushed into Invesco QQQ Trust QQQ ($5.3 billion) and RSP ($3.4 billion). The Nasdaq-100 Index, the benchmark that QQQ tracks, underwent a rare special rebalance in July, and the flows indicate that investors approved of the intervention. Invesco’s excellent month catapulted it past Dimensional, State Street, and Charles Schwab, and into fourth place in the 2023 ETF flows standings.
A bounceback month for sector ETFs likely aided flows for Van Eck, which stashes about 55% of its total assets in sector- or industry-level portfolios. Products like VanEck Semiconductor ETF SMH posted solid inflows that propelled Van Eck to its most lucrative month since June 2021. The 11th-largest ETF provider, Van Eck finished July about $6 billion behind 10th-place WisdomTree. A sector ETF resurgence could give it a chance to bridge the gap and crack the top 10.
Small Caps on Sale
The fair value estimate for ETFs rolls up our equity analysts’ fair value estimates for individual stocks and our quantitative fair value estimates for stocks not covered by Morningstar analysts into an aggregate fair value estimate for stock ETF portfolios. Dividing an ETF’s market price by this value yields its price/fair value ratio. This ratio can point to potential bargains and areas of the market where valuations are stretched.
The 10 Most Under- and Overvalued Broad-Based ETFs
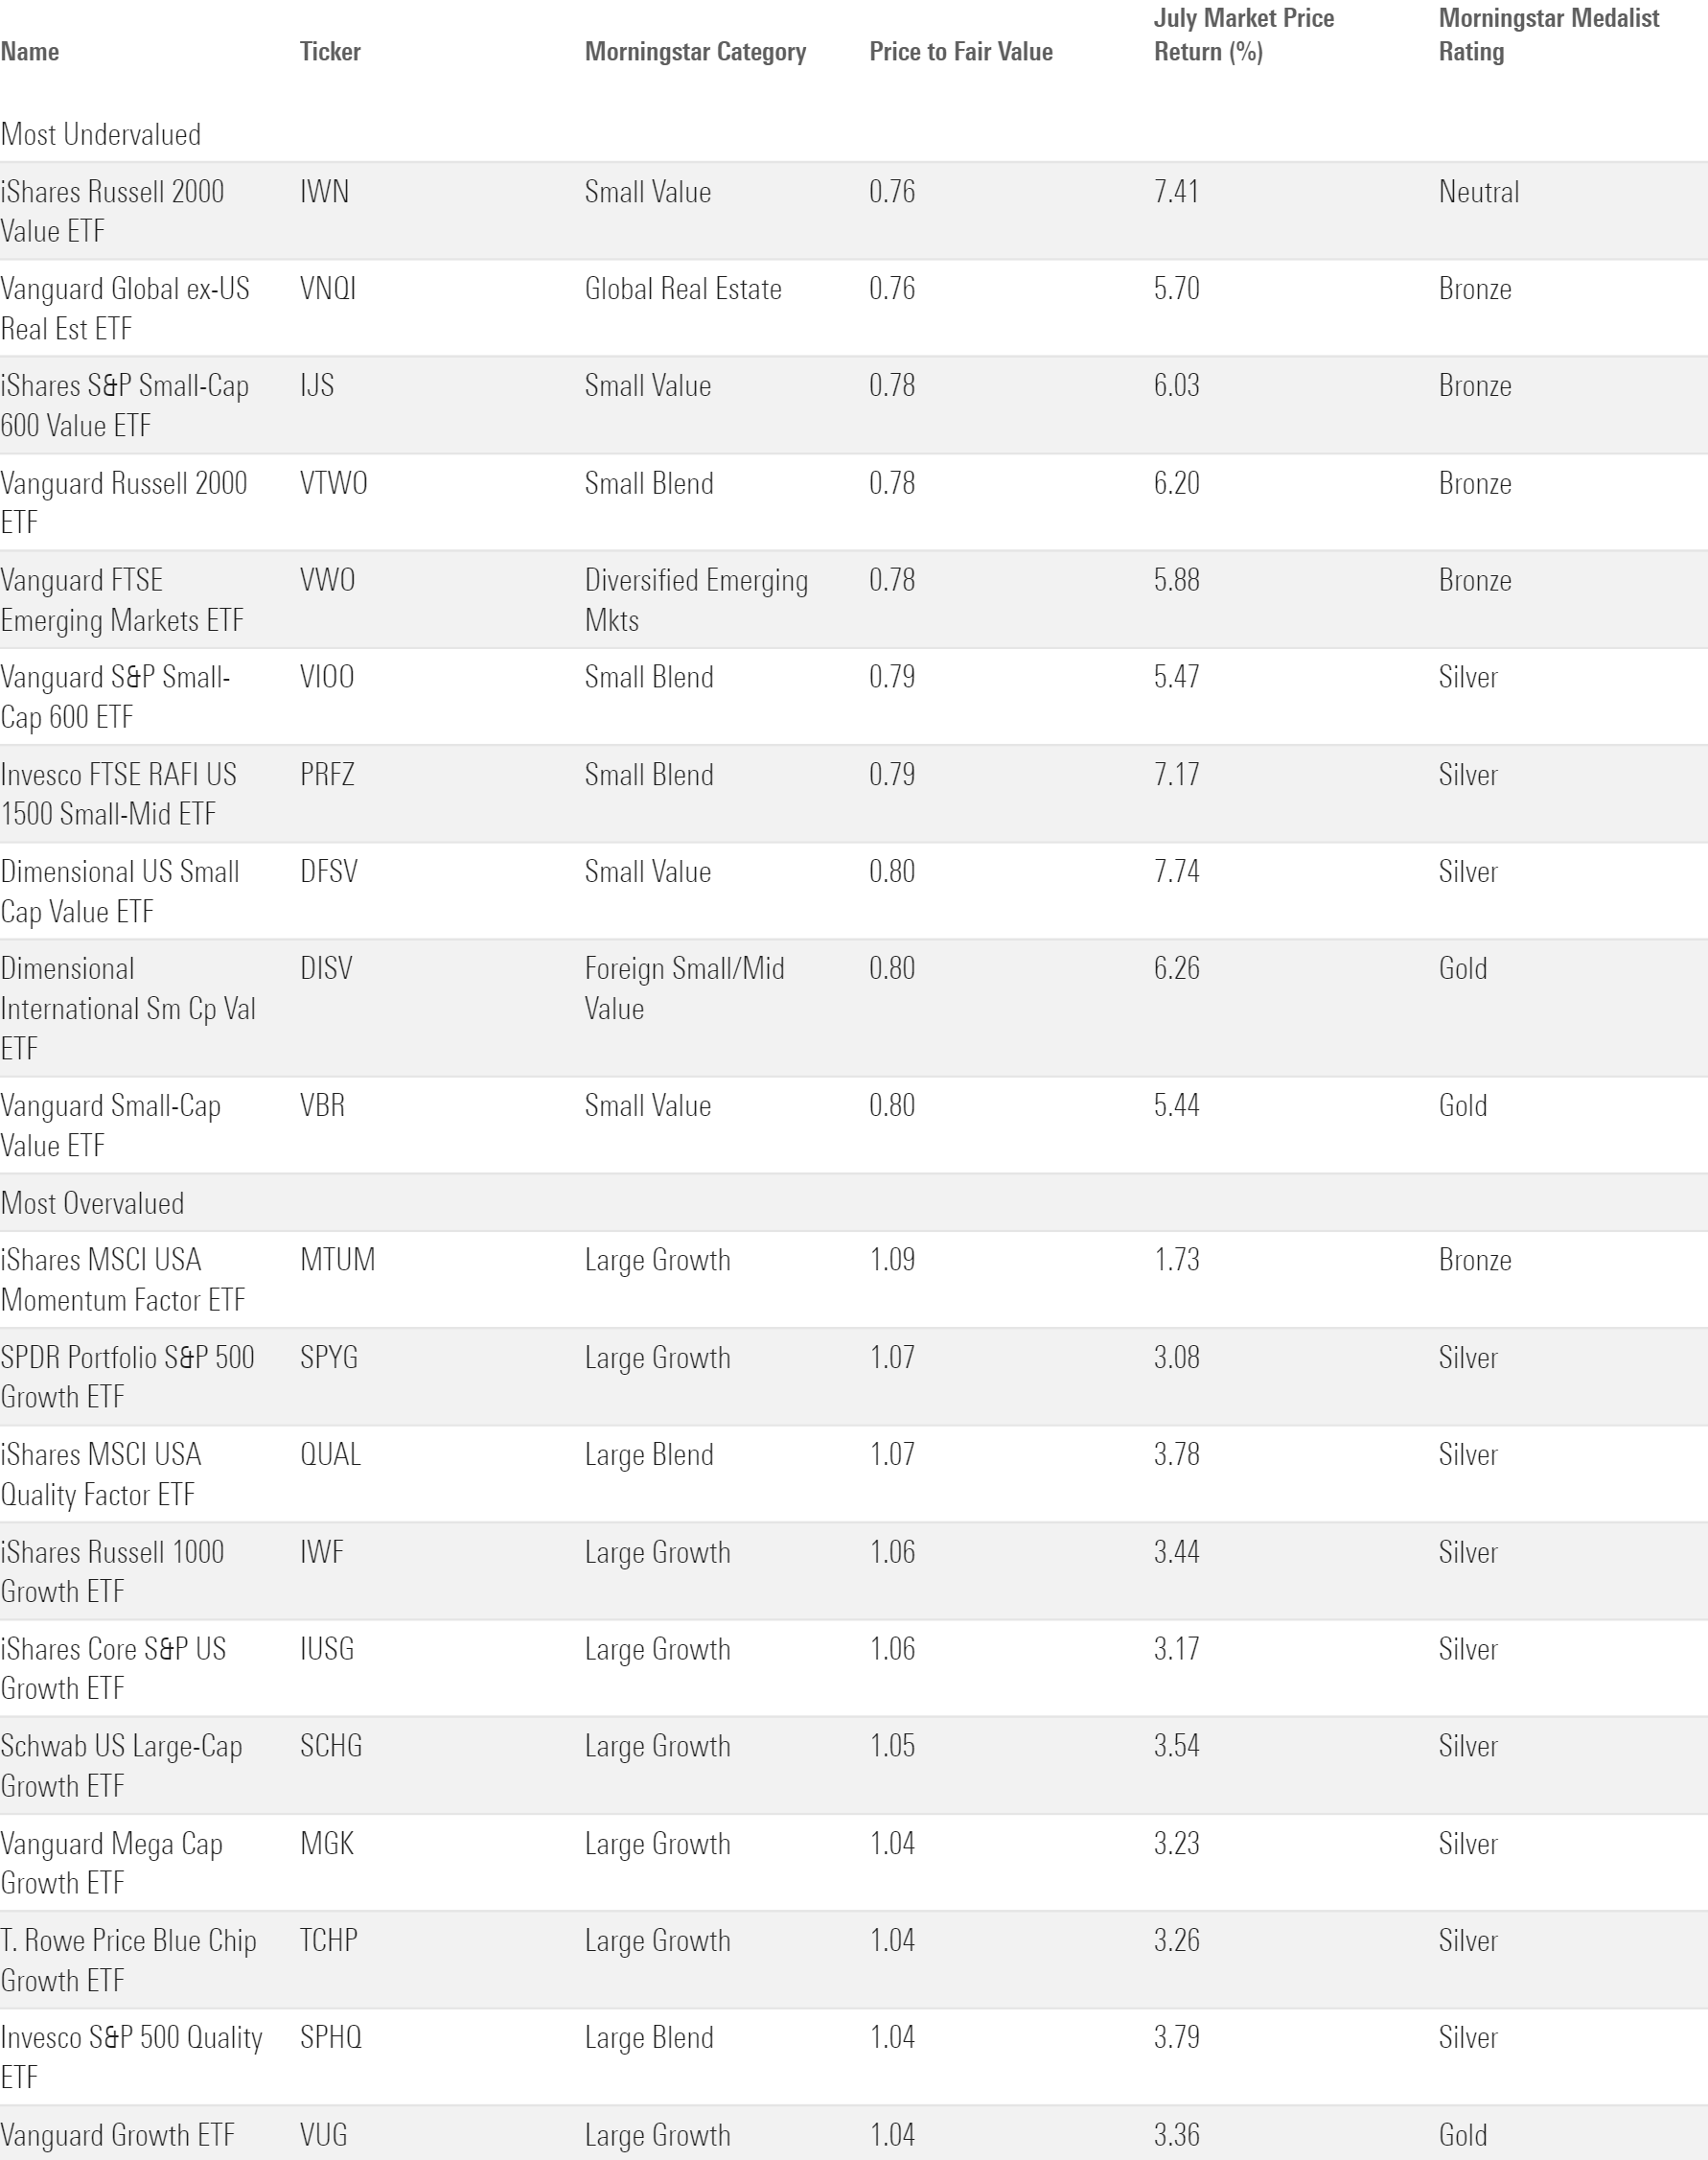
Small-cap stocks outperformed their larger-cap peers in back-to-back months, but they still trade at a deeper discount than any other pocket of the market. Small-value funds came at the best rate. Those rated by Morningstar analysts traded 20% below their fair value on average as of July 2023. But broadening the scope doesn’t require a premium: Vanguard S&P Small-Cap 600 ETF VIOO came with a 21% discount. Dimensional U.S. Targeted Value ETF DFAT and its 20% discount may also be worth a look because it incorporates profitability into stock selection, which can steer it clear of the lower-quality shadows in the small-value market.
Investors willing to make a sector bet in the name of value—or those keen to bolster their real estate exposure—may find Vanguard Global ex-U.S. Real Estate VNQI compelling. It registered a 0.76 price/fair value ratio as of July 2023, second lowest of all analyst-rated ETFs. Domestic real estate funds look cheap, too. Vanguard Real Estate ETF VNQ traded 16% below its fair value at July’s end. No U.S. sector has worse trailing 12-month returns than real estate, as measured by SPDR’s suite of sector ETFs, so these funds could prove to be valuable buy-low candidates if they enjoy a bounce like their peers.
The author or authors do not own shares in any securities mentioned in this article. Find out about Morningstar’s editorial policies.
/cloudfront-us-east-1.images.arcpublishing.com/morningstar/T2LGZCEHBZBJJPPKHO7Y4EEKSM.png)
/cloudfront-us-east-1.images.arcpublishing.com/morningstar/ZHTKX3QAYCHPXKWRA6SEOUGCK4.png)
/cloudfront-us-east-1.images.arcpublishing.com/morningstar/MNPB4CP64NCNLA3MTELE3ISLRY.jpg)
:quality(80)/s3.amazonaws.com/arc-authors/morningstar/30e2fda6-bf21-4e54-9e50-831a2bcccd80.jpg)