
Slowing Inflation Provides Hope of a Soft Landing, but Plenty of Challenges Remain
U.S. markets reflect a renewed sense of optimism, but other areas indicate ongoing concern.
/s3.amazonaws.com/arc-authors/morningstar/e4122fbe-ff74-4b9f-852e-64b09e476cb8.jpg)
Inflation eased further in the second quarter, while fears of an impending recession abated, creating a tailwind for risk assets that helped lift the S&P 500 8.7% in the three months through June. However, much of that appreciation was concentrated in just a handful of technology stocks, leaving some doubts about the sustainability of the market rally. Indeed, other segments of the market were less buoyant, with emerging-markets stocks posting a meager 1% gain.
Much of this underperformance could be attributed to China, where expectations for a post-COVID reopening boom failed to materialize. Indeed, many indicators suggest China’s economy is sputtering, and its asset markets are struggling in kind.
While emerging-markets stocks as an asset class underperformed, emerging-markets bonds were a bright spot in the fixed-income space, helped in part by a weakening U.S. dollar. Progress on inflation in the United States has given investors hope that the Federal Reserve’s tightening cycles are coming to an end. One side effect has been a reversal of the dollar appreciation that characterized the foreign-exchange market for much of 2022. High yield also had a good quarter, another reflection of improving risk appetite amid stabilizing rates globally.
The mythical “soft landing” appears more likely in the U.S. than it did three months ago, but challenges remain. The housing market is still something of a mess, with a dearth of inventory and high mortgage rates continuing to weigh on affordability. Outside the U.S., European countries face an uphill battle against stagflation, while the aforementioned economic challenges in China will remain in focus.
Every quarter, Morningstar’s quantitative research team reviews the most recent U.S. market trends and evaluates the performance of individual asset classes. We then share our findings in the Morningstar Markets Observer, a publication that draws on careful research and market insights. (Morningstar Direct and Office clients can download the report here.)
Here are some of the findings from our latest quarterly market review.
Global Market Barometer
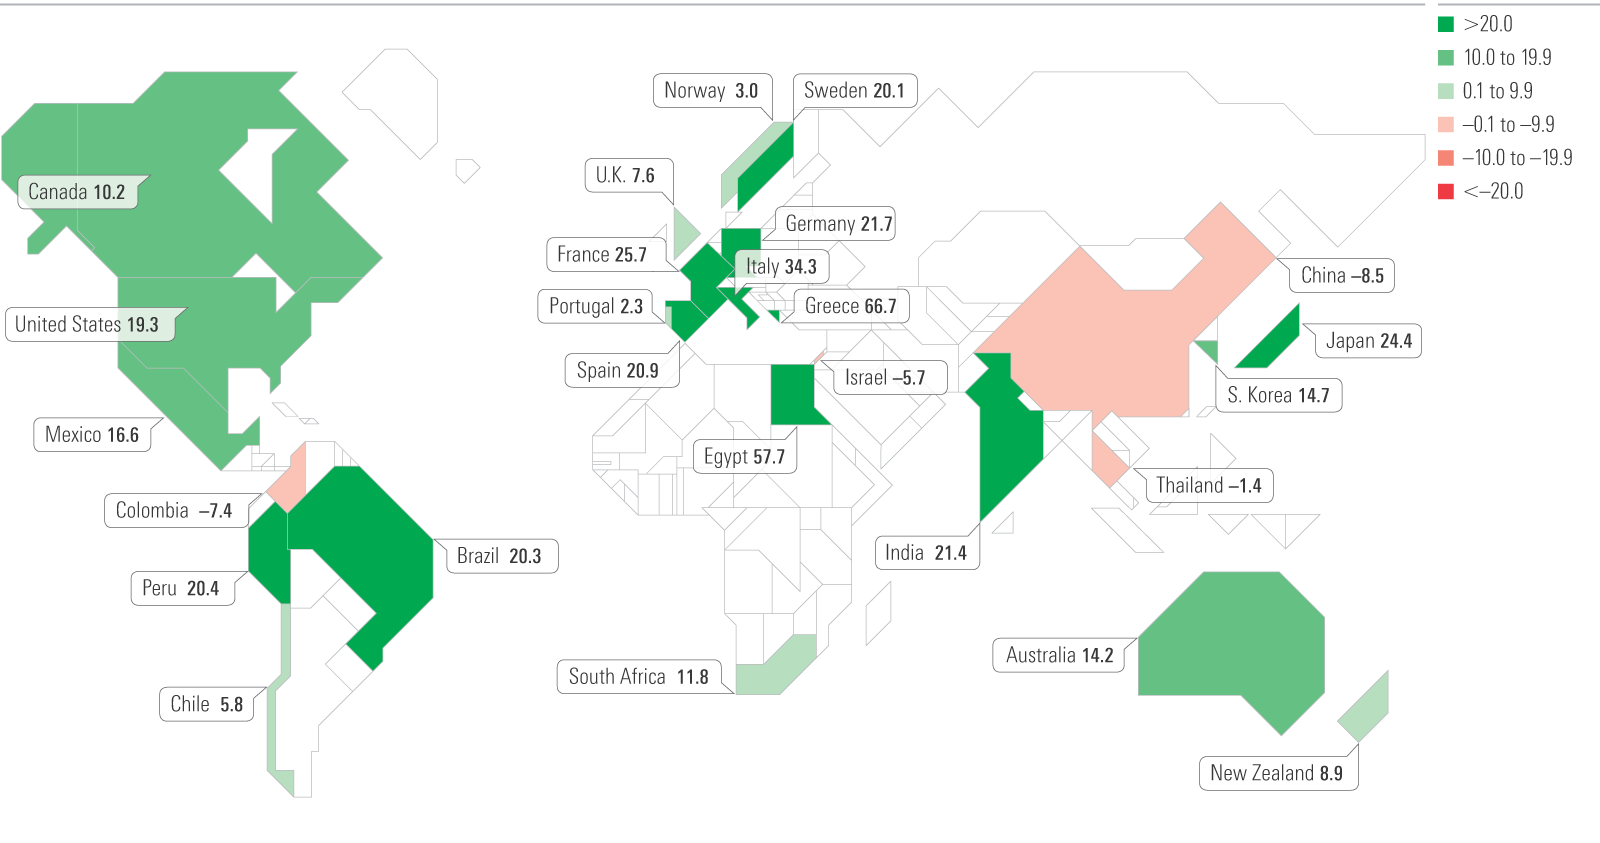
Equities worldwide faced significant pressure in 2022 from increasing rates, elevated inflation, and conflict in Eastern Europe. With most hitting a low point in late 2022, equity markets have revived in the trailing 12 months. Greek equities are notably up almost 67% as its government implements fiscal reform and awaits a potential upgrade to investment-grade status. China equities remain down: Investors once excited about its pandemic reopening are still waiting for results.
One-Year Trailing Returns of Morningstar Country Indexes in Base Currency by Percentage
Emerging Markets End Easy Money Era With a Whimper
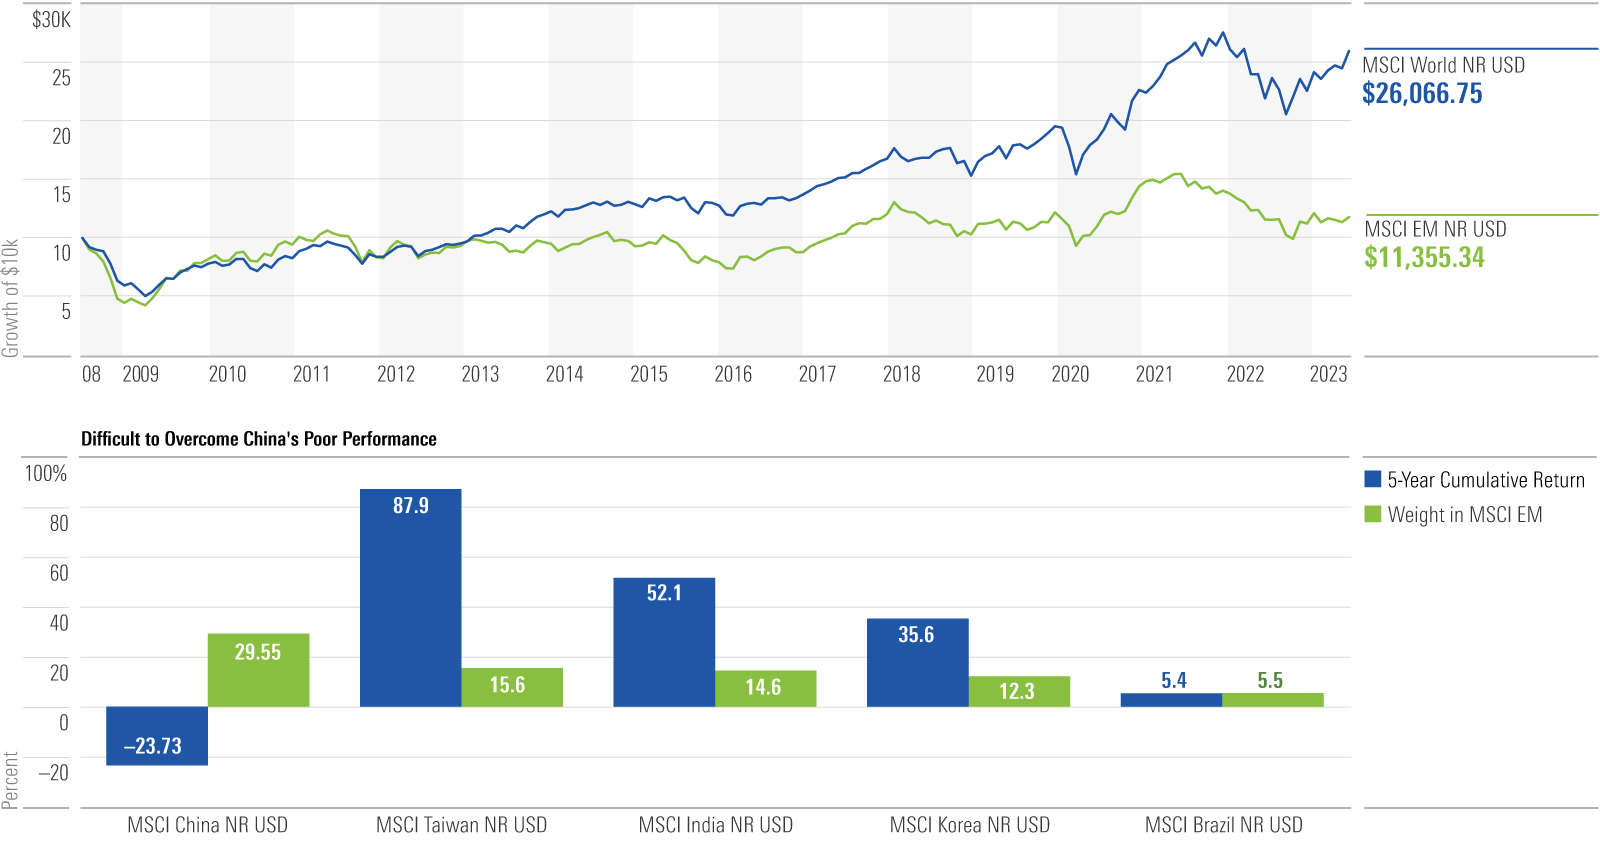
Through the 15 years ended June 2023, investors in emerging markets received less than a 1% annualized return, a brutally long stretch of abysmal performance. While low interest rates should theoretically help investments further out on the risk curve, geopolitics and governance issues have contributed to stagnant growth in these riskier equity markets. Chinese stocks have weighed heavily on performance over the past five years amid trade issues and economic uncertainty.
15 Years of Emerging-Markets Stagnation
Inflation Still Elevated in Most Developed Markets, but Momentum Is Starting to Swing
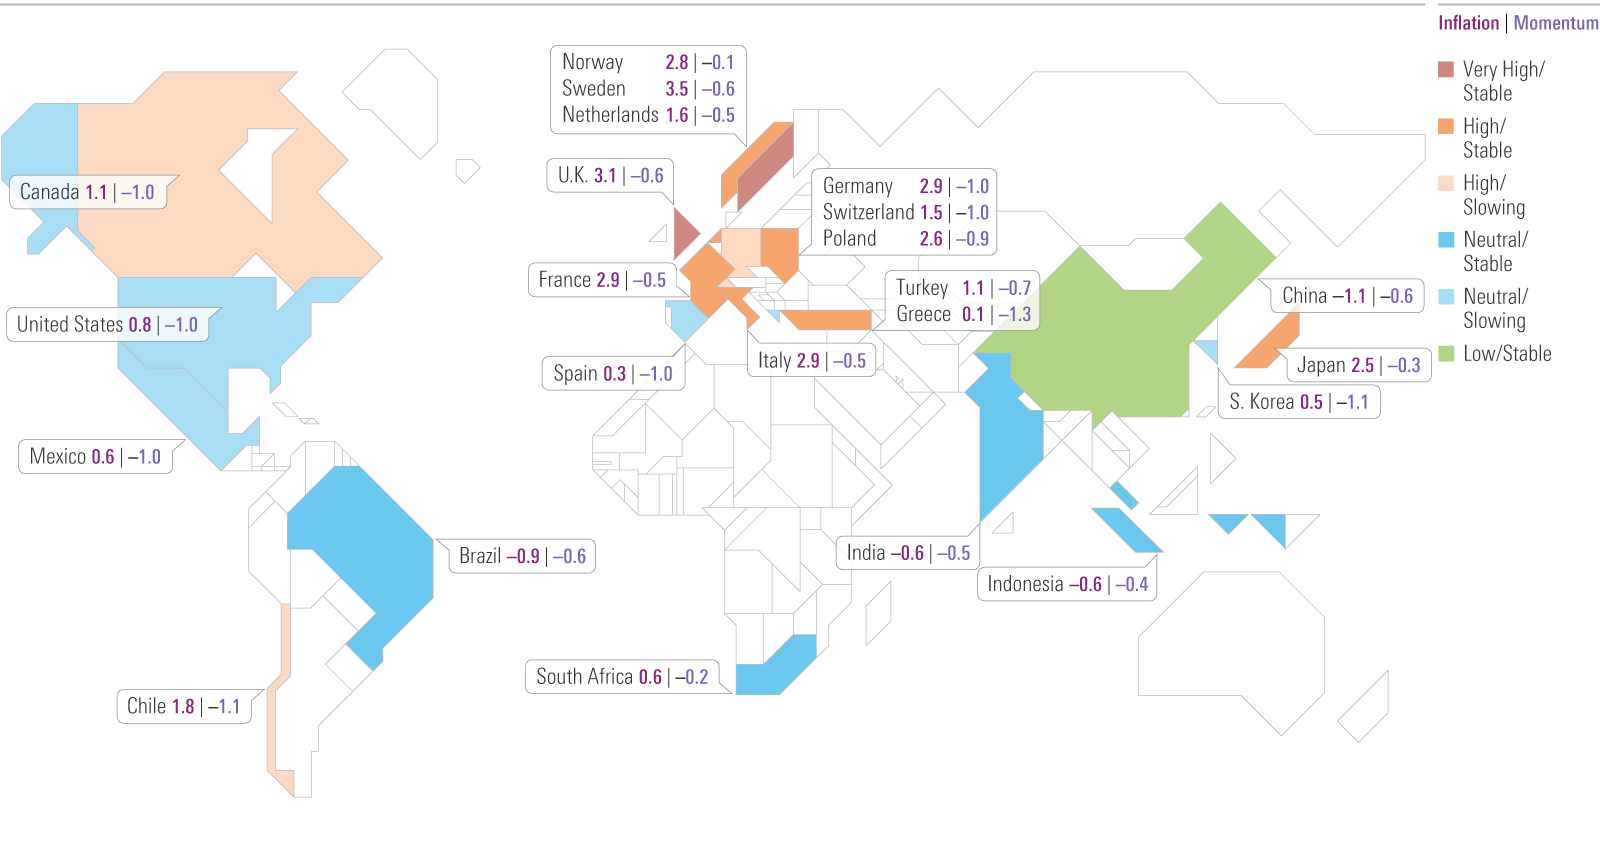
In the chart below, the first (reddish) number shows consumer price inflation in standard deviations above or below the mean since 2000. The second (purple) number is the three-month change in the first number, a measure of inflation momentum. By these metrics, Europe is facing the most severe inflation pressure, though momentum is slowing, while inflation in the U.S. and China looks much more benign. Globally, consumer price increases are slowing down.
Z-Score Year-Over-Year Consumer Price Changes (Since 2000)
Housing Market Under Strain: Shortages, Prices, and Building Booms
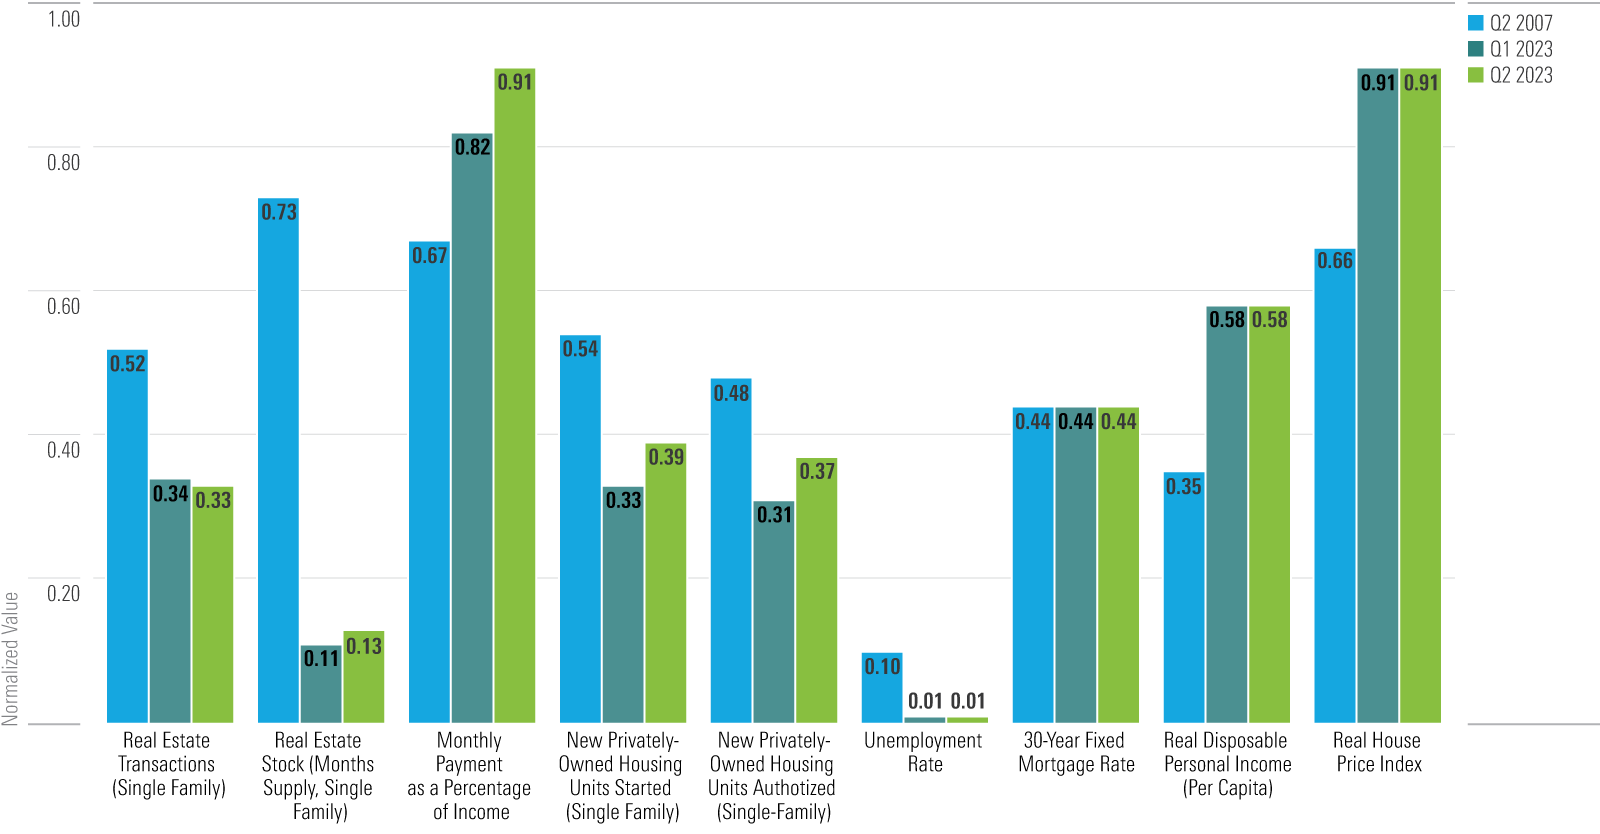
An unusual supply shortage headlines U.S. housing market news, evidenced by significantly low inventories in 2023 compared with the height of the last housing boom in 2007. Despite similar 30-year mortgage rates and higher real incomes, elevated average monthly payments as a share of income underscore the affordability challenge. An extended period of high prices and anemic inventory has catalyzed new building activity, reflected in the rise of permits issued and housing starts from last quarter.
Real Estate Indicators Normalized Since 1989
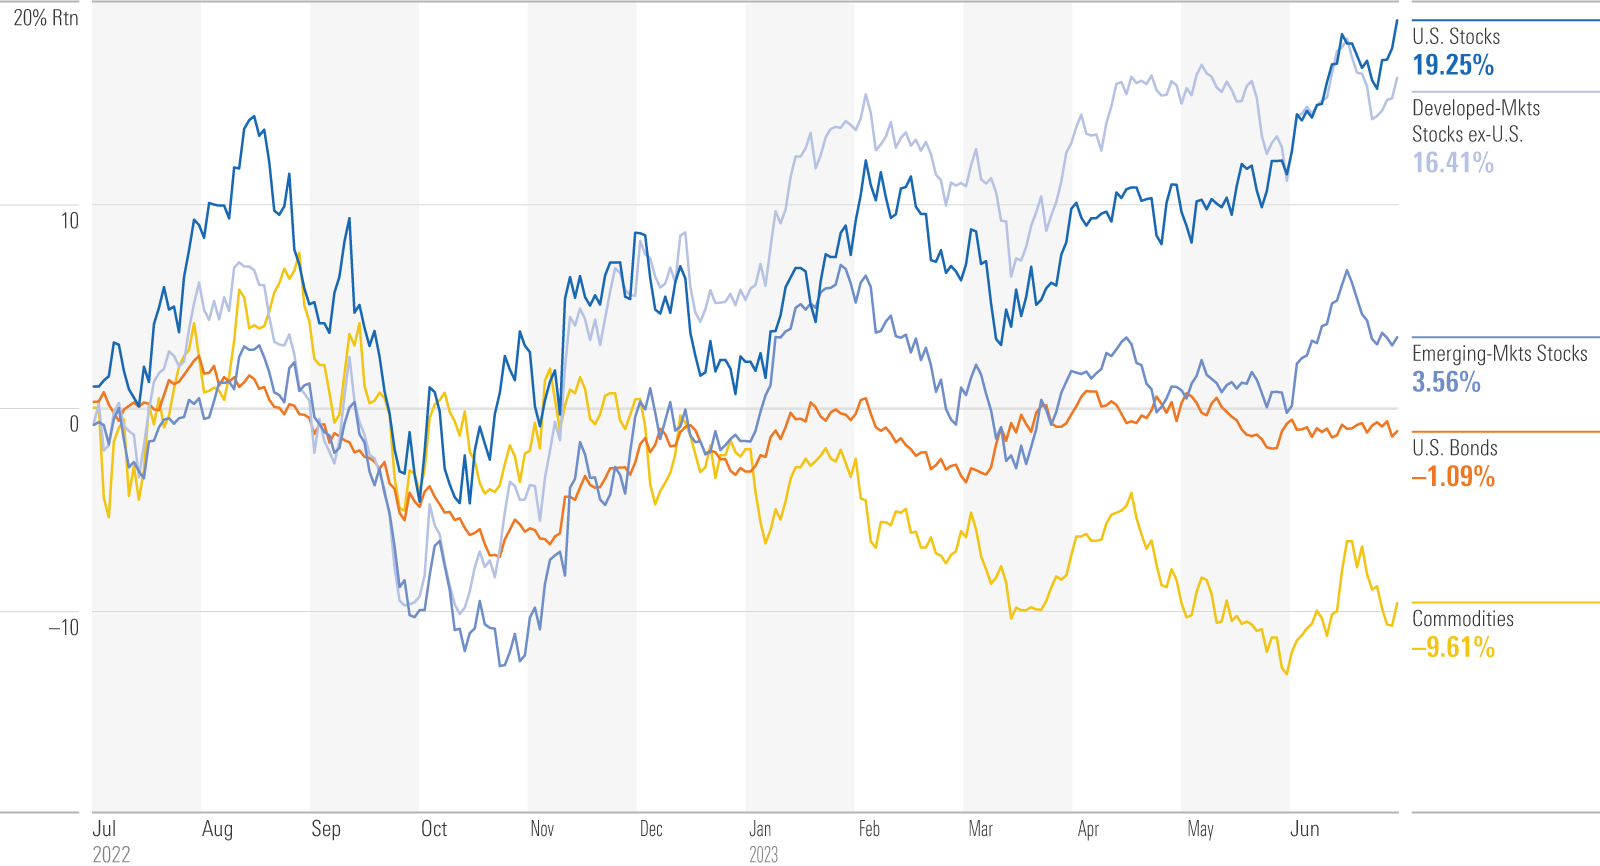
Trailing 12-Month Performance of Major Asset Classes
Developed-markets stocks have been the winners of the last 12 months as equity markets continue to rebound from their 2022 lows. Their emerging-markets peers have similarly seen a comeback into positive territory, albeit with minimized returns due to increased volatility. Commodities continued lower as the price of oil receded—Brent Crude was down 35% in the year ended June 2023. U.S. bonds have edged up from their lows but remain down as interest rates continue to rise.
Trailing 12-Month Performance of Major Asset Classes
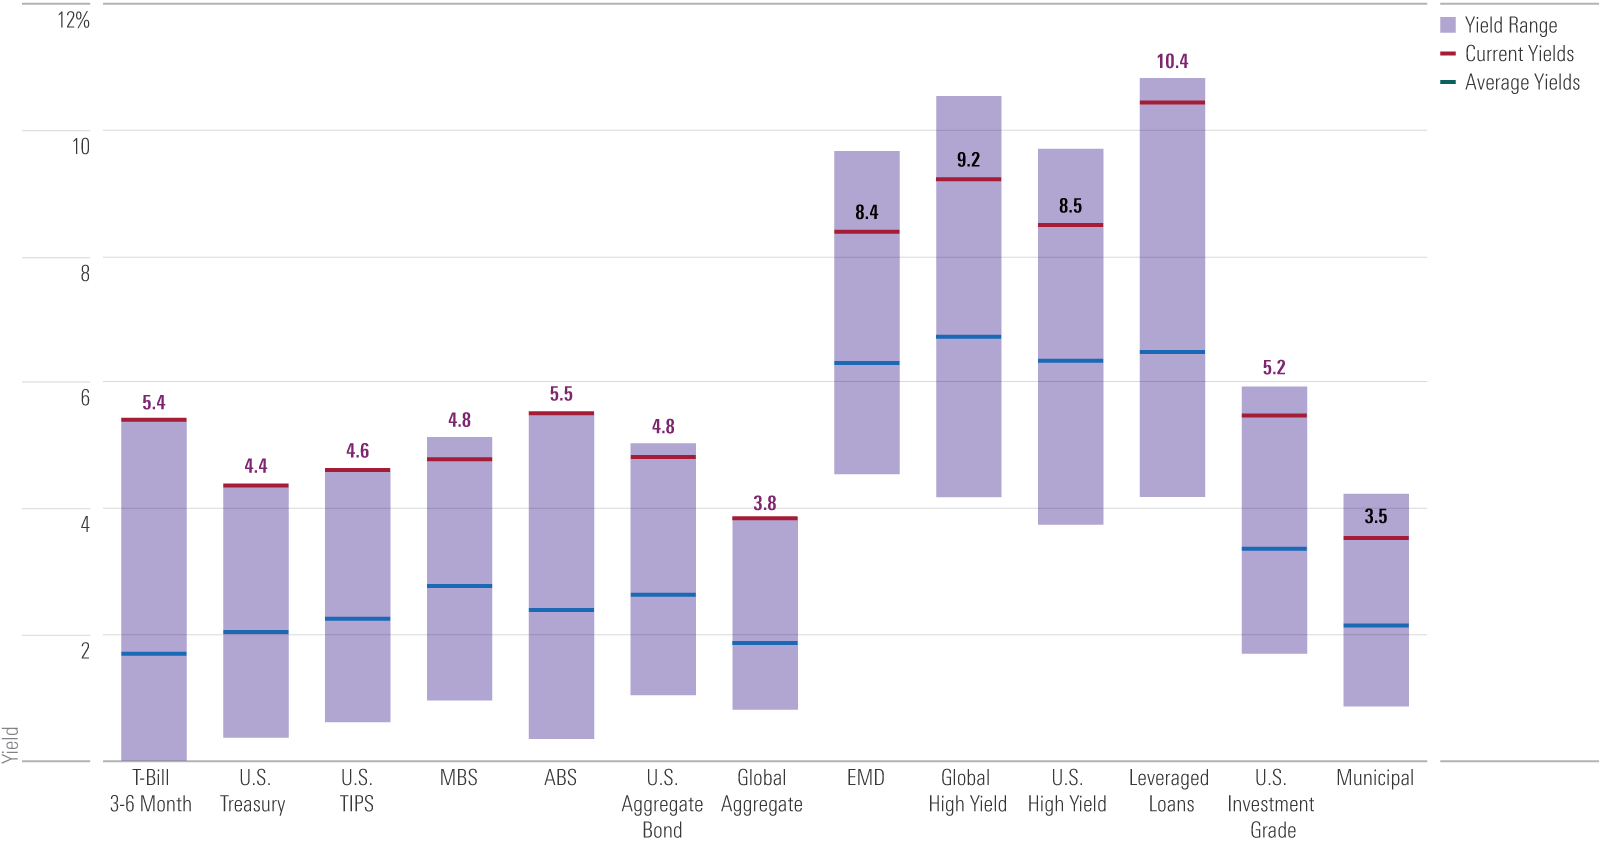
Yields Across Fixed-Income Asset Classes Remain High
Soaring yields helped make 2022 one of the worst years in many decades for bonds, but all major fixed-income sectors are currently offering income levels investors have not enjoyed in years. Higher yields and sustained volatility present attractive opportunities in fixed income, especially in less-risky, higher-quality bonds such as mortgage-backed securities and Treasuries. This backdrop allows investors to pare credit risk while improving income potential, a luxury they have not had in a long time.
Fixed Income Sectors' Five-Year Yield Range
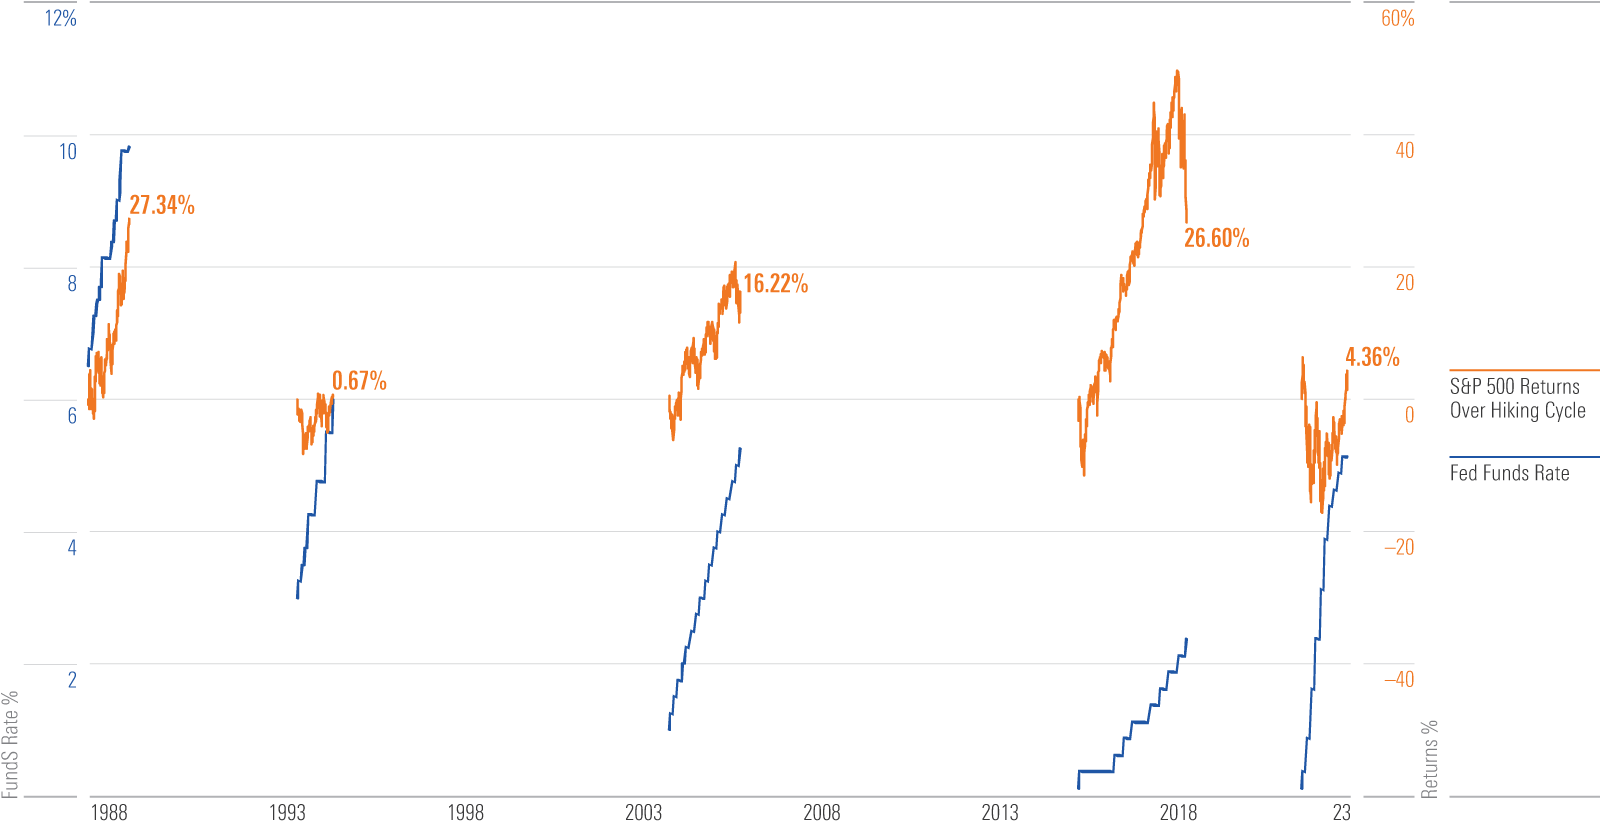
Another Hiking Cycle With Positive Equity Returns
Many expect tighter monetary conditions to weigh heavily on earnings and thus share prices, but each of the last five Fed hiking cycles have seen the S&P 500 generate positive total returns when measured from the day of the first hike through the day of the last hike. U.S. consumers have remained undeterred despite the most recent hiking cycle’s inflation, helped in part by a glut of savings generated during the COVID-19 lockdowns and keeping earnings buoyant.
Hiking Cycles and S&P 500 Total Returns
The author or authors do not own shares in any securities mentioned in this article. Find out about Morningstar’s editorial policies.
/cloudfront-us-east-1.images.arcpublishing.com/morningstar/AGAGH4NDF5FCRKXQANXPYS6TBQ.png)
/cloudfront-us-east-1.images.arcpublishing.com/morningstar/ZYJVMA34ANHZZDT5KOPPUVFLPE.png)
/cloudfront-us-east-1.images.arcpublishing.com/morningstar/QFQHXAHS7NCLFPIIBXZZZWXMXA.jpg)
:quality(80)/s3.amazonaws.com/arc-authors/morningstar/e4122fbe-ff74-4b9f-852e-64b09e476cb8.jpg)