
Q2 Stock Market Outlook: Contrarian Plays Look Increasingly Attractive
We see investment opportunities in what’s underperformed, unloved, and undervalued.
/s3.amazonaws.com/arc-authors/morningstar/54f9f69f-0232-435e-9557-5edc4b17c660.jpg)

Key takeaways:
- US stock market is trading 3% above our fair value estimate.
- Value category and small caps remain most undervalued.
- What has worked for the past one and a half years unlikely to be what works going forward.
- Contrarian investments provide best margin of safety in a fully valued market.
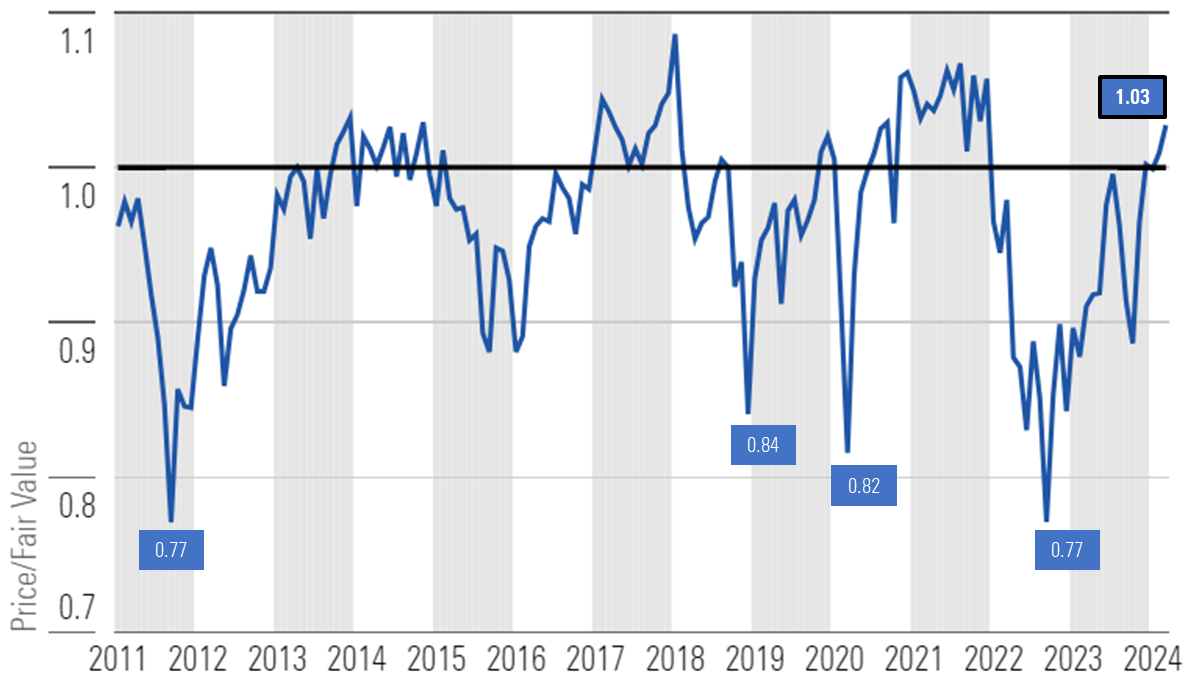
US Stock Market Trading at a Premium to Our Fair Value
As of March 22, the US stock market is trading at a 3% premium over a composite of our fair values. While this premium does not put the market in overvalued territory, since the end of 2010, the market has traded at this much of a premium, or more, only 14% of the time.
Price/Fair Value of Morningstar's US Equity Research Coverage at Month-End
In the future, we expect further gains will be driven by a widening out of returns across the market, specifically into the value category, which remains the most undervalued according to our valuations, as well as down in capitalization into small-cap stocks.
In our view, it is unlikely that what has worked for the last year and a half, will be what continues to work. At the market bottom in October 2022, communications, consumer cyclicals, and technology were the three most undervalued sectors. One and a half years later, technology is now overvalued, and both communications and consumer cyclicals are nearing fair value. We think now is a good time for investors to look for contrarian investment opportunities, especially in those areas that have underperformed, are unloved—and most importantly—undervalued.
Soft Landing and Easing Monetary Policy to Set Stage for Value and Small-Cap Stocks
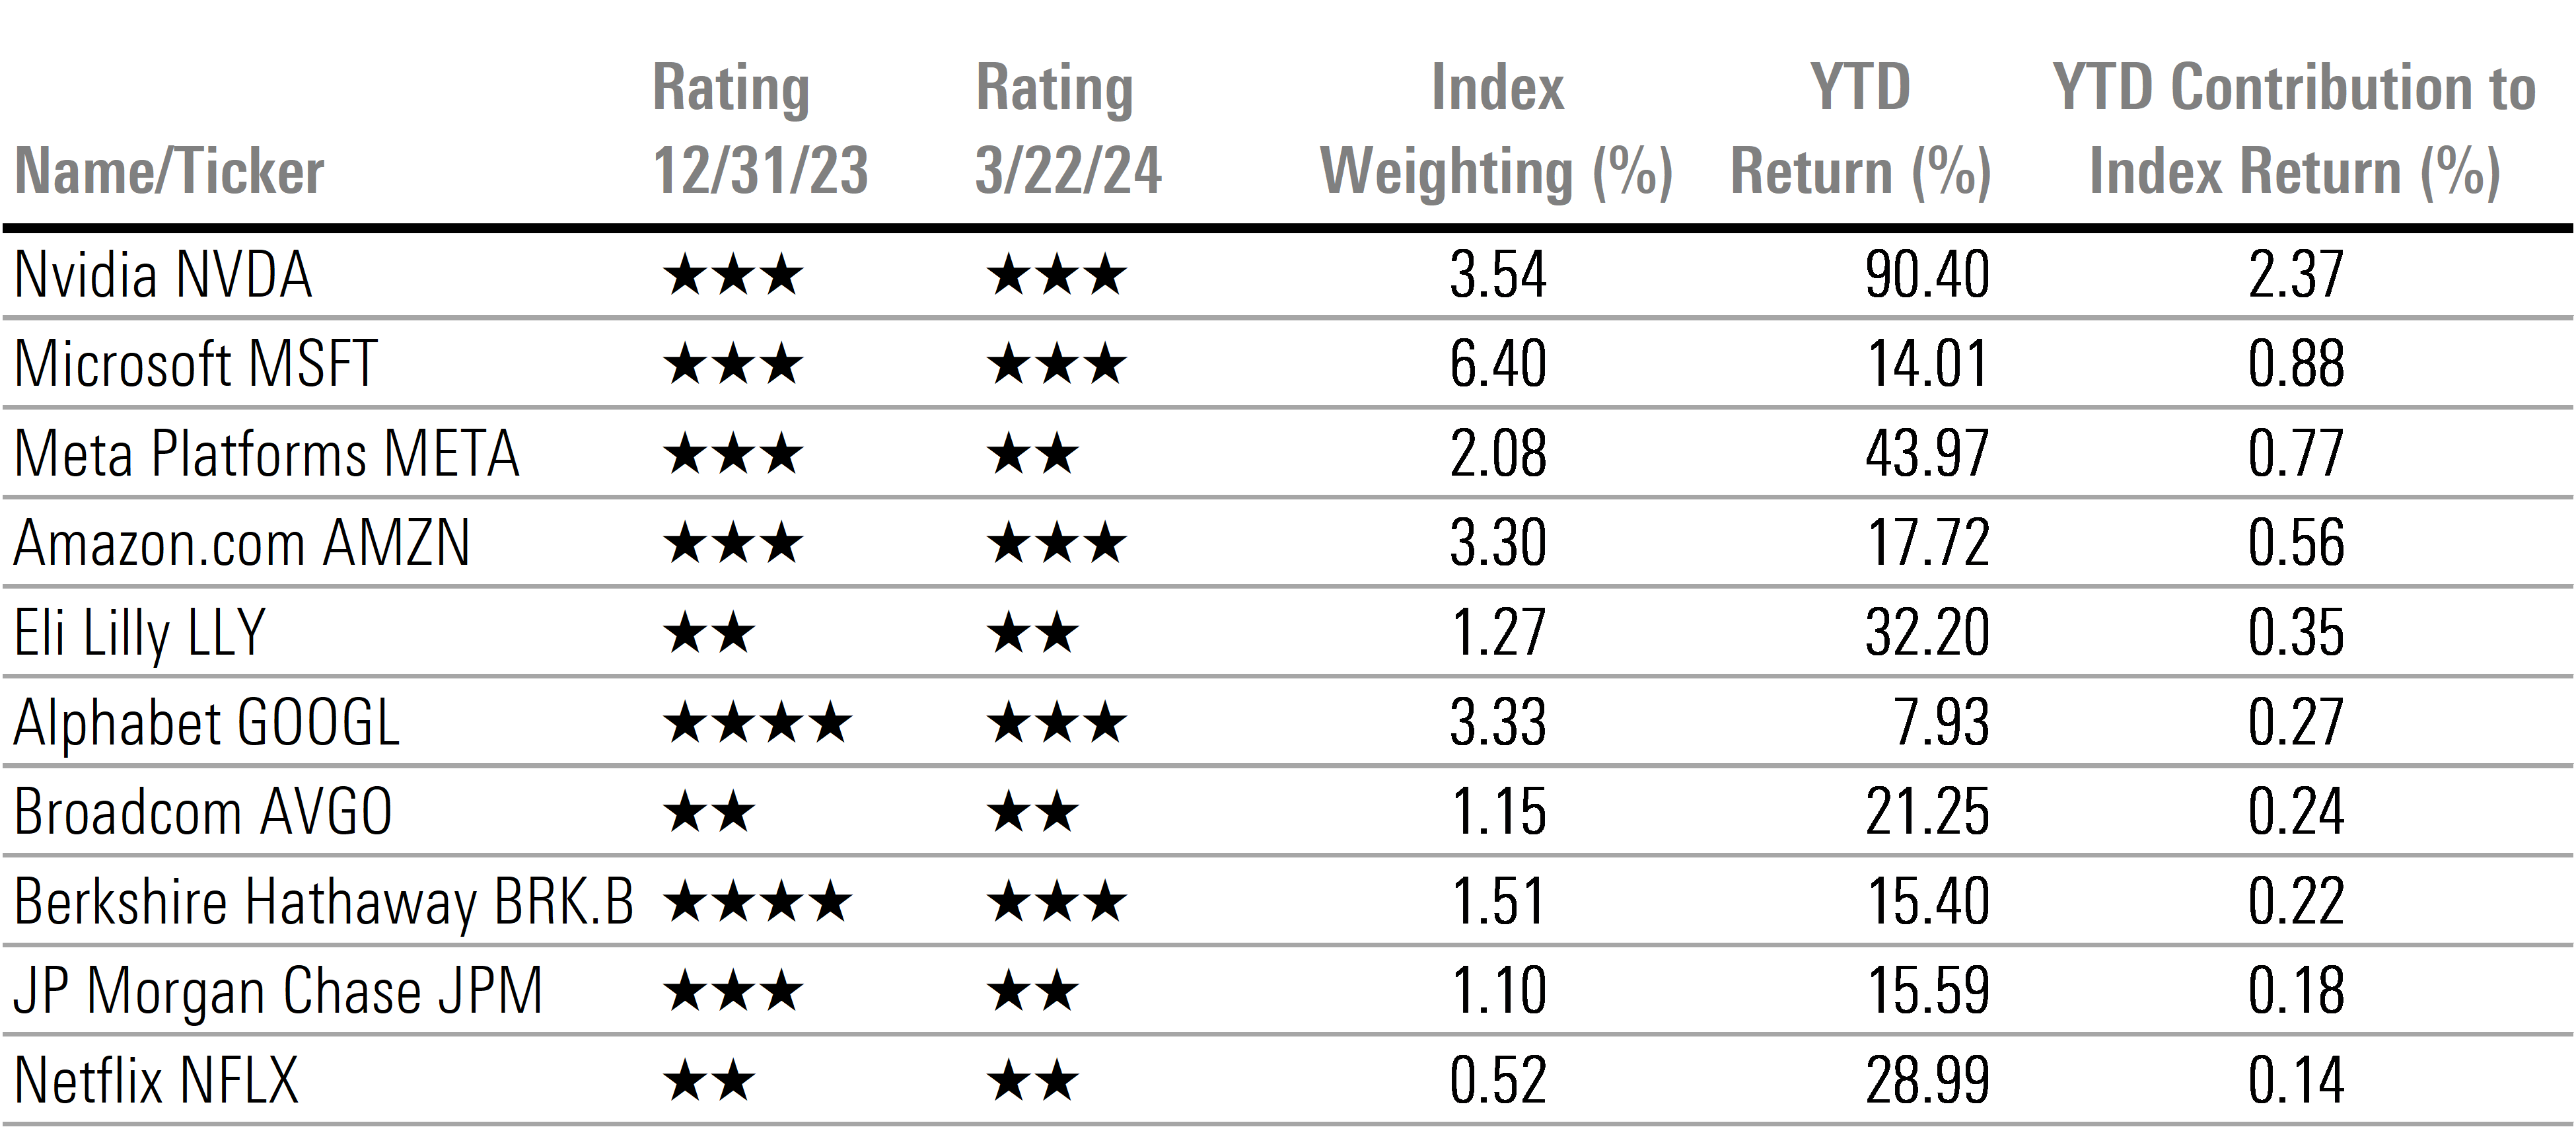
In the first quarter, the stock market continued its rally. Through March 22, the Morningstar US Market Index rose 9.66%. While the rally was supported by better-than-expected earnings growth, it was the surge in stocks tied to artificial intelligence that registered the greatest gains. As such, much of the gains remain concentrated among a handful of stocks, especially those leveraged to AI. For example, Nvidia has risen 90% and alone accounts for almost 25% of the market’s return year to date. Including Nvidia, 10 stocks accounted for 62% of this year’s gain.
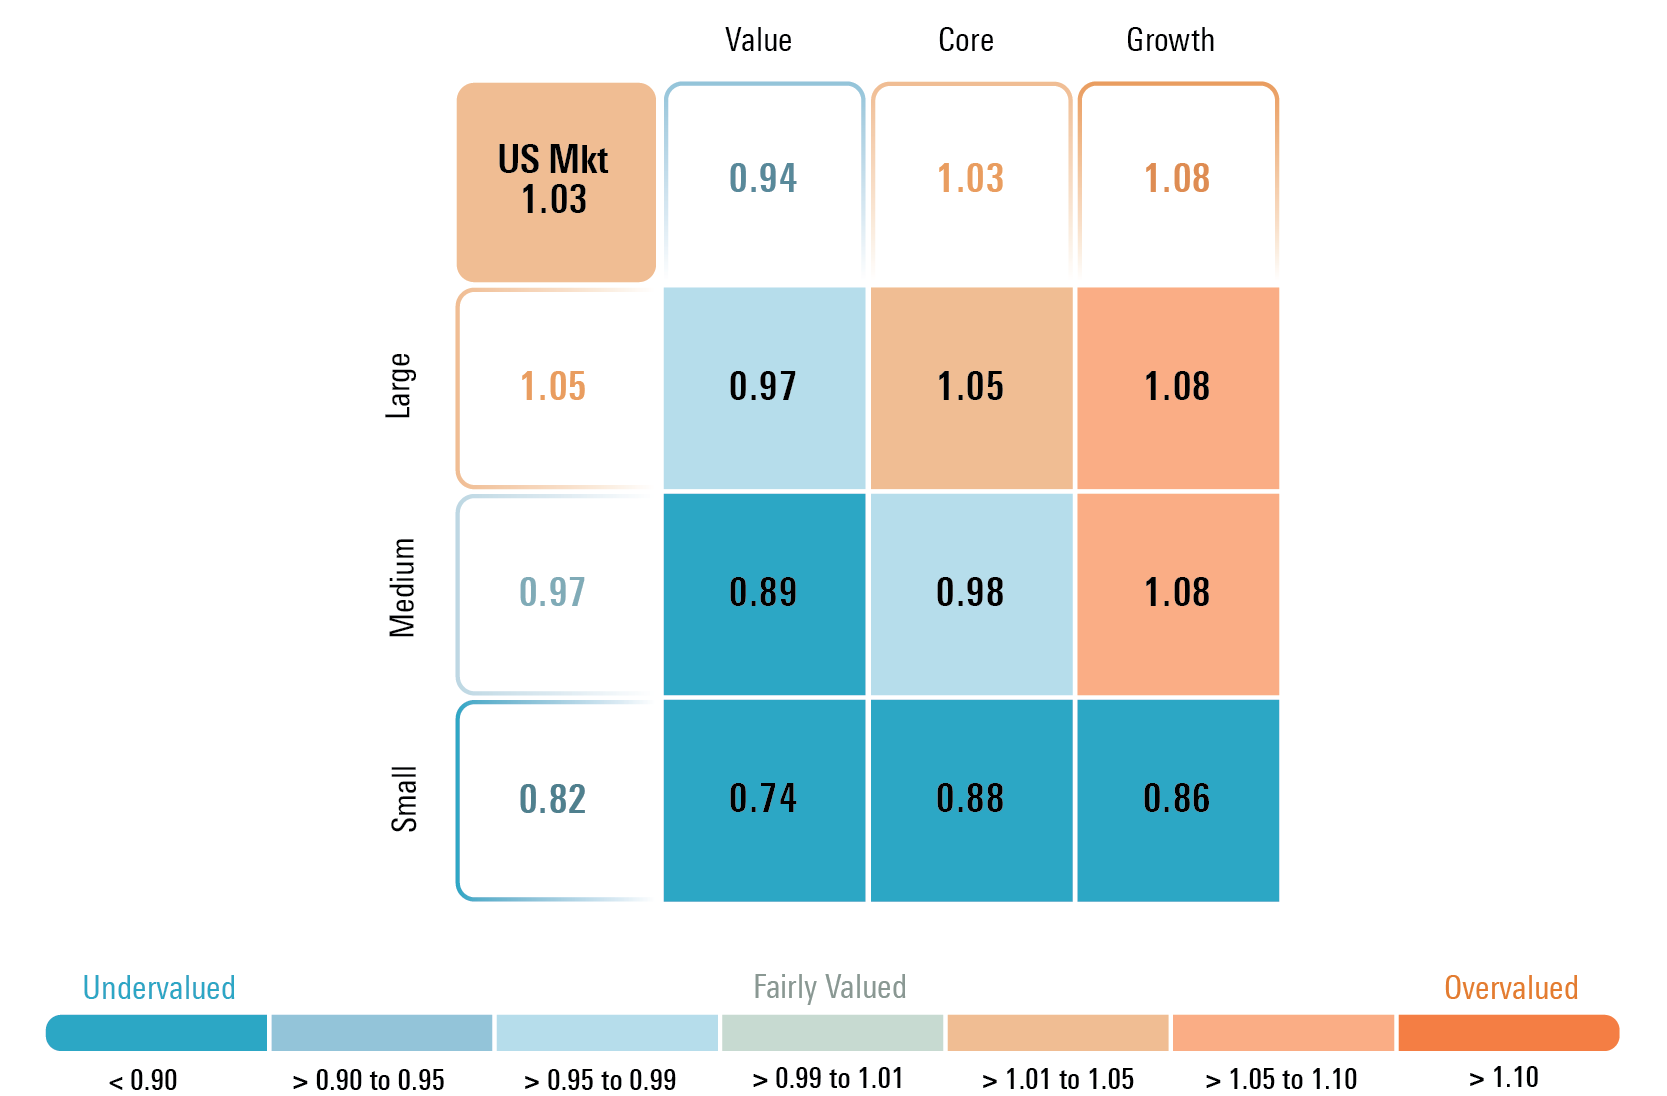
The value category remains the most attractive, trading at a 6% discount to our fair value, whereas at an 8% premium the growth category is trading well into overvalued territory. The core category trades just over fair value at a 3% premium. By capitalization, small-cap stocks remain the most attractive at an 18% discount, followed by mid-caps at a 3% discount, while large caps are at a 5% premium.
Based on these valuations, we recommend overweight positions in value, market weight in core, and underweight in growth. By capitalization, we advocate for an underweight position in large-cap stocks in favor of overweighting small-cap stocks and a slight overweighting in mid-cap stocks.
Price/Fair Value by Morningstar Style Box Category
In the future, based on a combination of these valuations and our economic outlook, we see a good setup for both value stocks and small-cap stocks. Morningstar’s US economics team expects a soft landing as the rate of economic growth slows over the next few quarters but not enough to lead to a recession. That slowing rate of economic growth will likely weigh on growth stocks, which are overvalued. Yet, that soft landing would be beneficial for small caps, as traders have avoided them over the concern that they would suffer the most in a potential recession.
Our economics team has also forecast that interest rates will decline across the yield curve once the Fed begins to lower the federal-funds rate. Declining interest rates are positive for all stocks, but especially for several sectors that are overweighted in the value index. A decline in interest rates could lead to a rebound in demand for dividend-paying stocks—which also tend to be overweighted in the value category. From a historical point of view, small caps tend to do well when the Fed begins to cut interest rates. Lastly, a decline across the yield curve will remove the overhang that future earnings will be suppressed as small caps refinance low-cost maturing debt.
5 Undervalued Stocks to Buy During Q2 2024
Contrarian Calls: Underperforming, Unloved, and Undervalued
What has worked in the markets for the past year and a half is unlikely to be what works in the future. Entering 2023, communications, consumer cyclicals, and technology were the three most undervalued sectors. Over a year later, technology is now overvalued, and both communications and consumer cyclicals are nearing fair value.
According to an attribution analysis of the Morningstar US Market Index, as of March 22, the returns from 10 stocks accounted for approximately 62% of the total market return year to date. While these 10 stocks have led the market higher, we doubt they will continue to lead the market over the remainder of this year. At this point, half of the stocks are rated with 3 stars and the other half are rated 2 stars. Comparatively, at the beginning of 2024, two were rated 4 stars and only three were rated 2 stars.
Morningstar US Market Index Attribution Analysis
So, where to begin looking for those contrarian calls? We searched for those sectors that have lagged the broad market performance, exhibit a high degree of negative market sentiment, and yet trade at a significant discount to our intrinsic valuation.
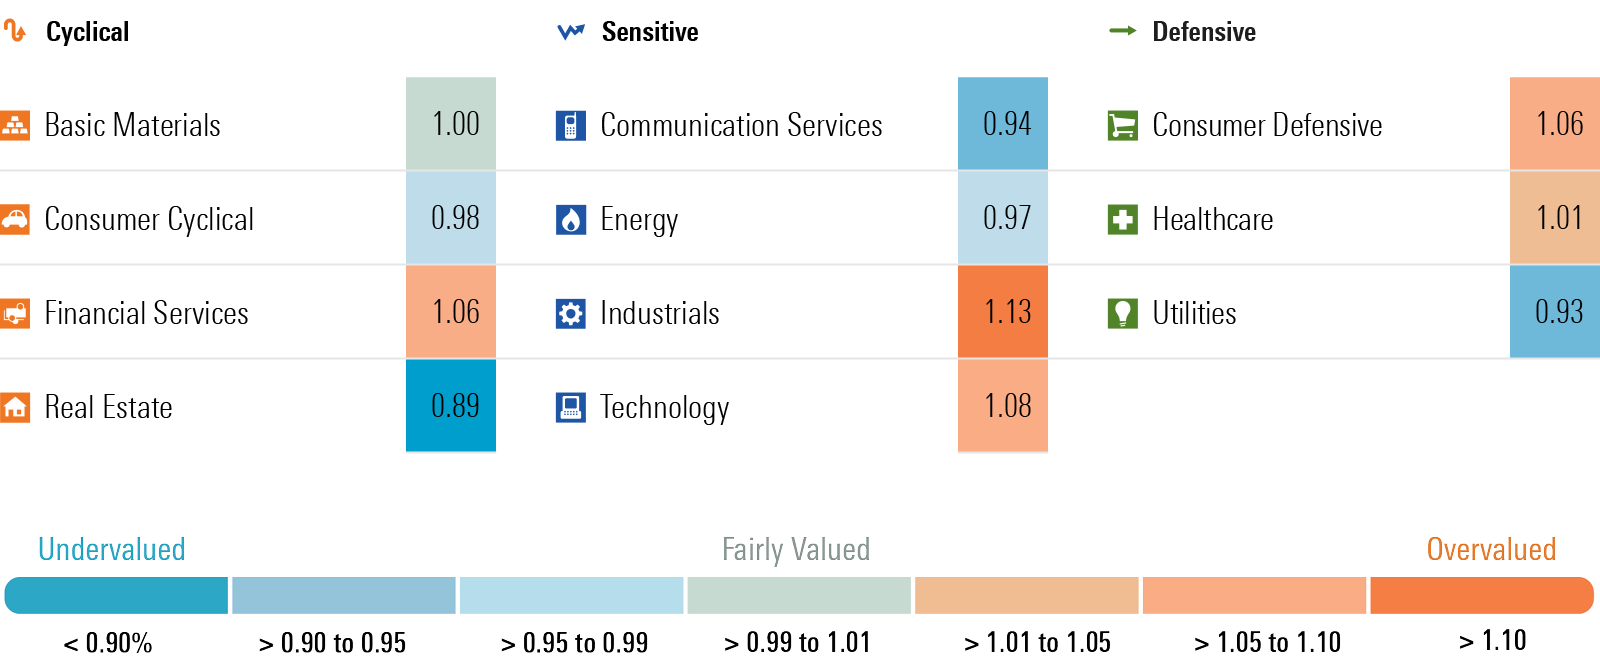
Those sectors include real estate, utilities, and energy.
Real Estate is the most hated sector on Wall Street, as the negative sentiment from declining urban office space valuations permeates the entire asset class. In our view, this is providing investors the opportunity to pick up stocks that have unfairly been dragged down. Some of the most attractive opportunities are those that have defensive characteristics, such as healthcare and triple-net lease providers. Examples in healthcare include 5-star-rated Ventas VTR and Healthpeak DOC. In the triple-net lease space, 5-star-rated Realty Income is one of the more undervalued stocks across our coverage.
After trading well into overvalued territory by the end of 2021, the utility sector has not only significantly trailed the broad market but has a cumulative loss of 5% since then. Rising interest rates have taken their toll as the present value of utility stocks is negatively correlated with higher yields. However, at this point, we think the market has overcorrected to the downside. Fundamentally, we think the outlook for the utility sector is as strong as it has ever been. The utility sector will benefit from the secular shift to renewable energy and from increased investment in the infrastructure for the electric grid. Examples include 5-star-rated NiSource NI and Entergy ETR. We also see declining interest rates as providing a tailwind for utility stocks.
The price/fair value of the energy sector has increased over the past few weeks as energy has caught a bid. Yet, we still see a significant number of undervalued opportunities. In addition, we think the sector provides investors with a natural hedge in its portfolio against additional geopolitical risk or if inflation stays higher for longer. Among the global oil majors, our pick is 4-star-rated Exxon XOM, and among the US regionals it is 4-star Devon DVN.
Where Should Investors Look To Take Profits?
The industrials sector is the most overvalued as compared with our fair value estimates. Areas such as transportation and airlines comprise some of the most overvalued stocks across our coverage. For example, 1-star-rated XPO XPO trades at a 64% premium to our fair value estimate, and 2-star-rated Southwest Airlines LUV trades at a 50% premium.
Within the technology sector, 1-star-rated ARM Holdings ARM is one of the most overvalued stocks across our entire coverage, trading at a level more than double our intrinsic valuation. Although ARM will benefit from the rise in artificial intelligence, we think the market is significantly overestimating its growth potential. Similarly, Dell Technologies DELL also trades at more than double our valuation as the market ascribes too much growth from AI for too long.
Both the consumer defensive and financial services are overvalued from a sector-level perspective, yet both are a bit of a Tale of Two Cities. For example, within the consumer defensive sector, low-cost retailers such as large-cap Walmart WMT, Target TGT, and Costco COST are overvalued, whereas we see a significant amount of undervaluation in the mid-cap packaged food companies such as Campbell Soup CPB, Kellanova K, and General Mills GIS. Among the financial services sector, on one side we see a significant amount of overvaluation across the insurance industry such as Allstate ALL and Progressive PGR, whereas US regional banks such as U.S. Bank USB and Truist TFC remain at attractive levels.
Morningstar Price/Fair Value by Sector
Corporate Credit Spreads No Longer Attractive
Through March 22, the Morningstar US Core Bond Index, our proxy for the broad bond market, decreased 0.90%. The amount of yield carry was more than offset by the decline in bond prices as interest rates rose in the longer end of the yield curve. The yield on the 10-year US Treasuries rose by 34 basis points to 4.22%.
Morningstar’s US Economics Team projects that the Federal Reserve will begin to ease monetary policy at the June meeting by lowering the federal-funds rate by 25 basis points and then cutting further at every meeting for the rest of the year. This projection is predicated on its forecast that inflation will continue to moderate throughout the year and that the rate of economic growth is slowing.
We project the federal-funds rate will fall to a range of 4% to 4.25% by the end of the year. We also forecast that the federal-funds rate will remain on a downward path, dropping to a range of 2.50% to 2.75% by the end of 2025.
In the longer end of the curve, we project the yield on the 10-year US Treasuries will average 4.00% in 2024 and 3.00% in 2025. Based on our interest-rate forecast, we think investors will be best served in longer-duration bonds and locking in the currently high interest rates.
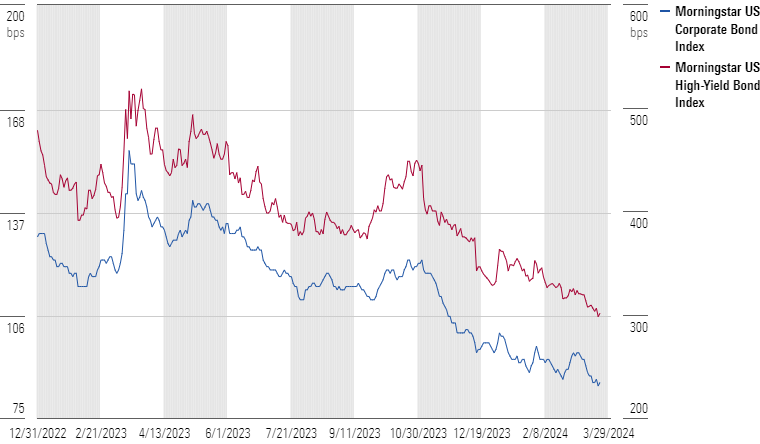
Corporate credit spreads tightened over the course of the quarter. In the investment-grade corporate bond market, the average spread of the Morningstar US Corporate Bond Index tightened 10 basis points to +86. In the high-yield corporate bond market, the average spread of the Morningstar US High-Yield Index tightened 31 basis points to +302.
In our midyear 2023 bond market update, we moved to recommend a market weight position in corporate bonds from an overweight. At that time, we thought that credit spreads offered “an adequate margin of safety to investors to offset future downgrade and default risk.” However, at this point, with as much as credit spreads have continued to tighten, even in our soft-landing scenario, we think corporate credit spreads have become too tight and should be underweighted.
Over the past 24 years, only 2% of the time has the spread on the Morningstar US Corporate Bond Index been below the current spread of +86 basis points. Over the same period, only 3% of the time has the spread on the Morningstar US High-Yield Bond Index been below its current spread of +302 basis points. By way of comparison, the tightest investment-grade and high-yield credit spreads have ever traded is +80 and +241 basis points, respectively, in 2007.
Morningstar US Corporate and High-Yield Bond Indexes Credit Spread
The author or authors do not own shares in any securities mentioned in this article. Find out about Morningstar’s editorial policies.
/cloudfront-us-east-1.images.arcpublishing.com/morningstar/MQJKJ522P5CVPNC75GULVF7UCE.jpg)
/cloudfront-us-east-1.images.arcpublishing.com/morningstar/ZYJVMA34ANHZZDT5KOPPUVFLPE.png)
/cloudfront-us-east-1.images.arcpublishing.com/morningstar/S7NJ3ZTJORFVLCRFS2S4LRN3QE.png)
:quality(80)/s3.amazonaws.com/arc-authors/morningstar/54f9f69f-0232-435e-9557-5edc4b17c660.jpg)