
What Do Rising Interest Rates Mean for Diversification?
History offers investors key lessons.
/s3.amazonaws.com/arc-authors/morningstar/bdf88cbd-d3d8-4661-b946-d09f9ffe196b.jpg)
In our recently published 2023 Diversification Landscape report, we took a deep dive into how different asset classes performed in the past couple of years, how correlations between them have changed, and what those changes mean for investors and financial advisors trying to build well-diversified portfolios.
Learning From the History of Interest Rates
Until recently, investors had grown accustomed to a steady decline in interest rates, punctuated by modest Federal Reserve efforts at recalibrating those rates to levels last seen before 2008′s global financial crisis. It wasn’t until 2022 that the central bank’s 2% inflation target met with economic necessity and resulted in a series of seven substantial hikes to the federal-funds rate, accompanied by expectations for more. Inflation was certainly a contributor to the hiking decision, but another motivation was a need to strengthen the central bank’s monetary policy tools. With rates near zero, there was little room to use them as a tool for easing monetary conditions in response to the market crises that periodically crop up. The goal of an upward interest-rate pivot is to accept short-term pain for the long-term benefit of more effectively moderating the economy.
This trade-off was at work in 2022. When the market expects borrowing costs to climb, correlations between stocks and bonds typically increase. From a mechanical perspective, cash flows are discounted by investors at higher rates, thereby decreasing the current value of both stocks and bonds, but bond values are sometimes under more immediate stress in these situations. This is because the value of future income payments makes up a larger portion of a bond’s current estimated value. And while all fixed-rate bonds are usually stressed in this situation, longer-maturity bonds that carry significant duration (a measure of interest-rate risk) are at the greatest disadvantage when rates climb. Investor worries over persistent inflation and the risk of a recession only made things worse for bonds as interest rates rose in 2022.
During periods of stable or falling rates (which has been the typical situation over the past six decades), a bond’s duration is an advantage rather than a liability. For U.S. Treasury bonds—highly liquid and with minimal credit risk—duration heavily and positively influences prices. Investors accept the lower returns of a U.S. Treasury bond for the ballast that it usually provides when riskier assets sell off. But during periods of rapid rate increases, the very structure of a U.S. Treasury bond negatively affects its price, and its correlation with riskier assets, such as U.S. stocks, can increase precisely at a point when both asset classes are experiencing losses. That is one reason U.S. Treasuries provided little reprieve to diversified portfolios in 2022.
But correlations are dynamic, and the relationship between stocks and bonds varies depending on context. Consider 60 years of interest rates. Policymakers sought to keep the economy stable during the following four widely acknowledged monetary policy regimes, as described by William T. Gavin in the Federal Reserve Bank of St. Louis Review, in different ways:
- The Great Inflation (January 1965 to October 1979)
- Volcker Reform (November 1979 to October 1982)
- The Great Moderation (November 1982 to December 2008)
- Zero Interest Rate Policy (January 2009 to February 2022)
During the Great Inflation, targeted interest-rate hikes helped stabilize the business cycle but led to double-digit inflation. Federal Reserve chair Paul Volcker inherited this situation and aggressively targeted the money supply to moderate inflation and instill trust in prices; his dramatic action unapologetically slowed the economy and is referred to as the period of Volcker Reform.
The next 25 or so years saw the Federal Reserve move to simultaneously stabilize prices and maintain lower inflation levels, but this Great Moderation coincided with significant financial deregulation. Ultimately, it culminated in the proliferation of complex derivative investments that magnified debts, stoked mistrust in banks, and led to a liquidity crunch. To stabilize the economy and slow the crisis, the Fed aggressively dropped short-term rates to essentially zero and purchased U.S. Treasuries and (unprecedented up until that point) agency mortgages in order to keep bond market yields low as well. ZIRP and successive rounds of quantitative easing set a nearly 15-year expectation of low borrowing costs. Outside of the U.S., some central banks even experimented with negative interest rates.
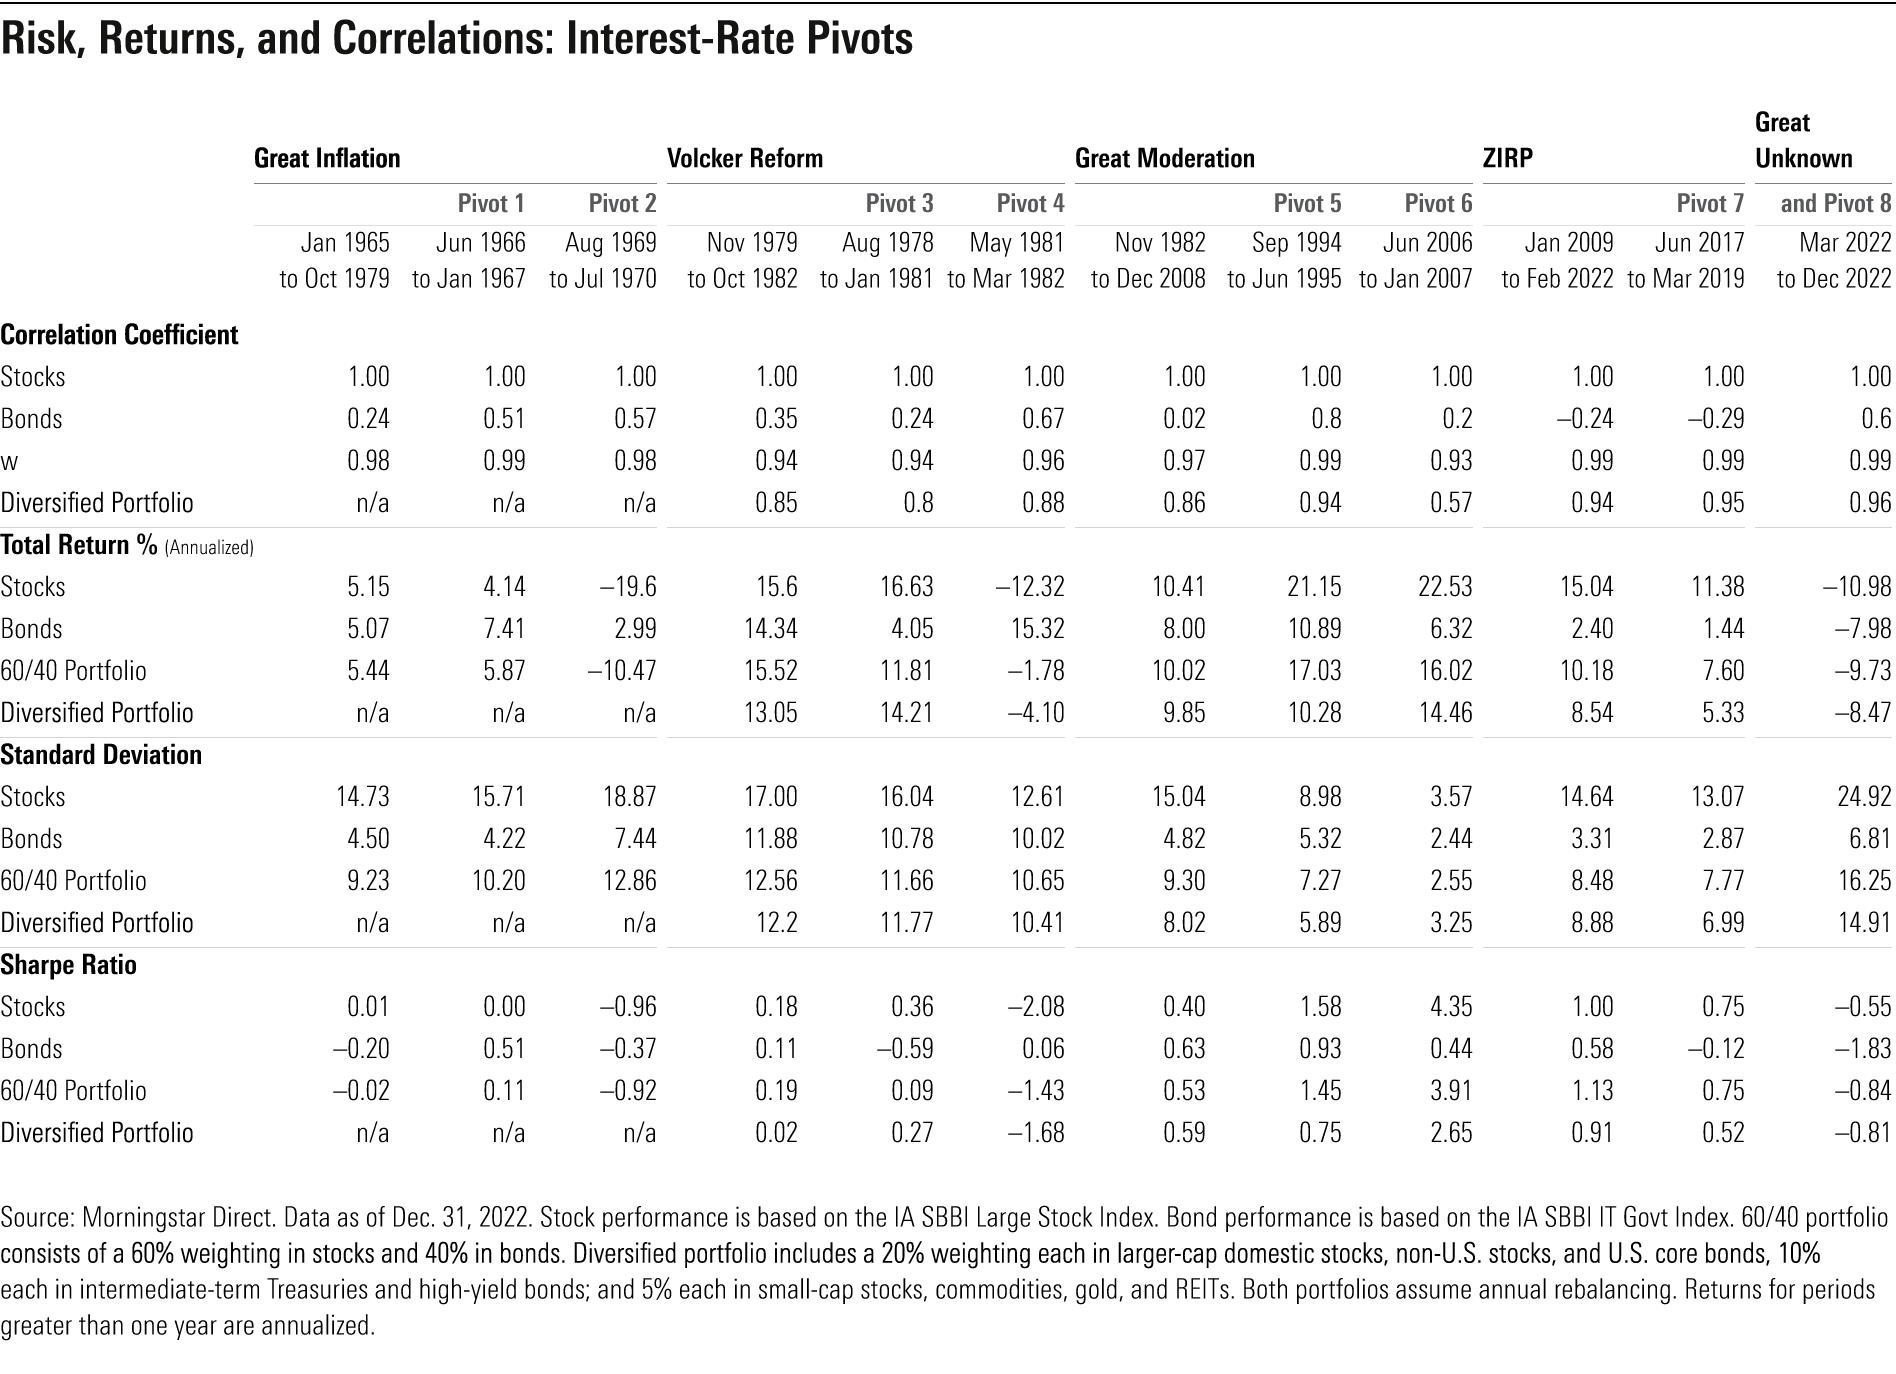
What do correlations look like across these monetary policy regimes? As shown in the table below, no two are the same. In three of the four described, the correlation coefficient is positive, though noticeably more modest (0.02) during the Great Moderation than during the Volcker Reform (0.35). As expected, the correlation was negative during ZIRP, given the precipitous decline in rates. Over the single six-decade period, the correlation coefficient between stocks and bonds registered at a modest but positive 0.10.
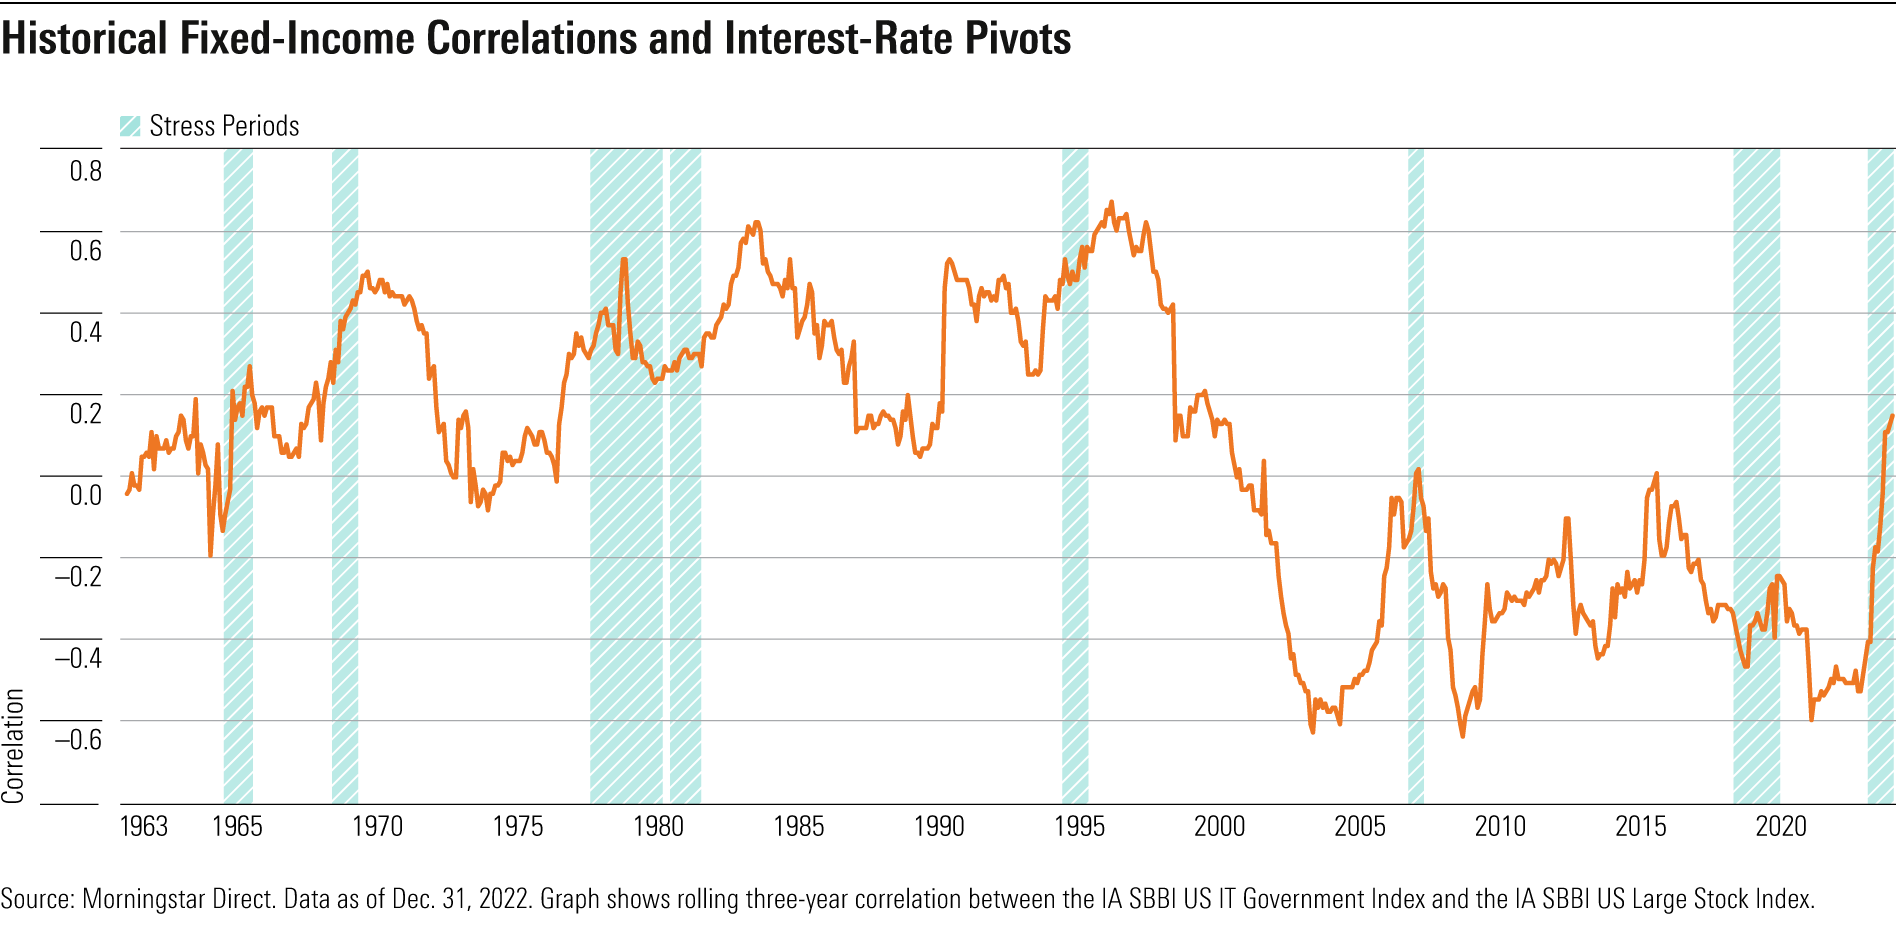
But during a more-concentrated period, such as 2022, these reassuring diversification benefits seem misplaced. Why? Within each of these schemes are concentrated periods of interest-rate pivots. They are short, intentional, and reflect a realized increase in borrowing costs. Essentially, the rate regime resets. Here, we’ve defined these moments as months when both the 10-year U.S. Treasury yield and the effective Federal Open Market Committee rate increased by 10% or more, year over year. There are eight of these pivots in the six decades mentioned above. And with the exception of the ZIRP era, in each of the four established monetary policy periods, a pivot correlation between stocks and bonds reaches a point where it noticeably exceeds that of its regime. These are moments when rates move higher, bond prices move lower, and correlations rearrange.
When the Fed began aggressively raising rates in 2022 (spanning a period from March to December), the correlation coefficient between stock and bonds registered at 0.6. Rather than maintain a period of low rates indefinitely, the Fed has been in the process of resetting rates, faster and higher than it has in decades, as it tackles unwieldy inflation and recalibrates the yield potential of U.S. Treasury bonds. We refer to this proposed distinct monetary policy regime as “the Great Unknown,” and it begins with the most recent interest-rate pivot in our dataset. Similar to the four monetary policy regimes previously described, the contours of this one reflect the unique challenges of its era: excessive inflation and asset bubbles fueled by excessively low-borrowing costs.
Paradoxically, investors should find interest-rate pivots encouraging. Although painful, without these, bonds would lose their long-term diversification benefits. Inflation combined with persistently low rates detracts from a U.S. Treasury bond’s income-generating ability. And when rates sit at or near zero, the expectation that they must rise to restore elements of economic equilibrium fuels volatility in bond prices, too. Nobody wants to hold a bond knowing that aggressive rate increases are on the horizon. A higher rate reset now creates better opportunities for bonds later.
Plus, the likelihood of experiencing diversification benefits from bonds increases over longer periods because painful interest-rate pivots are typically short. Indeed, the rolling three-year correlation between stocks and bonds equaled or exceeded 0.30 in only 30% of the 720 periods (spanning 60 years) analyzed here. That’s attractive relative to other asset classes often used as portfolio diversifiers, such as REITs, high-yield bonds, and international equities. And between the interest-rate pivots identified in the exhibit above, it took rolling three-year correlations anywhere from one to eight years to fall to a reset low, but they do eventually fall. Well-diversified portfolios with long time horizons benefit from patience.
Navigating Interest-Rate Hikes for Your Portfolio
Although rising interest rates lead to closer links between stocks and bonds, anticipating the magnitude of a rate rise and the length of time for the climb is difficult. In fact, many professional investors manage strategies as duration-neutral to a chosen benchmark given the difficulty in calling interest-rate changes. But that doesn’t mean there is nothing to do. Nimble investors may mitigate pain from rising rates with some thoughtful planning. For example, reducing duration by rotating out of longer-duration bonds or funds and into intermediate- or short-duration alternatives will reduce potential volatility during interest-rate spikes.
It’s also useful to consider diversifying within the bond portfolio. Floating-rate bonds offer a reprieve from worrying about the direction of rates, but these may also introduce more credit risk than a government bond would. Instead, a thoughtfully sized exposure to asset classes with a generally low correlation to equities, such as gold or an equity market-neutral strategy, can cushion losses from a bond portfolio during periods of aggressively rising rates. And one of the easiest ways to combine the prior two recommendations is to consider an actively managed bond strategy with a shrewd, well-resourced manager and a disciplined process. A portfolio manager with the right tools can swiftly adjust her bond portfolio in small but meaningful ways (such as adding broader diversification across sectors or geographies), while an index fund has far less flexibility to sidestep the inevitable.
And what can be done with a portfolio following the end of an interest-rate pivot? Investors shouldn’t ignore that the opportunity set changes. Cash-like investments, such as money market funds and ultrashort bond offerings, offer better yields when interest rates rise. Following this particular pivot, the move away from interest rates of zero gives investors an opportunity to exchange volatile income-generating holdings for more moderate versions, maintaining return expectations but improving their portfolios’ risk profiles. And most importantly, investors should remain focused on the long term. Diversification benefits accrue, slowly and steadily, over decades and through interest-rate pivots. That is the secret sauce behind the enduring strength of the basic 60/40 portfolio, which has typically generated more attractive risk-adjusted returns than a portfolio of only stocks or bonds over the past six decades.
The author or authors do not own shares in any securities mentioned in this article. Find out about Morningstar’s editorial policies.
/cloudfront-us-east-1.images.arcpublishing.com/morningstar/6ZMXY4RCRNEADPDWYQVTTWALWM.jpg)
/cloudfront-us-east-1.images.arcpublishing.com/morningstar/URSWZ2VN4JCXXALUUYEFYMOBIE.png)
/cloudfront-us-east-1.images.arcpublishing.com/morningstar/CGEMAKSOGVCKBCSH32YM7X5FWI.png)
:quality(80)/s3.amazonaws.com/arc-authors/morningstar/bdf88cbd-d3d8-4661-b946-d09f9ffe196b.jpg)