
How to Compare Portfolio Holdings
Morningstar Direct's options to compare portfolio holdings.
/s3.amazonaws.com/arc-authors/morningstar/f941dc8b-2530-4a0b-ad78-555027eae4c1.jpg)
There are many ways to compare two equity funds. One of the best is to contrast their holdings. One of the most common ways to do this in Morningstar Direct is to use the “Comparison: Holdings” report in Workspace.
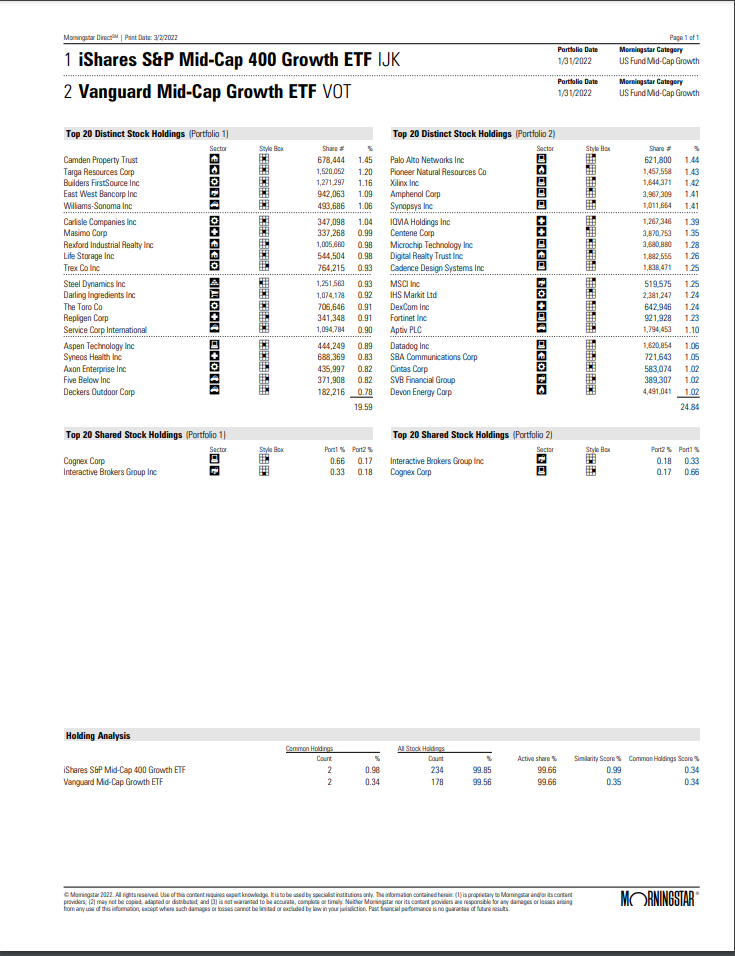
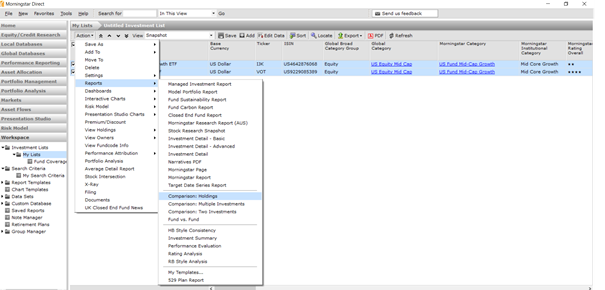
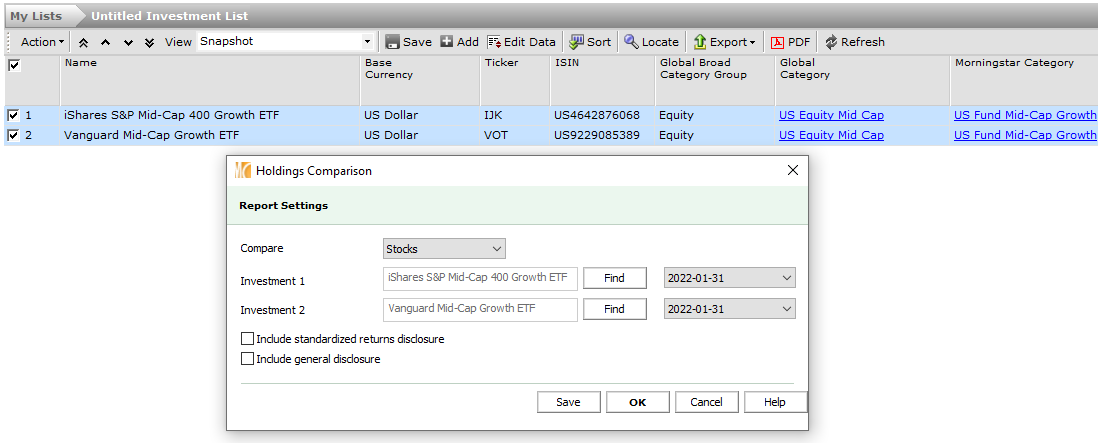
You can find the report in the Workspace module under both Investment Lists and Search Criteria. To create it, select and highlight two investments of any type; however, you must have access to their constituents for the report to work (this is very important if looking at a market indexes). For an example, let’s look at two exchange-traded funds with similar names, but little overlap: iShares Mid-Cap 400 Growth ETF IJK and Vanguard Mid-Cap Growth ETF VOT.
Once highlighted, select the “Action” button in the top left corner and go to “Reports”--“Comparison: Holdings.”
In the next screen, you will have the option to look at stocks, bonds, or both. You can also select the portfolio holdings date for the investments.
Selecting “OK” will generate the report. The “Top Distinct” and “Top Shared” holdings at the top of the report are somewhat self-explanatory. However, the “Holding Analysis” section at the bottom can be a bit more confusing.
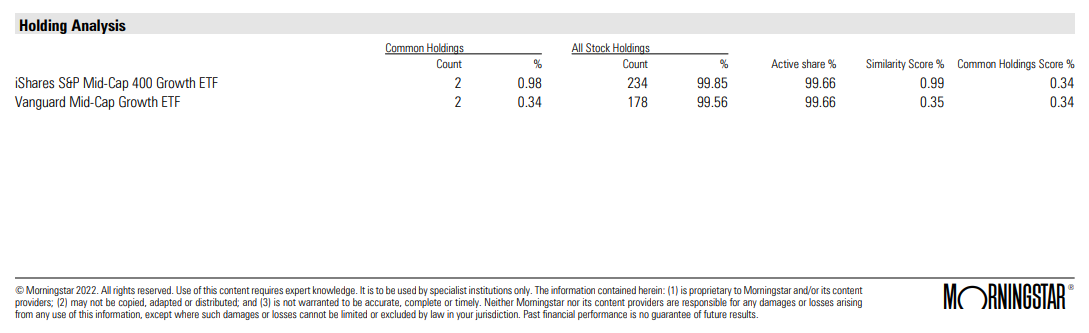
The “Common Holdings” columns show the number of stocks that each fund holds in common with the other and how much of each portfolio those shared holdings take up in percentage terms. In this example, the two overlapping stocks, Cognex CGNX and Interactive Brokers Group IBKR, make up 98 basis points of iShares S&P Mid-Cap 400 Growth ETF’s portfolio.
The “All Stock Holdings” columns include the number of stocks included in this report and their corresponding market value of the subject investment. Skipping over the “Active Share %” column, the “Similarity Score” is simply the product of the “Common Holdings %” column and the “All Stock Holdings %” columns.
The “Common Holdings Score %” and the “Active Share %” should be inversely related; together, they should sum to 100%. The “Common Holdings Score” is the minimum percentage of all common holdings between both investments, or more directly, the lower value of the two “Common Holdings %” column. The “Active Share %” is 100% minus the “Common Holdings Score %”.
Looking at the example report, the two holdings in common only make up 0.98% of iShares S&P Mid-Cap 400 Growth ETF, while the two stocks make up 0.34% of Vanguard Mid-Cap Growth ETF. Because the 0.34% overlap is smaller for Vanguard Mid-Cap Growth ETF, that results in the Common Holdings Score for both ETFs.
While the "Comparison: Holdings" report contains a lot of information, it has some limitations. First, you can only compare two investments at a time. Second, the report only lists the top 20 shared or unique holdings in the portfolio, which is useful, but not exhaustive. There are several other tools in Morningstar Direct that go further. The "Stock Intersection" report solves both problems. It builds a completely exhaustive list of every stock in a portfolio. It can also compare up to 100 investments, but it will take longer to load if you select a lot of investments.
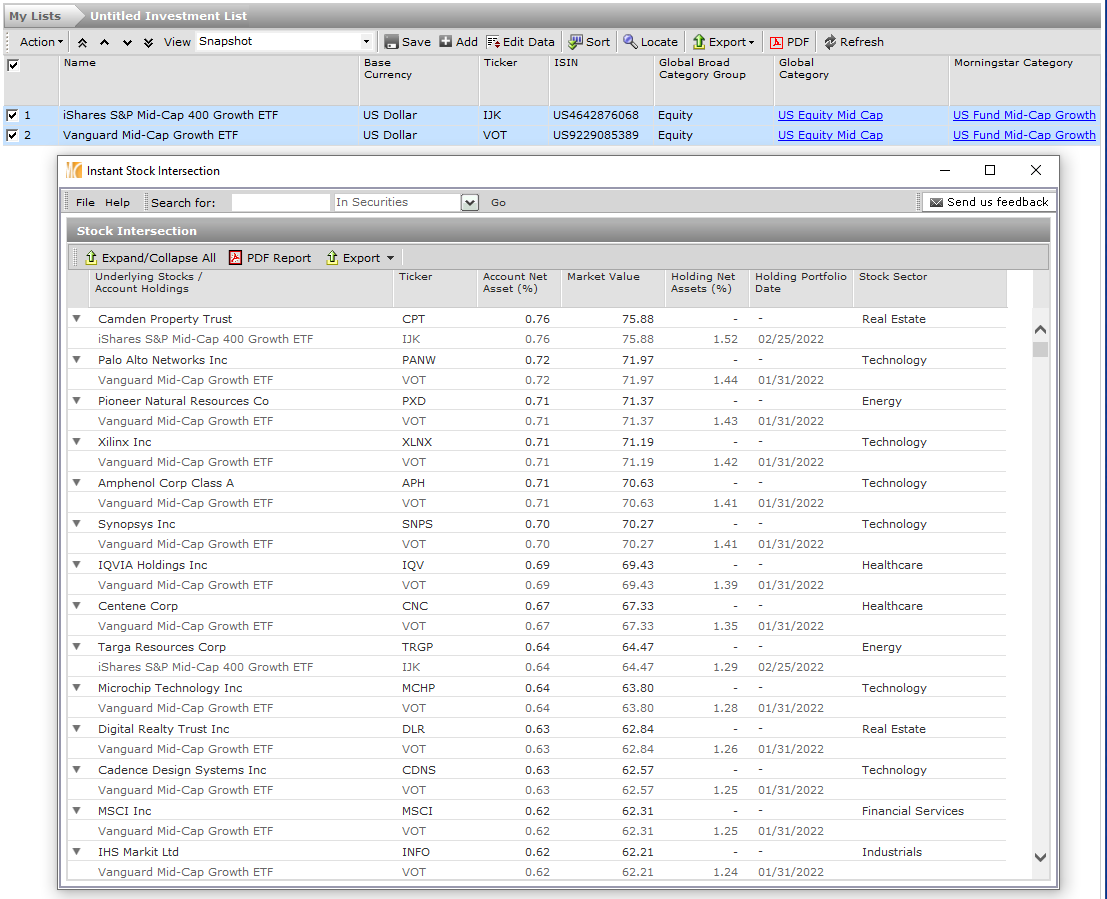
Running the "Stock Intersection" report is similar to the "Comparison: Holdings" report. Bring the investments into Workspace, highlight them, select the “Action” button, and choose “Stock Intersection” in the dropdown.
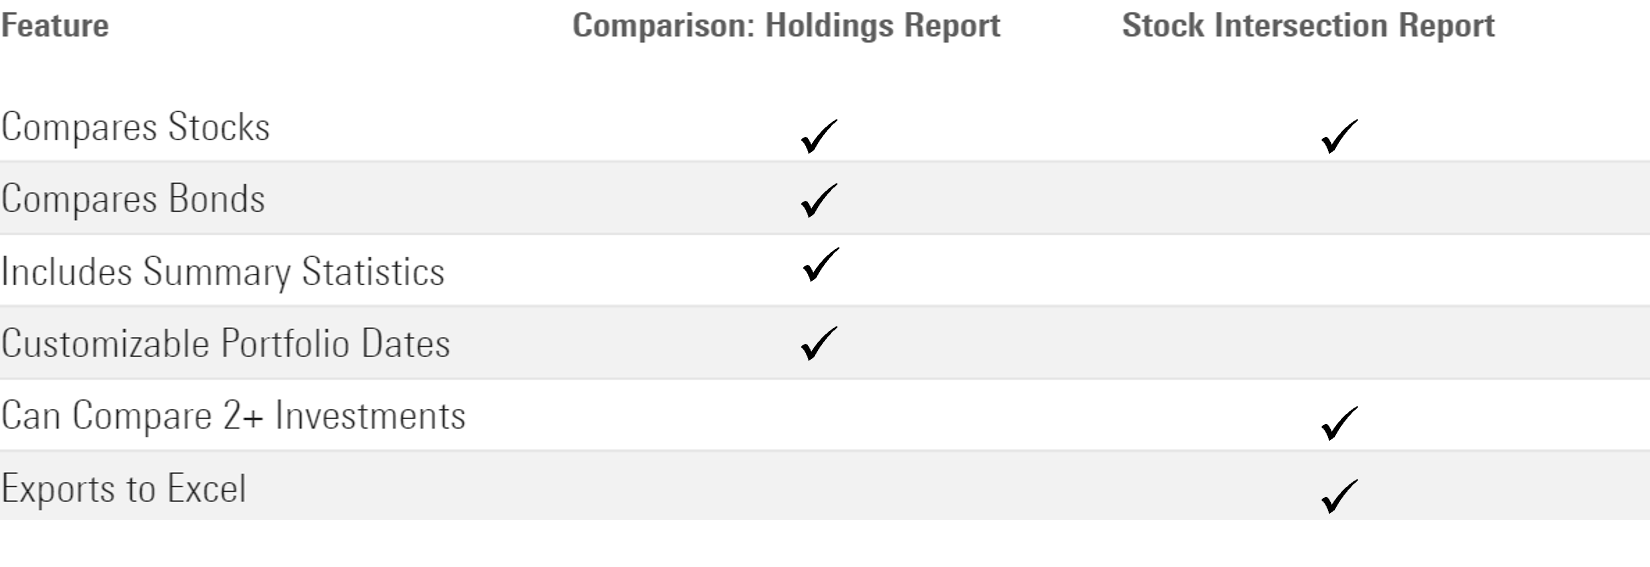
You also can easily export this report to Excel for further analysis. The downside is that this report will not include key summary statistics like overlap and active share that the "Comparison: Holdings" report includes. The report is also not very customizable; portfolio dates default to the most recent portfolio date and can’t be modified. There also is no ability to look at bonds in this report--only equities.
If we run the Stock Intersection report for iShares S&P Mid-Cap 400 Growth ETF and Vanguard Mid-Cap Growth ETF we will get a similar outcome to the "Comparison: Holdings" report. The report will display all 410 holdings that are in both ETFs (IJK’s 234 holdings + VOT’s 178 less two holdings in common). If you select “Expand/Collapse All” you can see which fund holds which stock. Under Cognex and Interactive Brokers Group, both ETFs will be listed as they are held in both portfolios.
The chart below summarizes the differences between the "Stock Intersection" report and the "Comparison: Holdings" report.
Morningstar Direct also added several new Notebooks in the Analytics Lab module that allow users to dive even further into portfolio holdings. For example, the “Stock Ownership Analysis” notebook allows users to see which open-end funds and ETFs hold a certain equity. The recently added “Individual Trade Analysis” notebook shows users how a certain portfolio manager traded a specific holding in a portfolio. All these tools in Morningstar Direct help users make a more informed decision when comparing investments.
/cloudfront-us-east-1.images.arcpublishing.com/morningstar/6ZMXY4RCRNEADPDWYQVTTWALWM.jpg)
/cloudfront-us-east-1.images.arcpublishing.com/morningstar/URSWZ2VN4JCXXALUUYEFYMOBIE.png)
/cloudfront-us-east-1.images.arcpublishing.com/morningstar/CGEMAKSOGVCKBCSH32YM7X5FWI.png)
:quality(80)/s3.amazonaws.com/arc-authors/morningstar/f941dc8b-2530-4a0b-ad78-555027eae4c1.jpg)