
What’s Ahead for Stocks This Quarter—and Where to Invest
Morningstar’s chief market strategist and economist share their outlooks for the fourth quarter of 2026.



Key Takeaways
- A third-quarter performance recap and where US stocks stand today.
- The key risks to watch in Q4.
- Which sectors, styles, and market caps offer opportunities, and where valuations look stretched.
- Morningstar’s latest list of analyst stock picks.
- Morningstar’s US economic outlook heading into 2027.
- What rising rates and growing strains in private credit mean for fixed-income investors.
In this bonus episode of The Morning Filter podcast, host Dave Sekera sits down with Morningstar Chief Economist Preston Caldwell to discuss their market and economic outlooks heading into the end of 2026. Tune in to find out why stock selection is becoming increasingly important, what valuations are signaling to investors, and how to position your portfolios as market risks continue to build.
They unpack expectations for economic growth, inflation, and interest rates and discuss how the artificial intelligence boom is affecting the economy. They close by talking about mega-cap stocks, what’s behind the rise in bond yields, and why conditions in private credit continue to worsen.
Have an idea for a bonus episode of The Morning Filter? Send it to themorningfilter@morningstar.com.
Transcript
Susan Dziubinski: Hello, I’m Susan Dziubinski. Welcome to a bonus episode of The Morning Filter podcast. As regular viewers and listeners know, we’re dropping some bonus episodes of the podcast covering topics that you’ve told us you want to hear more about. If you have an idea for a bonus episode, send it to us via our email address, which is themorningfilter@morningstar.com.
Today’s bonus episode is a replay of Morningstar’s fourth quarter 2026 Stock Market Outlook webinar. The webinar features The Morning Filter co-host, Dave Sekera, and Morningstar Chief Economist Preston Caldwell. Dave and Preston share their outlooks for stocks, bonds, inflation, interest rates, and the economy for the remainder of the year. This presentation was taped on Oct. 13, 2026.
David Sekera: As always, I’m just going to start off with a broad discussion of the US equity market evaluation. We’ll dive into sector valuations and some top picks and then discuss evaluation by economic moat. I’ll turn it over to Preston, who will then review his US economic outlook. We’ll do a quick overview of mega-caps and fixed income and take as many questions as we can. Let’s just get into where we are today.
US Equity Market Valuation
At the end of the third quarter on Sept. 30, using our valuations, the US equity market was trading at a price/fair value of 0.9. Essentially, that means the market was trading at a 10% discount to a composite of our fair value estimates. Now, for those of you who aren’t familiar with our
Price/Fair Value by Morningstar Style Box
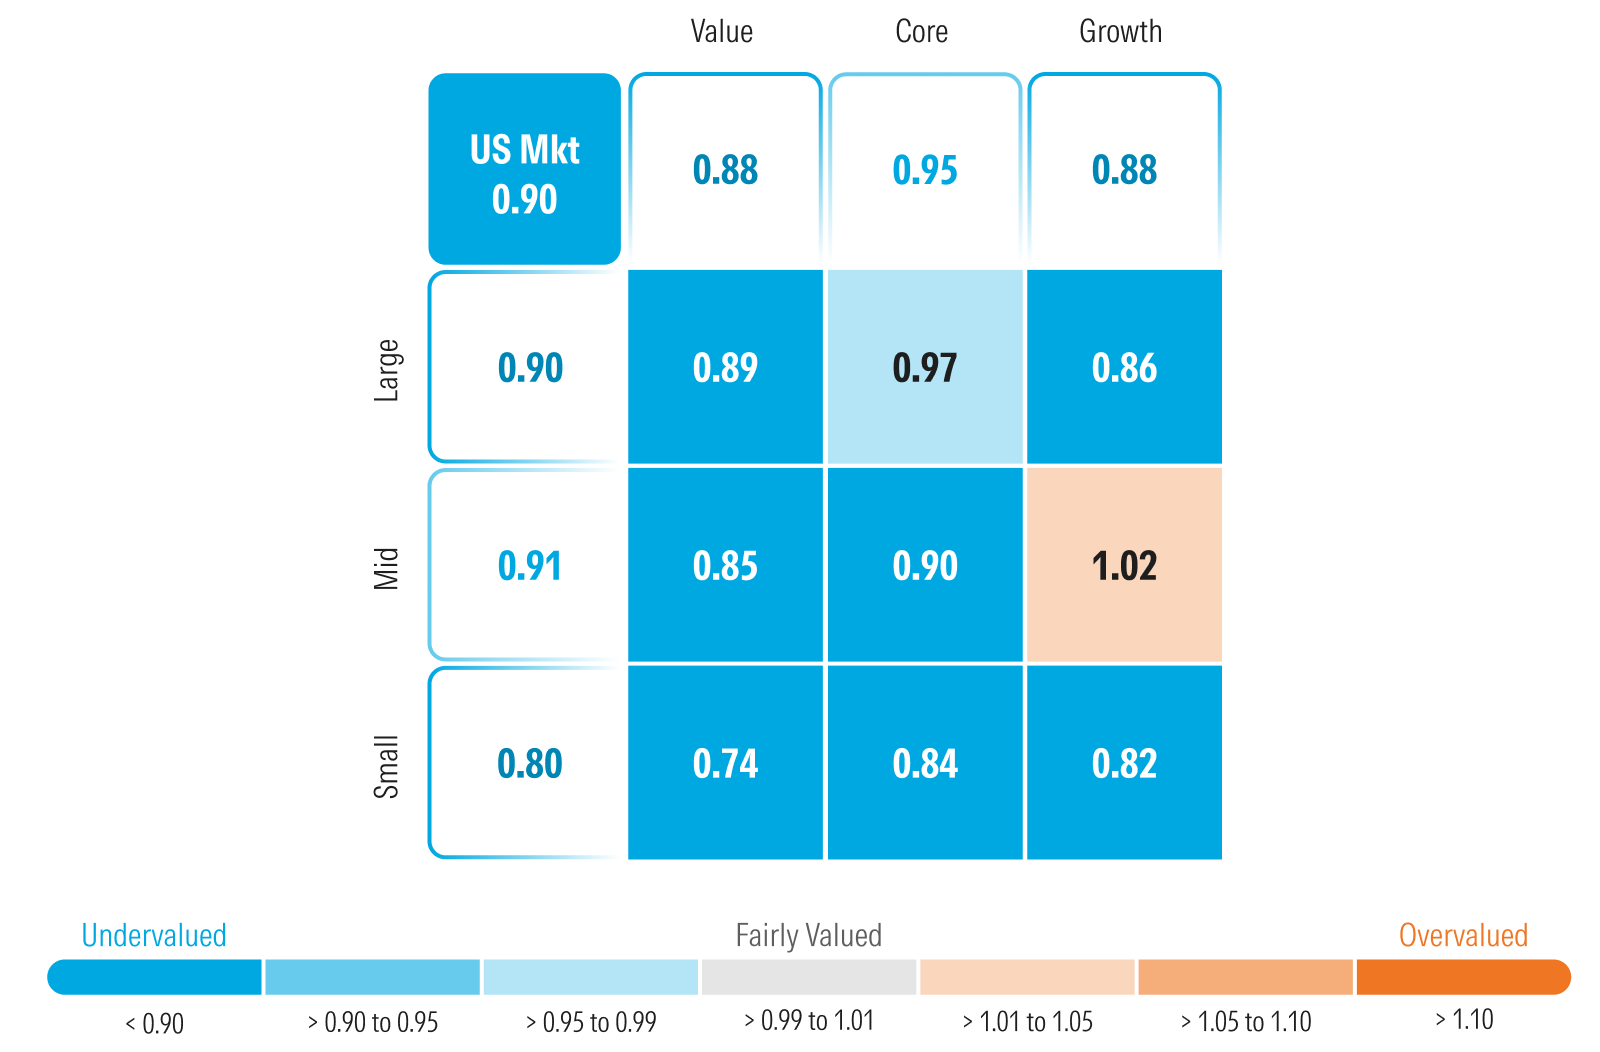
Now, the thing that I see today that’s a lot different from what we’ve talked about in the past is just how much more individual stock selection is becoming increasingly important. When we did our valuations this quarter, I noted that the discount that the market’s trading at overall is really heavily skewed by what I’m now calling the Undervalued Seven. That’s Nvidia NVDA, Broadcom AVGO, Microsoft MSFT, Alphabet GOOGL, Tesla TSLA, Amazon.com AMZN, and Meta Platforms META. If I actually were to remove those seven stocks from our valuation, the rest of the market composite is trading pretty close to fair value at today’s levels. I also want to note here that again, we’re having another shift in our valuations toward a barbell-shaped portfolio: slightly overweighting value, slightly overweighting growth, and in order to pay for those overweights, being underweight core. We’ll get into that a little bit more as we talk about how the skew from the Undervalued Seven impacts how to be able to invest in those different categories. Overall, at that 10% discount, I still think, as an investor, you should be market weight equities. I’m not necessarily ready to go to an overweight yet. A lot of times, when you get to about this amount of discount or slightly more is a good time to start overweighting.
But when I look at the macrodynamics out there, and we’ve talked about this on the podcast, and I believe the last webinar as well, macrodynamics are really getting pretty ugly. They’re a lot more challenging for the marketplace going forward. We’ve recently had the Federal Reserve already tighten monetary policy with its first hike. Preston will give his opinion, but I think we’re looking for another rate hike by the end of the year. We’ve had long-term interest rates rising across the board, both in the US as well as pretty much all the other developed markets. US Treasury: The 10-year, for example, has gone up over a hundred basis points year to date. We’re at five and a quarter right now. Looks like we’re getting a little bit of a pause here, but we’ll see whether or not that trend continues in the short term before we think long-term rates start coming back down.
Price/Fair Value of Morningstar's US Equity Research Coverage at Month End
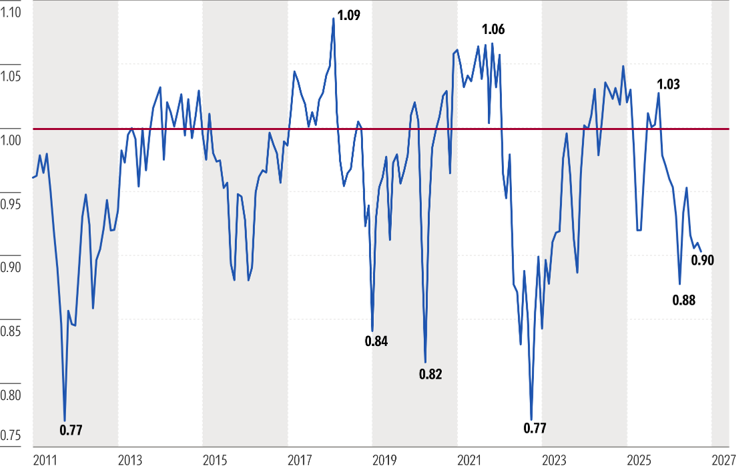
Inflation is still elevated, not necessarily rising at scary rates at this point in time, but certainly higher than you or I, or the Fed, certainly, would prefer. The US economy is reliant on the AI buildout. We’re still expecting that AI buildout to grow even more into 2027, but of course, if that were not to come to fruition, that would be a big risk for a lot of those AI stocks. When I look at a lot of the international economies, whether it’s the EU, Japan, or China, I would note that those economies are pretty stagnant at best. Economies like China, I don’t think, are anywhere near as strong as what the reported metrics are. We’ve noted this in the past webinar, too, as well. A lot of cracks in the private credit markets, and we’ll talk about that when we talk about our fixed-income outlook.
Just a quick review of how the market performed last quarter. Up about 1.7%, really supported by the value sector, which was really all about
And then, of course, just looking at the returns by capitalization, large-cap stocks, specifically those that are leaders in AI that are doing really the most of the buildout boom, had performed well. Of course, we had rising oil prices lifting the largest of the energy stocks like ExxonMobil XOM. That was enough to put the large-cap category into positive territory. As far as the mid-cap and small cap, both of those saw losses. Specifically, I’d say in the small-cap space, I think a lot of fear about how rising interest rates—short-term interest rates, specifically, with the Fed raising fed-funds rates—could impair a lot of those companies’ earnings in the short term. A lot of those companies do have floating-rate debt, so they will be paying higher interest costs over the next couple of quarters.
Year to date, it’s been a pretty good year. I mean, up 12.5%. I don’t think anyone can complain about that compared with how strong of a market we’ve had the past couple of years. Now, the numbers here may look a little awkward compared with the value of the core and the growth categories. I just have to remind people that in the index calculations, the calculation for the broad market is unconstrained. Therefore, the full market capitalization increases of all of those mega-cap stocks that went up is reflected in the 12.5%. But then within the individual categories, value, core and growth, those are constrained indexes such that the largest of the mega-cap stocks are only allowed to be up to a certain percentage of that overall category. That’s why you see the returns there being lower than what they were for the overall market.
Value stocks, of course, benefited from a rotation into several different defensive sectors. Within the core category, just those handful of tech stocks we already talked about drove about 80% of the return there year to date. Then within the growth category, the tech sector, larger gains in the overall sector with Nvidia, Advanced Micro Devices AMD, SanDisk SNDK; those three stocks accounted for about 60% of the category gain in and of themselves. Of course, large-cap stocks still being the primary beneficiary of the AI buildout boom. What I wanted to show in this chart is how using
While we’ve had a market weight opinion on stocks overall as a percentage of what your target allocation is, the beginning of the year, we had started with a barbell-shaped portfolio, recommending to being overweight value, overweight growth, and underweight core. We had the big market hit in February and March to the point that value stocks, I think not only held their value, some of the value stocks actually performed pretty well. We thought it was time to take the profits in the value category and do an even further overweight into the growth category, which became by far the most undervalued part of the market and then move from an underweight to a market weight and core.
Now, by June, we saw the market move pretty substantially up off of those lows, getting to the point where it looked like a lot of those category weightings were really pretty close to the overall market. So then, we’re moving back toward a balanced portfolio across each of the three categories. Today, looking back to the barbell: back to overweight value, overweight growth, underweight core, based on the valuation. Again, I think this is a good way to help investors be able to identify those areas of the marketplace that are undervalued, steer clear of some of those that are more overvalued, to be able to make those reallocations in your portfolio allocation.
Just taking a quick look at how returns have performed here in the third quarter. Of course, energy has been a very volatile sector, skyrocketing after the first conflict with Iran started, then oil prices moderated, then those came back down, oil prices back up again. So, energy was the top-performing sector this past quarter. Taking a look at tech, the second best-performing, I would say almost 60% of that tech rebound was really just coming from a big bounce in Microsoft stock. That, of course, is a stock that we’ve been very constructive on pretty much for the entire year. It got pulled down with the “SaaSpocalypse,” the selloff in all of the software stocks that we didn’t think was warranted, and that one has actually been moving up pretty nicely ever since.
Within the sector for healthcare, pretty widespread gains overall, not necessarily one individual stock or another that really accounted for all of the returns. With interest rates rising, the
Tech stocks are just the biggest beneficiary of the AI buildout boom; still very strong performance there. And really, even with the pullback in industrials last quarter, some of those second-derivative plays on AI still have led to very strong gains in the industrial sector overall. Rounding that out, I’d just say healthcare also was an undervalued sector that’s just seen good broad-based gains across the entire board. Looking at some of the losers here: consumers, a lot of the concerns that have really risen with inflation, wages lagging, changes in how consumers are spending their money hit the
Taking a look at the contributors for the third quarter, and again, these top 10 contributors actually had higher returns overall than the overall index return. I think that’s just one of those indicators that show how poor the market’s breadth is and just how concentrated returns have been specifically in a lot of these AI leaders. I’d say this quarter, it’s a little bit more diverse as far as who were some of these top 10 contributors. Last quarter it was really purely all of the AI plays. At this point, we have a couple of those energy names that kind of rounded out, as well as a couple of other non-AI plays like CrowdStrike CRWD or ThermoFisher TMO.
For your review, just looking at what our ratings had been over the past quarter to where they were quarter-end with the performance of the stock compared with our valuations. Looking out to the downside, the third-quarter detractors—these are the ones that pulled down the overall index the most—Applied Materials AMAT, KLA, KLAC, Lam LRCX, Intel INTC; all of those had big retreats after the runup in the first half of the year. A lot of those being companies that really got pulled up with that whole commodity AI tech buildout boom. It’s hard to even really describe what that little mini bubble was, but it pulled up all of these stocks, and we just saw all of them roll over really in June. Most of those were pretty much 1-star-rated stocks. Again, you can see what our ratings were here at the end of June, pretty much all of these being 1- and 2-star-rated stocks. A couple of stocks that we thought were undervalued that had not necessarily performed, but we actually still see a lot of value in those stocks. Some of the other ones have fallen enough that they’re now either in fair value territory or not as overvalued as they were before.
This chart I’ve shown for a while now, and again, it shows what the composite of the value price/fair value is compared with the broad marketplace. If you think about 2023, 2024, and most of 2025, we highlighted that within the market valuation, value stocks on a relative value basis were some of the most undervalued stocks across. Now, once the market took the big hit at the beginning of the year and we saw that big rotation out of growth into value, you saw just how far overextended that became, quick bounceback and forth a couple of times. But I’d say at this point, value is really pretty close to being similarly valued with the broad market. We’re not necessarily seeing that same kind of divergence that we’d seen for those three years a little while ago.
Similarly, we’ve been noting for quite a while just how undervalued small-cap stocks have been compared with the broad market. They’ve done relatively well thus far this year until really the past couple of weeks, in which we have had that selloff. Again, a lot of that selloff, I think, is really due to those rising interest rate concerns and how that negatively impacts small caps more than it would large- and mid-cap stocks. The key risks still have really the same key risks that we’ve talked about for much of the year. There’s really nothing any different as far as that goes.
Sector Valuations and Top Picks
Just rolling into our sectors. This is a breakout of our sector valuations by percentage of stocks in each sector and the market overall. This one is not market-capitalization weighted. We’ll show that in a little bit, but again, showing that by the number of stocks, there are still a lot of undervalued opportunities out there. It’s just that these are stocks that are not necessarily in the headlines. It takes a little bit more digging, a little bit more due diligence in order to be able to find some of these outliers that are still trading at pretty decent discounts.
This just shows how concentrated the market is by capitalization, by sector, using our
Taking a look at where we see value today, again, just taking a look at the
Just rounding out our best picks. A lot of new best picks coming from our sector directors. Albermarle ALB, of course, that’s one we have talked about multiple times in the past when that one sold off. That’s kind of been our go-to pick for the lithium industry. And then a few more new basic materials picks here. Not a lot really to talk about, but again, it’s these kind of more smaller and mid-cap names that have been left behind that we start to see some of the most value in today. Other than that, a couple of other new names in here. Nu Holding NU, that’s one if you’re looking for more of an emerging-market play; that one’s going to be leveraged to financial services in Brazil. That one, I think, is interesting with what we’re seeing going on with the Brazilian government. Only a couple of new picks here looking at the energy sector: services like Baker Hughes BKR, a new pick here, Expand Energy EXE, Amazon coming back onto the list, and Google also coming onto the list.
Then rounding out here, Hershey HSY. This is a stock that we’ve recommended back and forth a couple of times. A lot of volatility in a stock that wouldn’t necessarily be volatile. A lot of the story there is what’s going on underlying the fundamentals with the cocoa market, but this is one where, as a long-term investor, you’ve actually been able to position yourself in and out of that one a number of times. BioMarin BMRN, I think this is a new, interesting one to take a look at in the healthcare sector. Generally, I think the market is really undervaluing a lot of their hormone and enzyme replacement therapies, and then Alliant Energy, making it on the list for the utility sector.
Valuation by Economic Moat
Valuations by economic moat. I would just say that no-moat stocks were the most overvalued by moat category coming into the quarter. Generally, we saw a lot of those no-moat stocks slide; specifically, a lot of those commodity-oriented tech hardware stocks brought that down, but even after those fell over this past quarter, still remain overvalued today. We’re really still focused on that wide-moat category, and even within that wide-moat category, it’s really hyperfocused then on the Undervalued Seven. And similar to the broad market valuation, those Undervalued Seven stocks account for the preponderance of all of the undervaluation in that wide moat category. If you were to exclude those wide-moat AI stocks from the wide-moat category, the rest of the sector is actually trading at a very slight premium today.
Using our Morningstar tools, just a couple of sorts that we do here, just identifying undervalued large-cap stocks with wide economic moats and then rank-order them from some of the most undervalued on up. The most undervalued one today is Broadcom. Just as a little commercial, I did a podcast on The Morning Filter with Will Kerwin. He’s the equity analyst who covers Broadcom, and we did about a 45-minute or so deep dive into his view on Broadcom, and I think we really reviewed what he sees there that the rest of the market is not giving the company value for. Certainly one of our top picks for wide-moat stocks today.
Then, just doing a similar sort for mid-cap stocks with wide economic moats. Lastly, also doing the same thing for small-cap stocks with wide economic moats. Really, all this is just to give you an idea of how to use some of the Morningstar tools to start looking for, scanning for, screening some of those undervalued opportunities, whether it’s looking specifically for wide-moat stocks or looking for stocks with maybe a low or Medium
US Economic Outlook
Caldwell: Thanks, Dave. Good day, everyone. Let me start out by outlining the key point I want to make in this section of the presentation, and it relates to two things that everybody is talking about: AI and this rise in bond yields. My argument is that the two are intertwined. That is, among all macroeconomic variables, interest rates are the set of variables most being impacted by AI right now. Indeed, AI, in my view, is the biggest factor in why interest rates are so considerably elevated above prepandemic levels. And insofar as you think that the AI boost will fade, at least incrementally as I do, that will put some downward pressure on interest rates in coming years.
So, what’s the overall economic backdrop? Well, over 2022-24, GDP growth averaged 2.8%. We’ve decelerated just incrementally from that owing to slower population growth and some other factors. We expect that deceleration to continue through 2028, with a slowdown in the growth rate and AI spending being the primary driver there. Not an outright drop in AI spending, but just a slowing growth rate, more of a plateauing in the spending level. We expect growth to reaccelerate again in 2029 and 2030 owing to monetary policy easing, and that easing will be triggered by the slowing growth rate in the economy as well as an eventual fall in inflation. Inflation was moving down for a while. That downward progress was arrested in 2025, partly because of the tariffs contributing around 20 basis points to inflation, and they’re also contributing around 20 basis points this year.
But, of course, the main event this year for inflation is this energy price spike contributing around 80 basis points to the rate of inflation. However, we expect that energy price shock to subside in coming years as the market does, and that will add a downward impulse to inflation. If you look at other factors, too, as I’ll talk about, like wage growth, all of that in my mind suggests optimism about inflation going forward. We think it should converge back to the Fed’s 2% target in the next few years.
On interest rates, so even before this year’s runup in bond yields, we were in a situation where rates were quite elevated, and I think that was weighing on the economy. It’s just that this has been continually offset by expansion and AI-related expending on the demand side of the economy, providing a key prop there, which means that, as I’ll talk about, once that AI boost starts to fade, interest rates will have to come down in order to accommodate that reduced demand-side boost. In order to ensure continued healthy economic growth, I expect the Fed to loosen monetary policy sufficiently to drive the 10-year Treasury yield down to 3.5% in 2029 and later years down from 5.2% currently. That’ll take us quite a bit closer to a kind of prepandemic regime of interest rates.
And so, concretely, in terms of the fed-funds rate, we do expect one more hike this year. Might happen in this month’s meeting, but either this month or the December meeting, I think they’ll hike rates one more time. But then I think toward the end of 2027, the Fed will pivot back to rate cutting, cutting rates twice in 2027, and then four times in 2028 in response to that slowing economic growth that I talked about, the slowing inflation and a weakening labor market, which is downstream of economic growth, of course. We think the federal-funds rate will get down to a target range ultimately of 2.50%-2.75% by the end of 2028. That would be a net 125 basis points in cuts from the current level. You can see that’s a pretty large gap from what the market is thinking right now. The market is pricing in substantial further rate cuts or rate hikes, not only one more at the end of this year, but then another two or three in 2027, and that high level of rates being held indefinitely. I don’t think that that’s, as I said, compatible with continued healthy economic growth; that elevated level of interest rates would ultimately cause a major deceleration in growth.
What are we seeing in the overall economy just to illustrate how AI is contributing? We see tech-related fixed investment, which AI is obviously the major driver for that think data center investment. That category, that tech-related investment, is contributing around a percentage point to GDP growth in year-over-year terms. You can see that, as consumer spending has just slightly decelerated, as we’ve had this slowdown in government spending, as all other business fixed investment has slowed, residential investment, all of those factors have been offset by this expansion and tech-related investment driven by AI. Now, that speaks to what’s driving the demand side of the economy, but really for AI to boost the rate of GDP growth, it has to boost the supply side of the economy, and the way that it would do that is through productivity.
Now, productivity growth is running strong. It’s averaged around 2% per year since the start of the pandemic, which, as you can see, well, as I show in the table, is considerably above the average over 2015 to 2019 of just 1.1%. We seem to have shifted into a higher productivity growth regime, but that began well in advance of AI. As I said, we had strong growth in 2020 and 2021 in productivity. 2022 was a bad year, but ’23 and ’24 were quite strong, and that acceleration is certainly before AI could have credibly provided any kind of boost. I don’t think, really, until the adoption of agentic tools toward the end of last year, was there any prospect of AI providing a huge boost of productivity? I don’t think AI has been the main driver of productivity growth yet. However, though, what I will say is that I do expect AI to sustain the strong growth rate and productivity that we’ve seen. That means that even with this incremental slowing in GDP growth that we project, that will be sufficient to push down the rate of job growth and thus push up unemployment, up to 4.7% by 2028 from 4.2% this year, which is not a large increase, but it will push the Fed to loosen monetary policy.
I would say we’re already in a state where the labor market is slightly weak in my view, and I could point to different indicators, but ultimately I think the proof is in the pudding by looking at wage growth. Nominal wage growth has gotten to a point where it’s perfectly consistent with the Fed’s 2% inflation target because it’s running at about 3.7%. If you subtract the productivity growth rate, which is running close to 2%, from that nominal wage growth, you get the implied inflation rate. That 3.7% minus 2% is 1.7%; less than the Fed’s 2% target. The point is that the labor market is providing no impulse to inflation above the Fed’s target at all right now. It’s perfectly consistent with low and stable inflation. I think that’s downstream of this continued looseness in the labor market. It’s not a super weak state, but it’s measurably less tighter than, let’s say, we were in 2019 on the eve of the pandemic when I think things were about in balance.
Now, that’s weighed on real wage growth. Inflation-adjusted wage growth has now dipped to about zero in the first half of this year. And that’s been one factor that’s pushed down on the personal savings rate. That low savings rate has helped to boost corporate profits this year, but I think households ultimately will have to correct. They’ll have to pull back their consumption in order to correct that low savings rate. That’s one reason why we expect consumption growth to decelerate in coming years.
As I said, I don’t think AI is a big boost of productivity. One reason why I think that is that a large boost of productivity would entail a much higher degree of layoffs as companies realize their labor savings and productivity gains by shedding their labor costs. If we look at the share of employment accounted for by the white-collar industries and the BLS data, that’s only modestly below its prepandemic trend at this point. Maybe it’s only about 0.4 percentage points of aggregate employment below its prepandemic trend. The true impact of AI is probably only a piece of that, I would say. As you can see on the top chart, there has been a downtrend in that white-collar employment, but most of that was just a correction in this overhiring that emerged in 2020 and 2021. All in all, we’re not really talking about a large impact, maybe in the hundreds of thousands of jobs, I think, from AI so far.
Now, we do see a canary in the coal mine just looking at the bottom chart, which is that the unemployment rate for young college grads has gotten quite elevated. It’s not far off its post-Great Recession mark, which is quite astounding just given the state of the overall unemployment rate. But maybe this is just a leading edge. It’s not indicative of what’s going on in the aggregate. As I’ve mentioned, we’re optimistic on the inflation front, and wage growth, as I just talked about, is a major reason why. But if there’s anything that was going to throw a wrench in our inflation forecast, it would obviously be energy markets. Oil prices are still highly elevated. Product prices are up even more. Gasoline’s doubled since January. Diesel’s more than doubled. That’s because most of this year it’s been easier to get crude out of the Gulf than products, and also because of the refinery outages in Russia.
The key factor really for us about energy markets is how backwardated that is downward sloping the futures curve is. That is, the futures market is implying that prices will fall dramatically over the next several years, even over the next 12 months. You can see that the 12-month price for each of these energy commodities on this chart is substantially lower than where prices are in the front month for futures. Now, our methodology is to rely on the futures market in our forecasting for oil and gas prices for a two-year time horizon. We know that futures markets are very efficient, and that’s proven itself time and time again, but they could be wrong certainly. Markets did underestimate the duration of the war at the beginning. That much is clear. I can imagine a nightmare scenario, of course, where not only does the Strait of Hormuz get closed again, but also there’s major disruption to a greater degree than we’ve seen thus far to the Red Sea. In that case, we haven’t seen the peak of oil prices, I think. Nonetheless, this is what we’re baking into our forecast, and I can’t gainsay it.
Let’s turn to bond yields. Starting off with just what’s happened this year, this increase in bond yields this year really isn’t massive by historical standards, as you can see from the chart that the 10-year’s up by 100 basis points, which, even when we’re not in an economic cycle turning point, has happened many times in the past. But the reason why it’s attracted so much attention is because it came at a time when interest rates were already so elevated above prepandemic levels. Now, the 10-year yield is up 2.7 percentage points above its 2017 to 2019 average. The key thing behind that, in my view, is the AI boom.
However, there’s another story that’s out there, which is that this is all about the increasing risk of a government debt crisis. What I’ll say, though, is that at least for the US, the story doesn’t make a lot of sense. If we look even in the period in 2025 when this so-called debasement trade was playing out, and gold was rising and we saw an expansion in long-term bond spreads, the 30-year rising versus the 10-year, throughout that whole period, long-term inflation expectations were muted. What this chart does is it decomposes both the 30-year and the 10-year yield into their real, or inflation-adjusted, component and the breakeven inflation rate, which is just the bond market implied inflation rate. You can see the 30-year breakeven and the 10-year breakeven, that the red lines, both of those have been utterly stable since the beginning of 2025, even as we have this rally in gold and even as yields have increased so dramatically this year.
What that suggests to me is that, first off, this rally in gold may be more about speculative momentum in asset prices than it is a really rational pricing in of risk. Also, as I stated, I don’t know if, for the US, government debt worries are the main thing that has been driving yields higher. And just to kind of hammer the point home here, for the US, the main risk I think that would materialize from a government debt crisis would be inflation. There are two main ways to get yourself out of a debt crisis. Assuming that you can’t cut spending or can’t cut deficits, then ultimately the government either defaults or it inflates its way out of the debt. The latter is a much more likely outcome by far for a country like the US, which controls its own currency. It’s quite striking that we don’t see any increase in long-term inflation expectations being priced into the bond market. It’s all on the real side. That speaks to things other than government debt risk, in my view, driving bond yields.
Why do I think AI is the major factor? If we look within private fixed investment, what we really see is this crowding out of other spending by AI-related spending via the mechanism of interest rates. So, tech-related spending—both the IT equipment and data center-related spending—as well as software research and development, you can see that soared on this chart here and accounts for actually more than all of the growth in private fixed investment that we’re seeing. High tech investment, up 15% year over year in the first half of 2026, but all other private fixed or non-residential fixed investment was down 4%; residential investment, also down. Most other types of fixed investment are very weak right now because I think interest rates are high, and interest rates have been driven up because of this AI factor, which is boosting the demand side of the economy despite interest rates being high. As I said, there’s this crowding-out effect that you see.
What that means, though, is that ultimately if this AI boost fades, then I think we will see a major correction in interest rates. I kind of see three paths forward basically for the AI boom. Now, the first path, which I think there’s a very good argument for it, and if you certainly listen to people who are close to the tech sector, this is their base case, is that the boom realizes its return on investment. The investment that we’ve seen is justified, but the way that that justification would happen, that realization of ROI would manifest, is, in my view, overwhelmingly via mass layoffs. In fact, very likely, I mean, in order to just pay for the amount of investment that’s occurring over the next two years, we’d have to see several million in layoffs of white-collar workers predominantly in order to create a labor cost savings that would pay for the AI spending that companies are engaging in. Because ultimately, the people who are paying for the data centers, they have to get revenue from end users, businesses who are dispersed throughout the entire economy.
If that happens, that’s going to be a contractionary shock for the economy because you’ll have a significant uptick in unemployment. Of course, in the long run, those workers can be redeployed, but in the short run at least, you’re talking about a large uptick in unemployment that will pressure consumer spending and other parts of the economy, as well as perhaps a rise in precautionary savings for people who still have their jobs, which is the opposite of what we’re seeing right now with the savings rate being very low. That would be a big contractionary shock that the Fed would have to offset by lowering interest rates.
Now, suppose that doesn’t happen, then I think we’re looking at a major correction in spending because, or I think it’s quite credible to expect a major correction in spending if those labor cost savings don’t occur, in which case we also would have a big contractionary shock hitting the economy in the form of falling AI-related spending. That also would put downward pressure on interest rates. The Fed would need to offset that contractionary shock. Now, the third path is that the bubble just keeps, or that we truly turn into a bubble and it just keeps inflating, which is that despite any near-term realization of return on investment, spending continues to grow higher.
What I would say is that can only go on for so long. In the short run, that could continue to push up stock prices, continue to push up interest rates in contrast with our forecast, but that only has a limited runway because at some point, the gargantuan levels of spending that we’re seeing have to demonstrate some return on investment in my view. It’s just a question of when. With that, I’m going to turn it back over to Dave to wrap up our prepared remarks.
Spotlight: Mega-Cap Stocks
Sekera: All right. Thank you, Preston. All right. Just want to highlight a couple of things before we turn to the question section, but I think this heat map really is indicative of showing just how concentrated the undervaluation in the stock market is based on our valuations today. You can see in the blue on the left-hand side of the screen what we’re calling the Undervalued Seven. Now, I think the big difference with investing in AI today, that may be where we are versus the rest of the marketplace, is that when I’m thinking about investing in AI, I really want to stick with the technological leaders in artificial intelligence. Those companies that are developing new chips, developing new software, developing new models, as opposed to those companies that we’re calling the AI followers, those that are the ones that have really been able to benefit in the short term because of the supply/demand imbalance for the amount of equipment and hardware that they need for building out all the data centers today.
We are seeing that those companies are redeveloping, redeploying their assets to be able to increase supply. They’re building out new facilities. We expect that 2028 is probably the peak of the market as far as the supply/demand imbalance. We expect that to quickly correct in 2029 and thereafter. That’s some of the biggest differentials in our views on a Micron MU stock than I think what the market is pricing in today. Again, I think this really just highlights how the Undervalued Seven just really dominate where we see value in today’s marketplace.
Then, getting back a little bit to what we talked about earlier, how to be able to position oneself. Again, when you look at which category these stocks are in between—the growth category and the core category—stocks that are in the core category, yet we still think you should underweight the category overall, means that you want to be overweight the individual core stocks that are undervalued and then have an even less underweight in maybe some of the mutual funds or ETFs that you use in order to get exposure to core. And then, of course, within the growth category, being very focused on those companies that are undervalued. The value category, I still think you can use mutual funds and ETFs in order to get some broad exposure across the entire category and value. We don’t see nearly as much concentration of undervalued opportunities and value that we do in the growth category. A couple of charts just talking about the market concentration really hasn’t been that much of a shift in these over the past couple of quarters, but again, just showing just how focused the market is in just a handful of these stocks, which, if there’s any kind of disruption to the story, to the investment thesis here, any broad selloffs in these stocks, of course, then have an even greater impact on the market to the downside.
And then just wrapping up here with some of the undervalued mega-cap stocks, how they performed over the past quarter. A couple of them actually have not done very well; Broadcom, unfortunately, slipped a little bit, but that’s still a stock that we have a lot of confidence in going forward. Taking a look at where the overvalued stocks have performed, pretty much most of these have fallen to some degree over the past quarter. Some of these—Applied [Materials], Lam, [Caterpillar] CAT—have fallen pretty substantially over the past three months. A lot of them are getting into that 3-star territory where they’re probably now more in the fairly valued range as opposed to being overvalued. But here’s where a lot more of these have performed, because we did have so many of these overvalued mega-caps last quarter. Again, a lot of red on that screen where you see these have fallen into a 3-star territory.
Updated list of undervalued mega-caps. Again, you can really see how the Undervalued Seven really dominate the most opportunities that we see today. And then, the updated list of overvalued mega-caps; a lot of these are going to be story stocks, really based on either continued short-term growth going too far into the future or maybe a stock like Micron, where we just have a differentiated view where we think that 2028 is going to be the peak for them being able to generate revenue and operating margin, and that will quickly correct to the downside thereafter.
Fixed-Income Outlook
Fixed-income outlook: Rising rates really just battered the market across the board. Pretty much the entire yield curve has shifted upward. You can see what the losses were by the individual types of categories here. Again, highlighting just how tight corporate credit spreads are. We saw them widen up pretty substantially in early 2025. We got a little bit of a selloff in early 2026 again, but they still are just at what I consider to be just way too tight of levels.
Now, we don’t have an index to show exactly what’s going on with the private credit market. I would just note that in the private credit market, they still continue to see more demand for redemptions than their gates allow. There are still people trying to take more money out of private credit than they’re able to take out of private credit every quarter. Morningstar DBRS, which is our credit rating agency subsidiary, has noted in their most recent report that even more private middle market issuers are requiring even more relief. At this point, of the companies that they have credit ratings on, 25% of them are under some sort of operating pressure, and 15% are looking for waivers, or they need capital support. That’s up from 10% a year ago. It is a category that we still continue to see getting worse going forward. And just our long-term charts for credit spreads, so for the investment-grade market and the high-yield market.
Dziubinski: We hope you enjoyed the webinar, and we hope you’ll join us on The Morning Filter podcast every Monday at 9 a.m. Eastern, 8 a.m. Central. Happy investing.
The author or authors do not own shares in any securities mentioned in this article. Find out about Morningstar’s editorial policies.

 United States