
Markets Brief: After the Election, Are Stocks Now Overvalued?
Plus: Bond spreads, inflation, and the impact of new presidents.


US equity prices spiked last week, rising 4.9% and pushing the market further into overvalued territory as investors processed the implications of another Donald Trump presidency, a further fall in interest rates, and continued earnings releases. Meanwhile, small and midsize companies rose faster than their large peers.
Will the Fed Hold in December?
Bond prices were volatile, as the benchmark 10-year Treasury yield rose to 4.5% early in the week before falling back to 4.3% by the end of Friday. Two-year yields also rose, ending the week at 4.3%, as the probability of the Fed holding interest rates steady in December doubled over the week from 17% to 35%, according to CME FedWatch. Morningstar’s chief US economist Preston Caldwell still believes the Fed will cut rates by a further 0.25 percentage points in December following recent weak employment data.
Bond Spreads Widen
Corporate bond prices rose 1.2% as spreads (the additional yields an investor receives above what’s available on government bonds) narrowed further, with high-yield bond spreads reaching their lowest point since 2005. Meanwhile, the US Dollar Index rose to its highest level since early July before declining on Friday.
Trump 2.0: The Impact
It is tempting to interpret these price moves as a harbinger of longer-term trends and adjust one’s portfolio accordingly. However, we always recommend investors prioritize research over reaction when assessing significant changes in the investing environment. To support this process, Morningstar’s equity researchers have published their analysis on how a Trump presidency could impact sensitive parts of the market, including Tesla TLSA, clean energy stocks, and the biopharma industry.
Do Presidents Matter?
A longer-term, data-driven perspective can also lead to better decisions. Philip Straehl recently studied the impact of presidents’ political parties on equity returns over their terms. Starting with James Garfield in 1881 and ending with Joe Biden, he found that political affiliation accounted for less than 1% of the difference in returns. Meanwhile, the starting valuation of the market when investing accounted for 18% of the difference. For an investor, valuations are far more important than whether your favored president is in the White House.
Tech Stocks Still Pricey
Because current valuations are higher than usual, the expected returns for the US market are lower. This somewhat pessimistic assessment is due primarily to the concentration of the benchmark index within large technology-oriented companies, many of which reported their latest results last week. These include Alphabet GOOGL/GOOG, Amazon.com AMZN, Apple AAPL, Meta Platforms META, and Microsoft MSFT. We continue to see opportunities in other parts of the US market and in other countries, where expectations are more modest. As ever, thinking independently and investing patiently is the key to longer-term success.
Inflation Data on the Agenda
While politics will likely dominate the news this week, economists will focus on the latest inflation data, which will be released Wednesday and Thursday, as well as economic activity data, which will be released Friday. The core measure of CPI (which excludes volatile food and energy prices) is expected to remain steady at 3.3% over the previous 12 months. A significant deviation from this outcome would likely change expectations for the path of interest rates and may cause some asset price volatility.
Highlights of This Week’s Market and Investing Events
- Tuesday, Nov. 12: Earnings from Home Depot HD
- Wednesday, Nov. 13: October Consumer Price Index report, earnings from Occidental Petroleum OXY, Cisco Systems CSCO
- Thursday, Nov. 14: Initial Unemployment Insurance Claims report, October Producer Price Index report, earnings from Walt Disney DIS
- Friday, Nov. 15: October Retail Sales, October Capacity Utilization, October Industrial Production, September Business Inventories, earnings from Alibaba Group Holding BABA
Check out our full weekly calendar of economic reports, consensus forecasts, and corporate earnings.
For the Trading Week Ended Nov. 8
- The Morningstar US Market Index rose 5.16%.
- The best-performing sectors were consumer cyclicals, up 7.20%, and energy, up 6.76%.
- The worst-performing sector was utilities, up 1.78%.
- Yields on 10-year US Treasury notes fell to 4.30% from 4.37%.
- West Texas Intermediate crude prices fell 0.04% to $70.41 per barrel.
Stock Highlights for the Week
- Of the 888 US-listed companies covered by Morningstar, 636, or 71.62%, were up in the past week, one was unchanged, and 251, or 28.27%, were down.
Which Stocks Are Up?
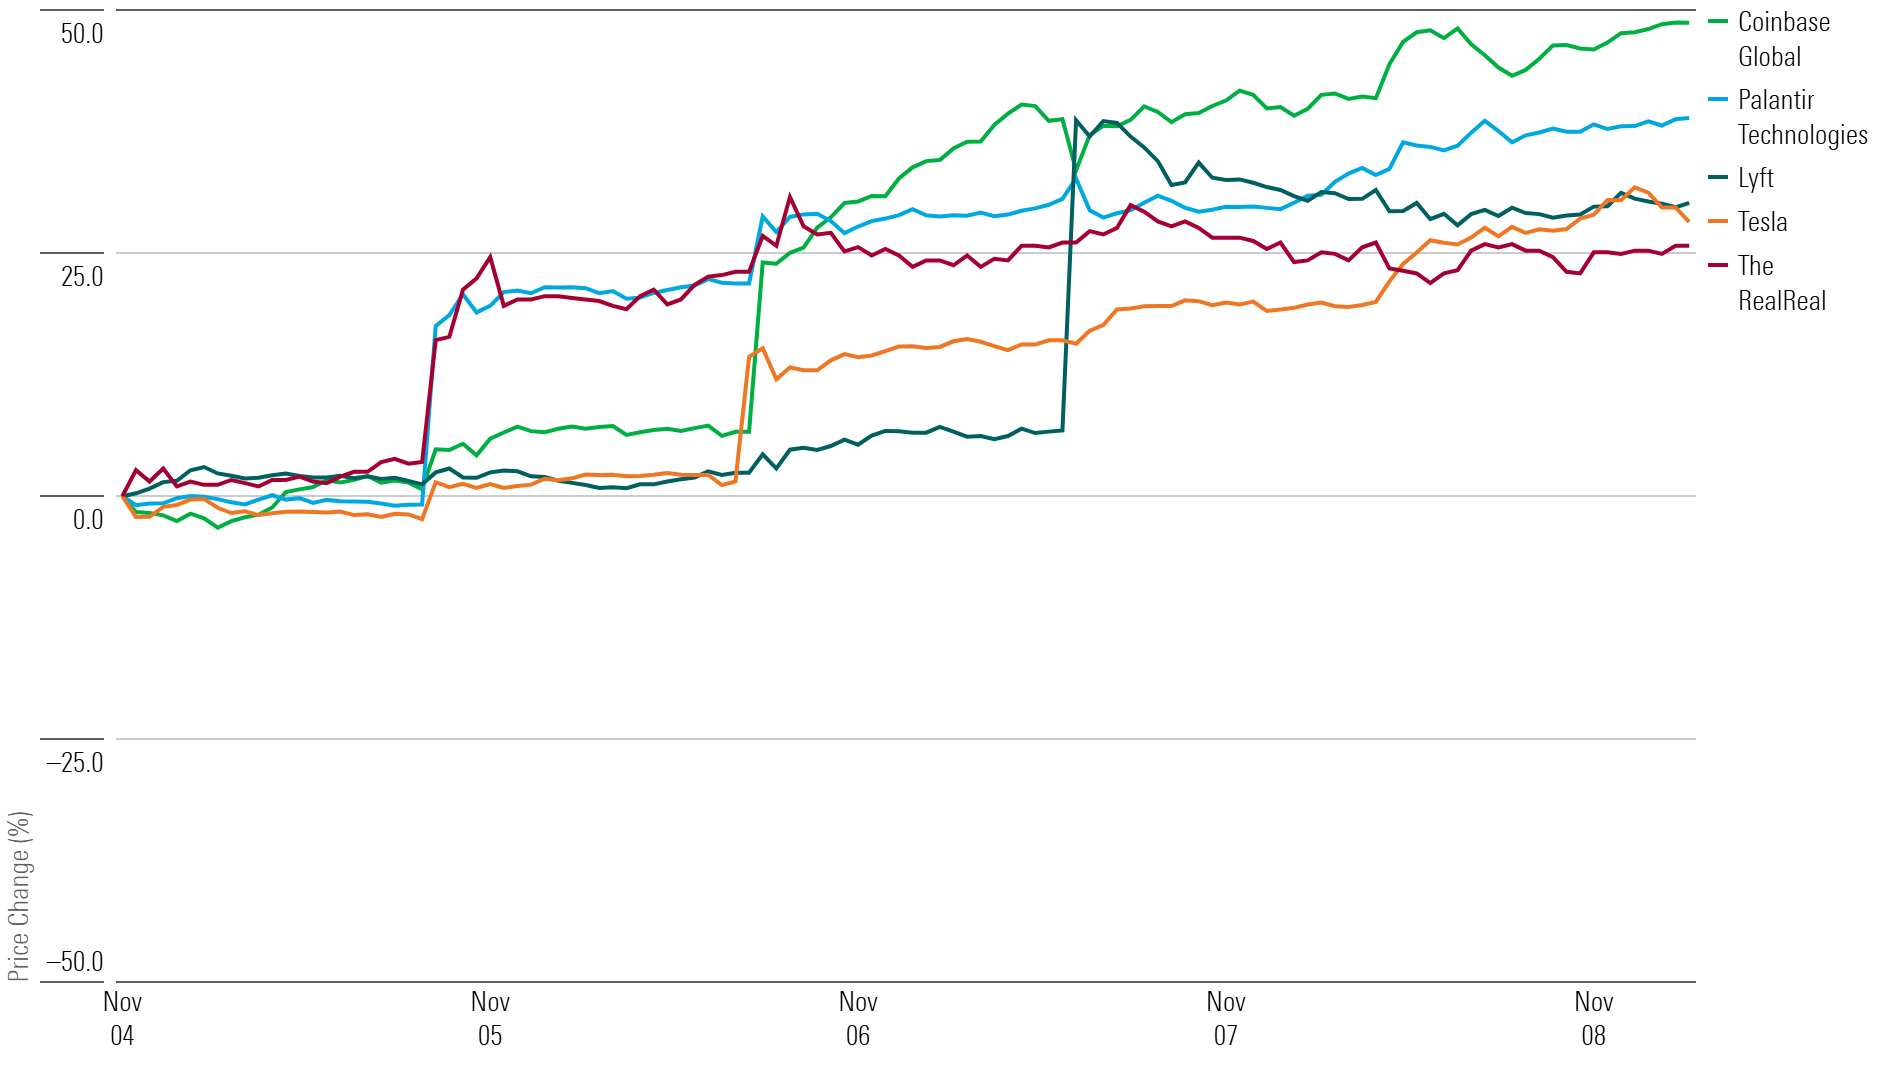
Coinbase Global COIN, Palantir Technologies PLTR, Tesla TSLA, Lyft LYFT, and RealReal REAL were the top performers among US-listed stocks covered by Morningstar analysts.
Coinbase was the best performer among the stocks in our coverage, gaining 45.35%. The stock is up 42.85% over the last three months. The no-moat company carries a 1-star rating and is up 186.94% over the last 12 months. The stock finished the week at $270.74, trading at a premium of 100.55% to its fair value estimate of $135 per share.
Palantir was the second-best performer, with a 41% return. The narrow-moat company is up 112.31% over the last three months and 197.23% over the last 12 months. Palantir finished the week at $58.39, leaving the 1-star stock trading at a premium of 178.05% to its fair value estimate of $21.
The third-best performer for the week was Tesla, rising 32.28%. The 2-star, narrow-moat company is up 54.83% over the last three months and 33.63% over the last 12 months. Tesla closed the week at $321.22, trading at a premium of 52.96% to Morningstar’s value estimate of $210 per share.
Lyft posted a 31% gain in the latest week, making it the fourth-best-performing stock on the Morningstar coverage list. Narrow-moat Lyft is up 94.82% over the last three months and has gained 63.34% over the last 12 months. Lyft finished the week at $17.79, leaving the 3-star stock trading at a discount of 11.05% to its fair value estimate of $20 per share.
RealReal was the fifth-best performer among US-listed stocks covered by Morningstar, gaining 25.75% during the week. The 2-star, no-moat company is up 57.14% over the last three months and 132.30% over the last 12 months. The stock closed at $3.76, trading at a premium of 64% to Morningstar’s fair value estimate of $2.25 per share.
Best-Performing Stocks of the Week
Which Stocks Are Down?
Marqeta MQ, Sunrun RUN, Celanese CE, Clarivate CLVT, and Exact Sciences EXAS performed worst among US-listed stocks covered by Morningstar analysts.
Marqeta was the worst-performing stock, falling 37.14%. The 4-star, no-moat company is down 22.31% over the last three months and 28.41% over the past 12. The stock closed at $3.74, trading at a discount of 37.67% to its fair value estimate of $6 per share.
Sunrun was the second-worst performer, losing 36.38% during the week. The 3-star, no-moat company is down 36.65% over the last three months but up 8.51% over the past 12. Sunrun finished the week at $10.23, trading at a discount of 31.8% to its fair value estimate of $15 per share.
The third-worst-performing stock for the week was Celanese, which lost 31.34%. The 4-star, narrow-moat company is down 27.69% over the last three months and 20.63% over the past 12. Celanese closed the week at $84.80, trading at a discount of 43.47% to its fair value estimate of $150 per share.
Clarivate fell 29.15%, making it the fourth-worst US-listed stock in Morningstar’s coverage. The 3-star, no-moat company has fallen 7.87% over the last three months and 32.76% over the past 12. The stock finished the week at $4.57, trading at a discount of 16.91% to its fair value estimate of $5.50 per share.
Exact Sciences was the fifth-worst performer, losing 27.63% during the week. The 4-star, no-moat company is down 4.93% over the last three months and has lost 18.48% over the past 12. Exact Sciences closed at $51.48, trading at a discount of 24.29% to its fair value estimate of $68 per share.
Worst-Performing Stocks of the Week

This article was generated with the help of automation and reviewed by Morningstar editors. Learn more about Morningstar’s use of automation.
The author or authors do not own shares in any securities mentioned in this article. Find out about Morningstar’s editorial policies.

 United States