
How the Largest Bond Funds Did Last Quarter
In Q1, Pimco Total Return ranked high, while Metropolitan West Total Return struggled.


With Federal Reserve interest rate cuts pushed to later in 2024, the first quarter was mixed for the largest bond funds.
The funds with the greatest sensitivity to changes in interest rates lost ground as bond prices fell in response to expectations that the Fed would hold rates higher for longer. However, funds that emphasized corporate bonds and other corners of the credit markets benefitted from the economy’s continued strength.
For investors in the most widely held funds, returns were often subpar. Among the 10 largest index strategies, only Vanguard Short-Term Inflation-Protected Securities ETF VTIP ranked in the top half of its category, and three landed in the bottom 25% of their categories. Among the 10 largest active funds, four landed in the top half of performance. However, only JP Morgan Core Bond JCBUX posted strong enough returns to rank in the top 20% of its category.
For this article, performance data is based on the lowest-cost share class for each fund. Some funds may be listed with share classes not accessible to individual investors outside retirement plans. The individual investor versions of those funds may carry higher fees, reducing shareholder returns.
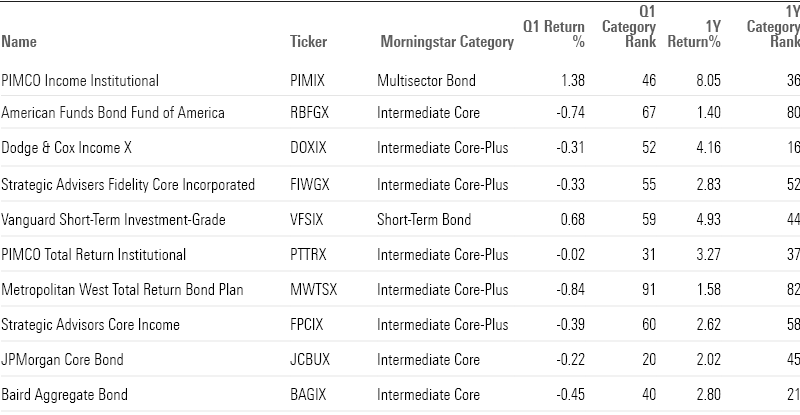
Largest Active Bond Funds Q1 Performance
Of the 10 largest actively managed bond funds, Pimco Income PIMIX posted the first quarter’s largest overall return at 1.38%. But that barely lifted the fund into the top half of the multisector bond category. Still, Pimco Total Return made the top third of the intermediate core-plus category.
At the other end of the spectrum, Metropolitan West Total Return Bond MWTSX finished in the bottom 10% of the intermediate core-plus category with a 0.84% loss. Morningstar associate director Brian Moriarty says the fund has been hurt by its emphasis on long-duration bonds, meaning it owns bonds that are more sensitive to swings in interest rates. He explains: “It also owns a lot of agency mortgage-backed securities, which have generally lagged other bond markets,” which are similarly sensitive to rate moves.
Largest Active Bond Funds Q1 Performance
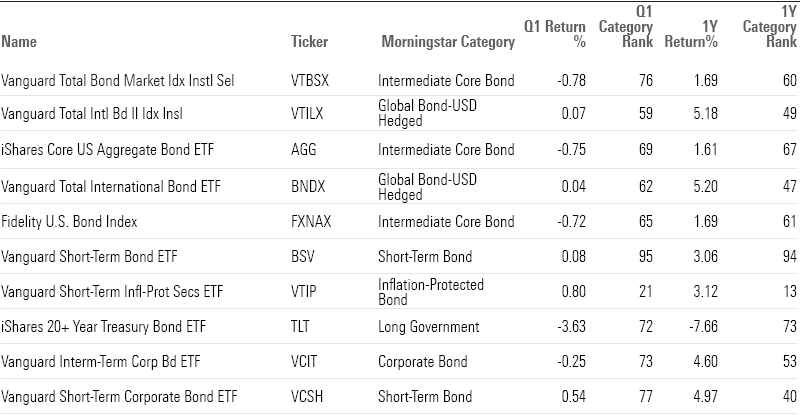
Largest Passive Bond Funds Q1 Performance
It was a challenging quarter for the 10 most widely owned index-tracking bond funds. Not only did half the group lose money, but nine ranked in the bottom half of their categories.
The exception was Vanguard Short-Term Inflation-Protected Securities, whose 0.8% gain during the quarter was enough to land it in the top quintile of the inflation-protected bond fund category. With its short-term bond focus and its bond yields rising, the strategy outperformed other funds in the category, which tend to have longer durations.
Largest Passive Bond Funds Q1 Performance
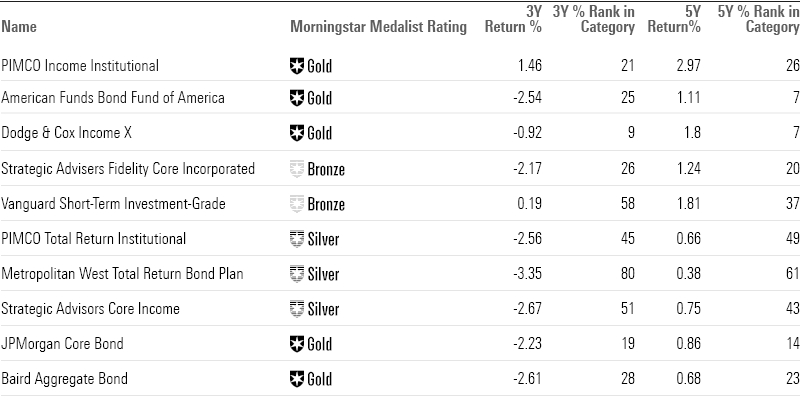
Long-Term Performance for the Largest Active Funds
Over multiple periods, the largest actively managed fund, Pimco Income, topped the lists with returns of 7.48% over the last year and 1.46% per year over the last three years. During this three-year period (which includes the brutal 2022 bear market for bonds) Pimco Income and Vanguard Short-Term Investment-Grade VFSIX, were the only actively managed bond funds to show positive returns.
Over the past five years, Dodge & Cox Income DOXIX returned 1.89% and Vanguard Short-Term Investment-Grade returned 1.81%, some of the highest results. But Pimco Income beat out both funds in this period, posting returns of 2.97%.
Largest Active Bond Funds Long-Term Performance
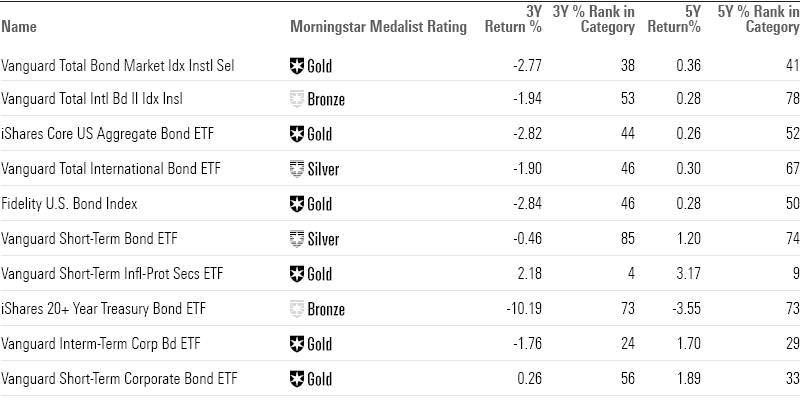
Long-Term Performance for the Largest Passive Funds
Vanguard Short-Term Inflation-Protected Securities posted the best returns over the last three (2.18% average annual return) and five (3.17%) years. On the list of the largest index bond funds, Vanguard Short-Term Inflation-Protected Securities and Vanguard Short-Term Corporate Bond ETF VCSH were the only funds to post positive returns for a three-year period. Vanguard Short-Term Inflation-Protected Securities also consistently appeared in the top third of its category during these three periods.
Largest Passive Bond Funds Long-Term Performance
Here’s what our analysts say about the largest US bond funds.
Analyst Insights: Largest Active Bond Funds
Pimco Income
“Like all Pimco strategies, this one relies on a combination of top-down and bottom-up calls. Thanks to its income focus, the portfolio has weightings in higher-income sectors, such as high-yield corporates and non-U.S. bonds, and it has for years had a strong appetite for nonagency mortgages relative to peers with similar flexibility to invest across sectors.”
—Eric Jacobson, director
American Funds Bond Fund of America
“The strategy in recent years has struck the right balance between incentivizing its four named managers to pursue a core mandate while granting them the flexibility to draw on their respective areas of expertise and broader firm resources. With each manager running a separate sleeve of the overall portfolio, they can overweight sectors within the Bloomberg U.S. Aggregate Bond Index or pursue attractive out-of-benchmark opportunities.
“Results thus far in 2023 have been subpar. The R6 shares’ bottom-quintile 14-basis-point gain through mid-November lagged the index by 26 basis points. Most of that underperformance came in the second quarter due to a combination of the portfolio’s greater sensitivity to rising interest rates and yield-curve positioning.”
—Alec Lucas, director
Strategic Advisers Fidelity Core Incorporated
“The investment seeks a high level of current income. Normally the fund invests primarily in investment-grade debt securities (those of medium and high quality) of all types and repurchase agreements for those securities. It invests up to 30% of assets in high-yield debt securities (also referred to as junk bonds) and emerging market debt securities.
“Over the past three-year period, it beat the category index, the Bloomberg Barclays U.S. Universal Bond Index, by an annualized 45 basis points, and outperformed its average peer by 39 basis points. And more importantly, when extended to a longer time frame, the strategy surpassed the index. On a five-year basis, it outperformed the index by an annualized 71 basis points.”
—Morningstar Manager Research
Vanguard Short-Term Investment Grade
“This strategy often targets larger allocations to corporate bonds (50%-70% of assets) than its typical short-term bond Morningstar Category peer, but it generally eschews high-yield debt in favor of bonds rated BBB- and above while incorporating securitized fare (historically 15%-25%) and U.S. Treasuries generally (5%-10%). This added credit risk, along with its generally longer duration posture than peers, has led to mixed results during the previous decade’s interest-rate and credit selloffs.
“All considered, the strategy has a strong long-term record: Its Admiral share class’ 10-year trailing annualized return of 1.5% through February 2023 has beat two-thirds of distinct category peers, while its volatility(measured by standard deviation) is slightly above the typical showing in the category. The strategy’s persistent overweighting in corporate credit and, more recently, its longer duration relative to peers have helped it perform well in markets favoring credit and interest-rate risk.”
—Brian Moriarty, associate director
Pimco Total Return Institutional
“New lead manager Mohit Mittal is hoping to get things back on track, and Pimco has a track record of making process enhancements that pay off well over time. Results have been muted since he took the reins in late 2022, but his tenure is still in its early days. The strategy’s 6.3% return for 2023 lagged that of its typical peer by 10 basis points, mainly because of its relatively light allocation to high-yield credit. Its non-U.S.-dollar currency sleeve was also a detractor, as it has been in four of the past five calendar years.”
—Mike Mulach, senior analyst
Metropolitan West Total Return Bond Plan
“As of September 2023, the fund’s largest allocations were to agency mortgage-backed securities (38% of net assets) and Treasury securities (28%). The attractiveness of agency mortgages relative to investment-grade corporate bonds has been among the best in market history, and this is the portfolio’s second-highest agency MBS allocation in more than 10 years. Conversely, investment-grade corporate exposure was just under 27%, down roughly 7 percentage points from one year ago.
“It outperformed more than 80% of peers in each of the past four credit-driven downturns: the last four months of 2014, June 2015 to February 2016, the fourth quarter of 2018, and the coronavirus crisis in 2020 from Feb. 20 to March 23. Such wherewithal has allowed the managers to take advantage of buying opportunities before returning to a more defensive posture as recoveries age. Despite the recent pain, those qualities remain intact.”
—Brian Moriarty
Strategic Advisers Core Income
“Compared with other funds in the Intermediate Core-Plus Bond Morningstar Category, this fund, historically, hews closely to peers’ credit and interest-rate sensitivity over the past few years. Opening the analysis to additional factors, the portfolio has displayed biases over time, whether towards or away from certain fixed-income instruments. Relative to the average strategy in the category, the managers have been underweight in A-rated bonds in recent years. In the latest month, the strategy has also relatively underweighted A-rated bonds compared with Morningstar Category peers. Additionally, there’s been an overallocation to debt with 15- to 20-year maturities over the past few years.
“Over a 10-year period, this share class outperformed the category’s average return by 20 basis points annualized. And it mirrored the performance of the category index, the Bloomberg Barclays U.S. Universal Bond Index, over the same period.”
—Morningstar Manager Research
JPMorgan Core Bond
“The fund has a high-quality bias. Bonds must be investment-grade at the time of purchase and therefore the team avoids taking on significant credit risk. The portfolio has historically featured 30% to 60% of assets in securitized debt, 20% to 35% in investment-grade corporates, and 15% to 35% in Treasuries.
“Consistent performance is a hallmark for the fund. Over Figuly’s tenure since October 2015 (his first full month), the R6 shares’ 1.5% annualized return through February 2024 beat the Bloomberg U.S. Aggregate Index’s 1.1% and its unique intermediate core bond Morningstar Category median peer’s 1.2% gain. The fund has typically held up better than most peers in stress periods and consistently delivered strong results over three-year rolling periods.”
—Paul Olmsted, senior analyst
Baird Aggregate Bond Institutional
“The approach is simple but effective. Sticking to U.S.-dollar-denominated bonds without the complications of derivatives or leverage, it begins with matching the Bloomberg US Aggregate Bond Index’s overall interest-rate sensitivity, or duration. In line with the fund’s intermediate core bond Morningstar Category, the team takes most of its credit risk in the investment-grade space. While it can hold on to bonds that have lost their investment-grade rating, it does not buy them. The portfolio’s junk bond allocation has been 1% or less since 2015, and at year-end 2023 its 0.1% stake in debt rated below BBB ranked in the peer group’s bottom half.
“Recent performance has been strong. Moves within industrials were an area of strength for the portfolio in 2023. Over the calendar year, the institutional shares’ 6.43% gain beat the index by 90 basis points and placed in the top quintile of distinct peers. This fund remains a very reliable option.”
—Alec Lucas, director
Dodge & Cox Income
“This strategy’s success owes to its relatively patient and at times contrarian approach to investing. The eight managers, who average more than two decades of experience, start with an investment horizon of three to five years. They tend to favor corporates, noting that the yield advantage these securities offer is an important contributor to total returns over time, and they run a compact, mostly cash-bond portfolio.”
—Sam Kulahan, senior analyst
Analyst Insights: Largest Passive Bond Funds
US Aggregate Float Adjusted Index Funds
Vanguard Total Bond Market VTBSX
“The fund tracks the Bloomberg US Aggregate Float Adjusted Index, which captures investment-grade, fixed-rate, taxable bonds denominated in U.S. dollars. The index applies a minimum size requirement for each type of bond, which helps the index remain investable given the large asset base following it.”
—Lan Anh Tran, analyst
Vanguard Total Bond Market II VTBNX
“The fund tracks the Bloomberg US Aggregate Float Adjusted Index, which captures investment-grade, fixed-rate, taxable U.S. bonds. Eligible issues must have at least one year remaining to maturity and pass the minimum size thresholds. Excluding illiquid securities can limit transaction costs, but it also reduces the opportunity set.
“The fund’s composition reflects issuance activities, which have tilted toward the longer end of the curve because of recent low interest rates. Its average duration has steadily gone up and stood at around 6.5 years as of May 2023. This is slightly higher than the category average, but not significantly.”
—Lan Anh Tran
Other Indexes
Vanguard Short-Term Corporate Bond ETF
“Vanguard Short-Term Corporate Bond Fund offers a well-constructed portfolio of short-term corporate bonds at a razor-thin expense ratio. Focusing strictly on corporate bonds should position this fund to capture market rallies better than most of its Morningstar Category peers without pushing it too far into risky territory.
“The fund tracks the Bloomberg U.S. 1-5 Year Corporate Bond Index, which provides a market-value-weighted portfolio of investment-grade corporate bonds with one to five years remaining to maturity. Eligible bonds must be denominated in U.S. dollars and have at least $300 million in outstanding face value.”
—Lan Anh Tran
Vanguard Total Intl Bd II Index Institutional
“Market-cap weighting tilts the portfolio toward the largest and most liquid issuers, which are large foreign governments. This alleviates transaction costs for the fund and tapers its credit risk exposure. The fund tends to park between 70% and 80% of its assets in government debt. The second-largest sector is corporate bonds, accounting for around 12%-15% of the portfolio. By contrast, the average category peer tends to keep government exposure closer to 60% of the portfolio while loading up more on corporate debt.”
—Lan Anh Tran and Morningstar Manager Research
iShares Core US Aggregate Bond ETF
“The fund tracks the Bloomberg U.S. Aggregate Bond Index, which includes taxable, investment-grade U.S. bonds with at least one year until maturity. Issuing activity in that market, which is dominated by U.S. Treasuries, will dictate the portfolio’s composition. Market-value-weighting emphasizes the most liquid issues by harnessing the market’s collective wisdom on the relative value of each bond.”
—Zachary Evens, analyst
Vanguard Total International Bond ETF
“The fund tracks the Bloomberg Global Aggregate ex-USD Float-Adjusted RIC Capped Index, which captures investment-grade bonds not denominated in U.S. dollars. Eligible bonds must have at least one year remaining to maturity and satisfy size requirements based on their respective local currencies. It weights selected bonds by their market value, capping positions to prevent issuer concentration according to the Regulated Investment Company requirements. The index excludes holdings of central governments from its weighting calculation to reflect the amount of a bond’s value that is publicly available.”
—Lan Anh Tran
Fidelity U.S. Bond Index
“The portfolio’s conservative complexion mimics that of the taxable, U.S. investment-grade bond market. U.S. Treasuries account for almost 43% of the portfolio, with agency mortgage-backed securities, and corporate bonds making up 26% and 24% of the portfolio, respectively. These figures differ from the category average, which places greater emphasis on corporates and other securitized fare, at the expense of Treasuries. The fund also excludes high-yield debt.
“With less credit risk comes less reward, and the fund leaves yield on the table by focusing on U.S. Treasuries and other AAA-rated debt. Its average coupon and 12-month yield consistently trail the category average, with average coupon and 12-month yield falling 33 and 20 basis points short of the category norm, respectively, as of February 2023.
“It has provided mixed returns compared with peers, but similar returns compared with the category benchmark. This share class mirrored the category average’s 1.3% return over the eight-year period and its 1.6% return over a 10-year period. However, it mirrored the return of the category index, the Bloomberg Barclays US Aggregate Bond Index, over the 10-year period.”
—Zachary Evens and Morningstar Manager Research
Vanguard Short-Term Bond ETF
“This fund uses representative sampling to track the Bloomberg Barclays U.S. 1-5 Year Government/Credit Float Adjusted Index, a broad portfolio that sweeps in the non-securitized portions of the short-term taxable U.S.-dollar-denominated investment-grade bond market. Bonds must count at least $300 million in outstanding face value and sport maturities between one and five years to qualify for the index. The float adjustment excludes holdings in the Federal Reserve’s account, which reduces the portfolio’s exposure to U.S. Treasuries. The index weights bonds that make the cut by their market value and rebalances monthly.”
—Ryan Jackson, analyst
Vanguard Short-Term Inflation-Protected Securities ETF
“Vanguard Short-Term Inflation-Protected Securities ETF VTIP sensibly constructs its portfolio of short-term U.S. Treasury Inflation-Protected Securities and pairs it with a low fee.
“The fund tracks the Bloomberg US Treasury Inflation-Protected Securities 0-5 Year Index, which includes TIPS with less than five years until maturity. The index weights qualifying bonds by their market value, which promotes low turnover and mitigates transaction costs. This is a sound approach because the TIPS market is liquid and does a good job pricing these bonds.
“The fund held up better than its average category peer by 6.67 percentage points in 2022. Similarly, the fund outperformed its average peer by 1.61 percentage points in 2023 through September as interest rates continued to rise. But the fund’s defensive stance on interest-rate risk isn’t always rewarded. The fund lags its peers when the Fed cuts rates and duration pays off. For example, the fund underperformed its average peer by 4.94 percentage points in 2020 when rates dropped. Still, the fund’s short-term focus tamps down on risk, and the inflation-protection component of the bonds it holds will have a more meaningful impact on fund performance than it would for funds with higher duration.”
—Mo’ath Almahasneh, associate analyst
iShares 20+ Year Treasury Bond ETF
“The investment seeks to track the investment results of the ICE® U.S. Treasury 20+ Year Bond Index (the “underlying index”). The fund will invest at least 80% of its assets in the component securities of the underlying index and it will invest at least 90% of its assets in U.S. Treasury securities that the advisor believes will help the fund track the underlying index. The underlying index measures the performance of public obligations of the U.S. Treasury that have a remaining maturity greater than or equal to 20 years.
“It has provided varied returns compared with peers, but poor returns compared with the category benchmark. This share class mirrored the category average’s-1.0% return over the eight-year period and its 1.3% return over a 10-year period. However, it was more difficult to outpace the category index, Bloomberg Barclays U.S. Government Long-Term Bond Index, where it lagged by an annualized 20 basis points over the same 10-year period.”
—Morningstar Manager Research
Vanguard Interim-Term Corp Bond ETF
“The fund tracks the Bloomberg U.S. 5-10 Year Corporate Bond Index, which holds investment-grade corporate bonds with between five and 10 years remaining until maturity. Eligible bonds must have fixed coupon rate and at least $300 million in outstanding face value. It excludes certain types of bonds such as euro bonds, contingent capital securities, and bonds with equity features. The index weights selected bonds by their market value. The market does a decent job pricing these bonds in the vast and liquid investment-grade corporate bond market, so this is an efficient approach.
“As of May 2023, the fund parked over 43% of its assets in bonds rated A while the average category peer had around 30%. Instead, actively managed funds tend to hold around 5%-7% of their portfolios in junk debt, which the fund excludes by definition. The fund’s more conservative credit risk profile will likely provide some cushion during credit shocks better than actively managed funds that delve into riskier corners of the market.”
—Lan Anh Tran
Correction: A previous version of this article stated that Pimco Total Return was the only actively managed fund to rank in the top 20% of its category, rather than JP Morgan Core Bond.
The author or authors do not own shares in any securities mentioned in this article. Find out about Morningstar’s editorial policies.
/cloudfront-us-east-1.images.arcpublishing.com/morningstar/FGC25JIKZ5EATCXF265D56SZTE.jpg)
/d10o6nnig0wrdw.cloudfront.net/04-25-2024/t_d30270f760794625a1e74b94c0d352af_name_file_960x540_1600_v4_.jpg)
/cloudfront-us-east-1.images.arcpublishing.com/morningstar/DOXM5RLEKJHX5B6OIEWSUMX6X4.png)