
8 Charts That Matter to Investors Right Now
Conversation starters for advisors and clients about the markets, inflation, and diversification.


Dump trucks of ink have been spilled lamenting the benefits of diversification.
Why? Because it’s a practical investment concept, and its merits are applicable to more than 90%—at least!—of investors.
But one item that gets less attention: If you preach diversification, you often spend a lot of time apologizing.
The reason? Owning a collection of assets means there’s always going to be a few that aren’t moving in the right direction.
There’s a famous story about Boston Celtics legend Larry Bird walking into the locker room before a three-point contest and sarcastically asking his competitors, “Who’s coming in second?”
Bird went on to win his third-consecutive three-point contest a couple of hours later.
The analogy to equity markets: U.S. large-cap stocks have been carrying themselves like Larry Bird.
Everyone else has been playing for second.
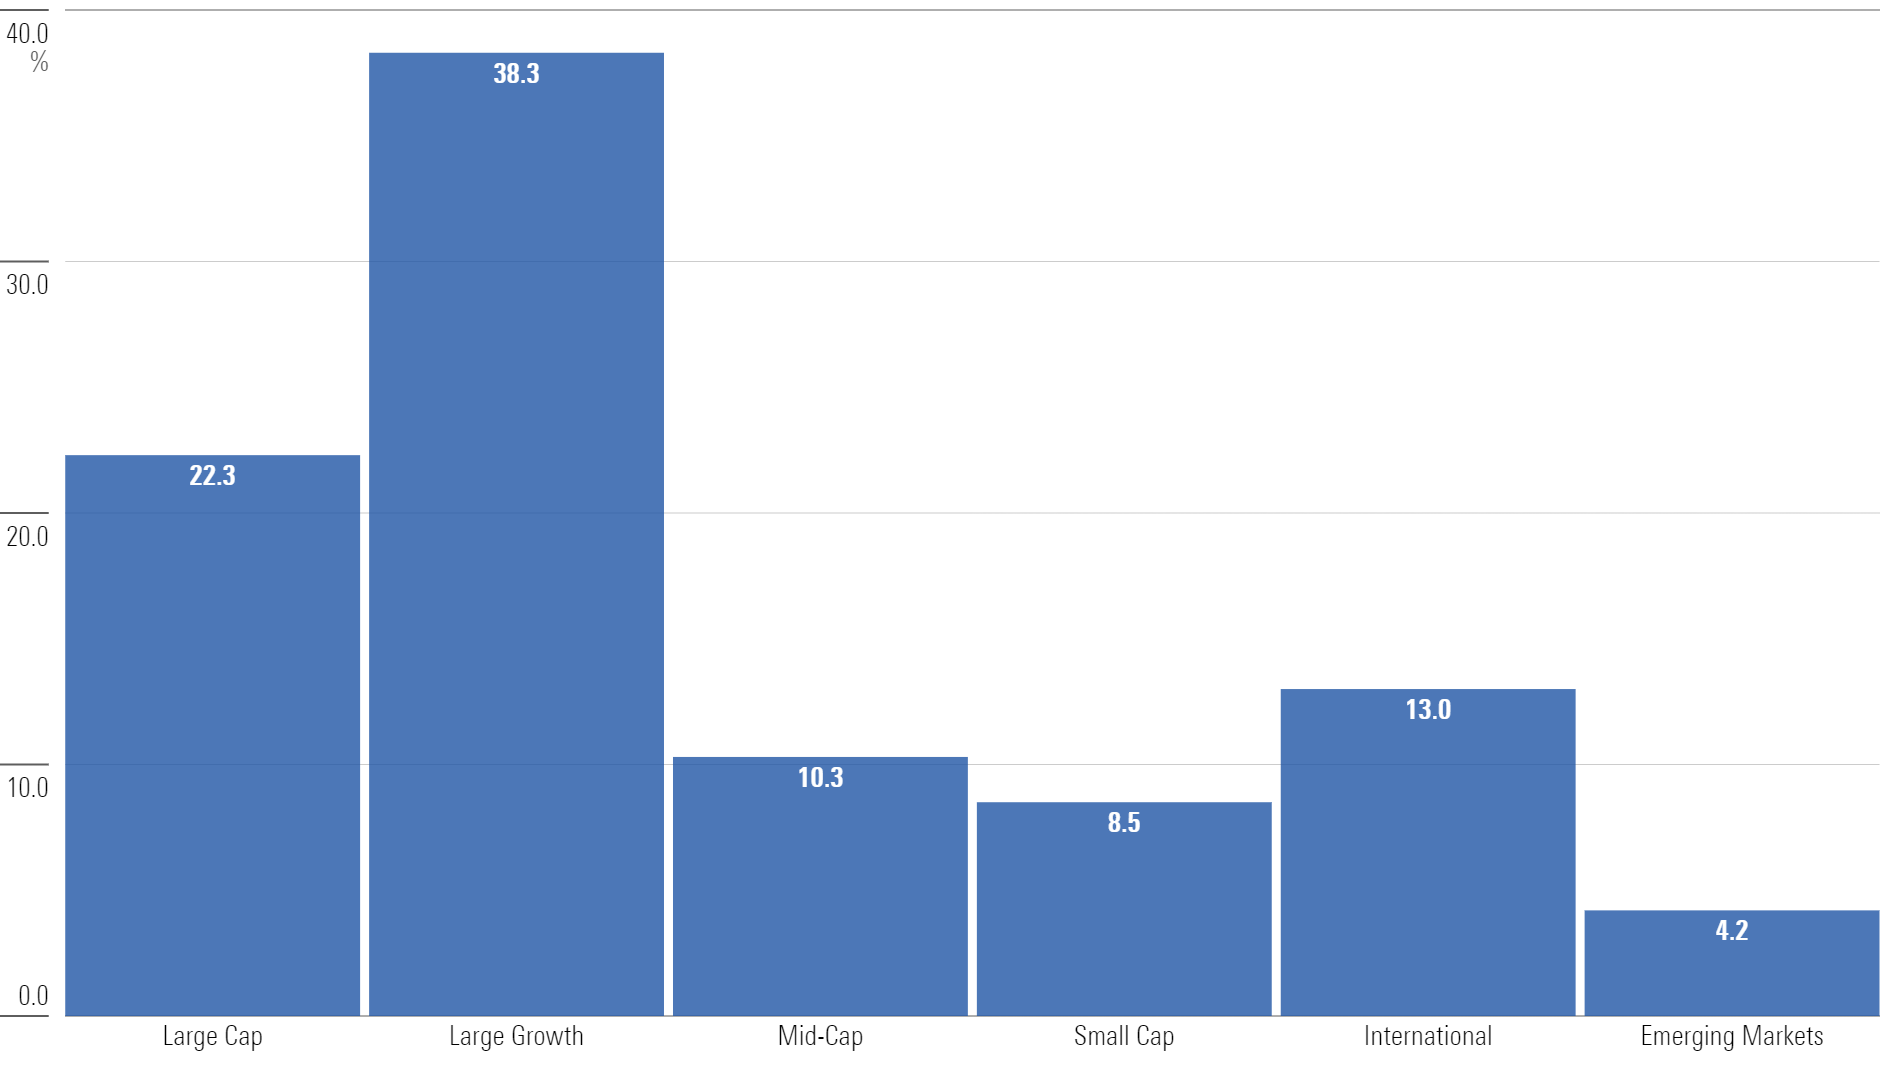
Through November, U.S. large-cap stocks are up more than 20% for the year. If you isolate large-cap growth stocks, the number is even more pronounced, up nearly 36%. Meanwhile, no other major equity asset class is even close.
Asset Class Returns (Year to Date)
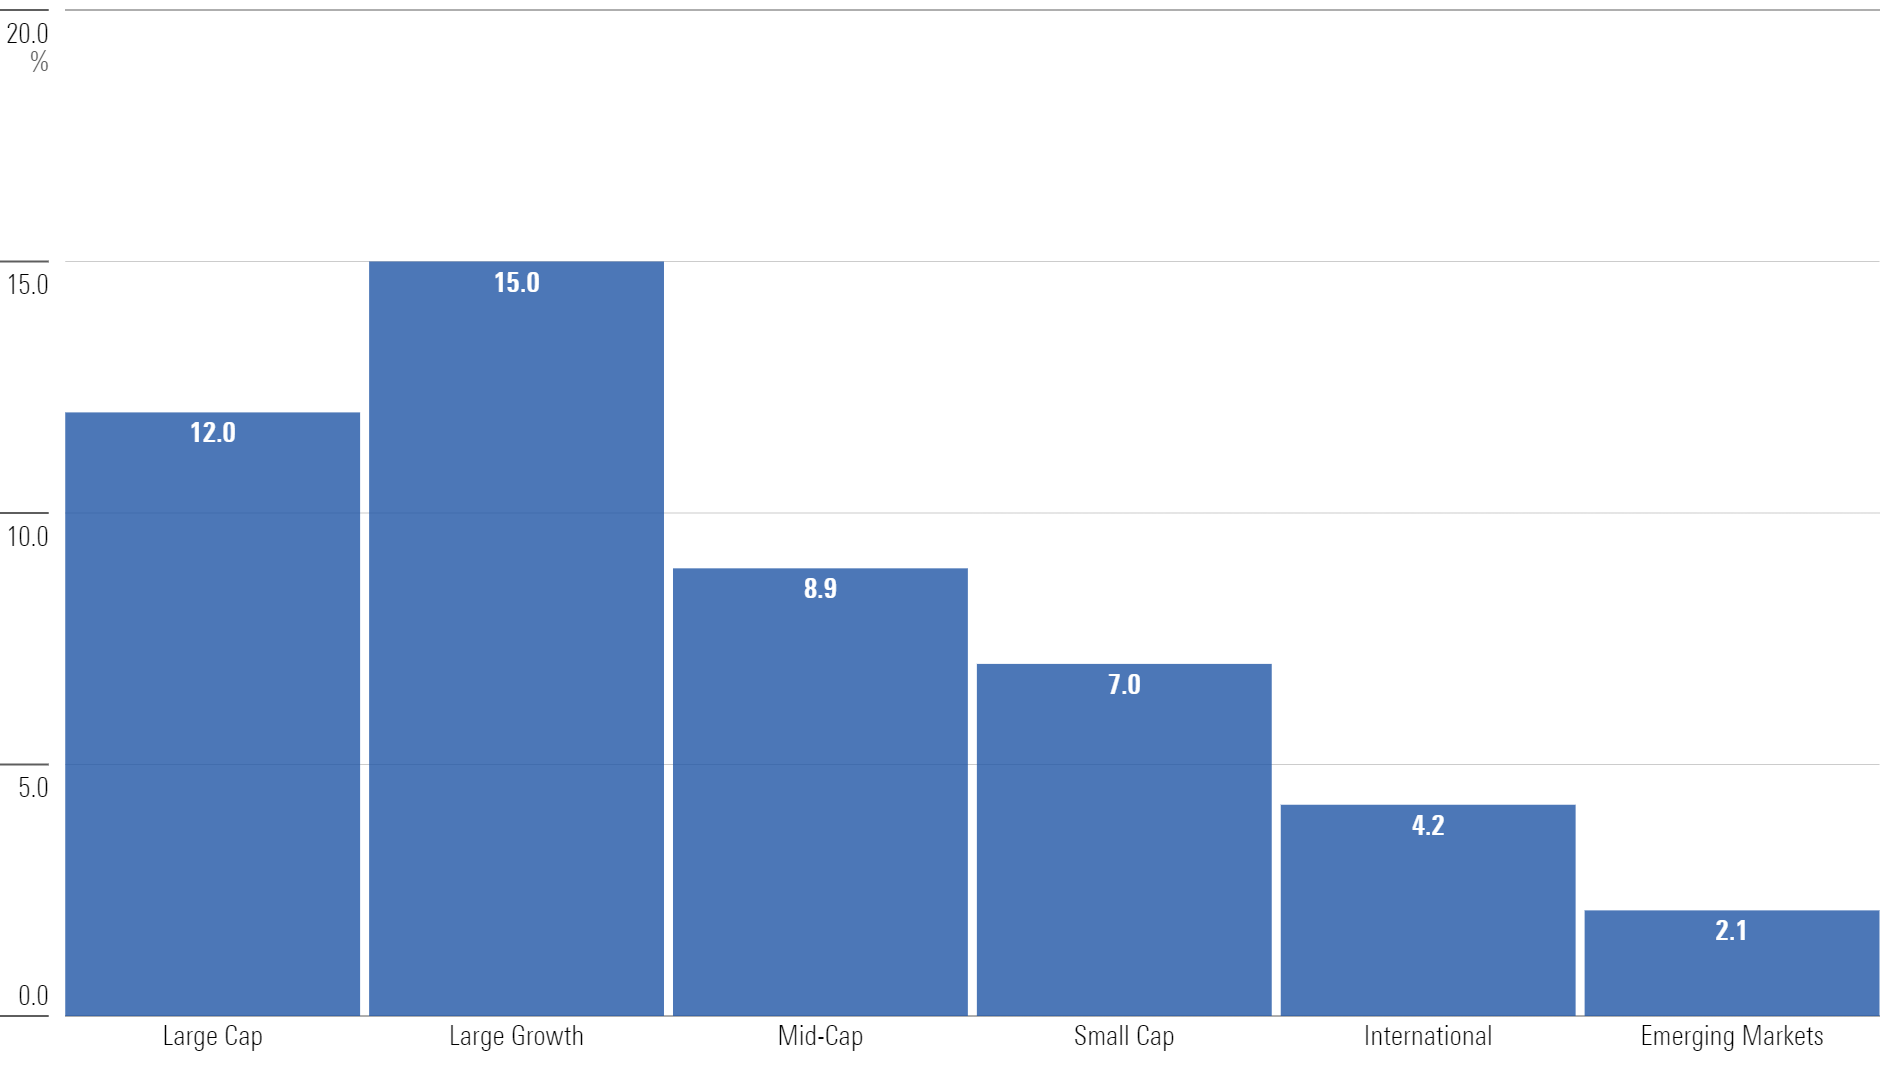
This has been true for much longer than just 2023. The 10-year results paint the same picture.
Asset Class Returns (10-Year Annualized)
When you see these numbers, doubt creeps in. What’s the point of owning anything other than large caps?
The best thing that can be said: When in doubt, zoom out.
Sometimes we treat markets like our favorite football team’s quarterback—seeking to reach a consensus in only a few years. The proverbial, “If it’s not working, get rid of it!”
But markets don’t work like that—an evaluation period of a few years is generally shortsighted. Markets have been operating for a lot longer than 10 years.
Simply expanding the evaluation period to 20 years paints a much different picture.
Annualized Returns by Asset Class (Since 2001)
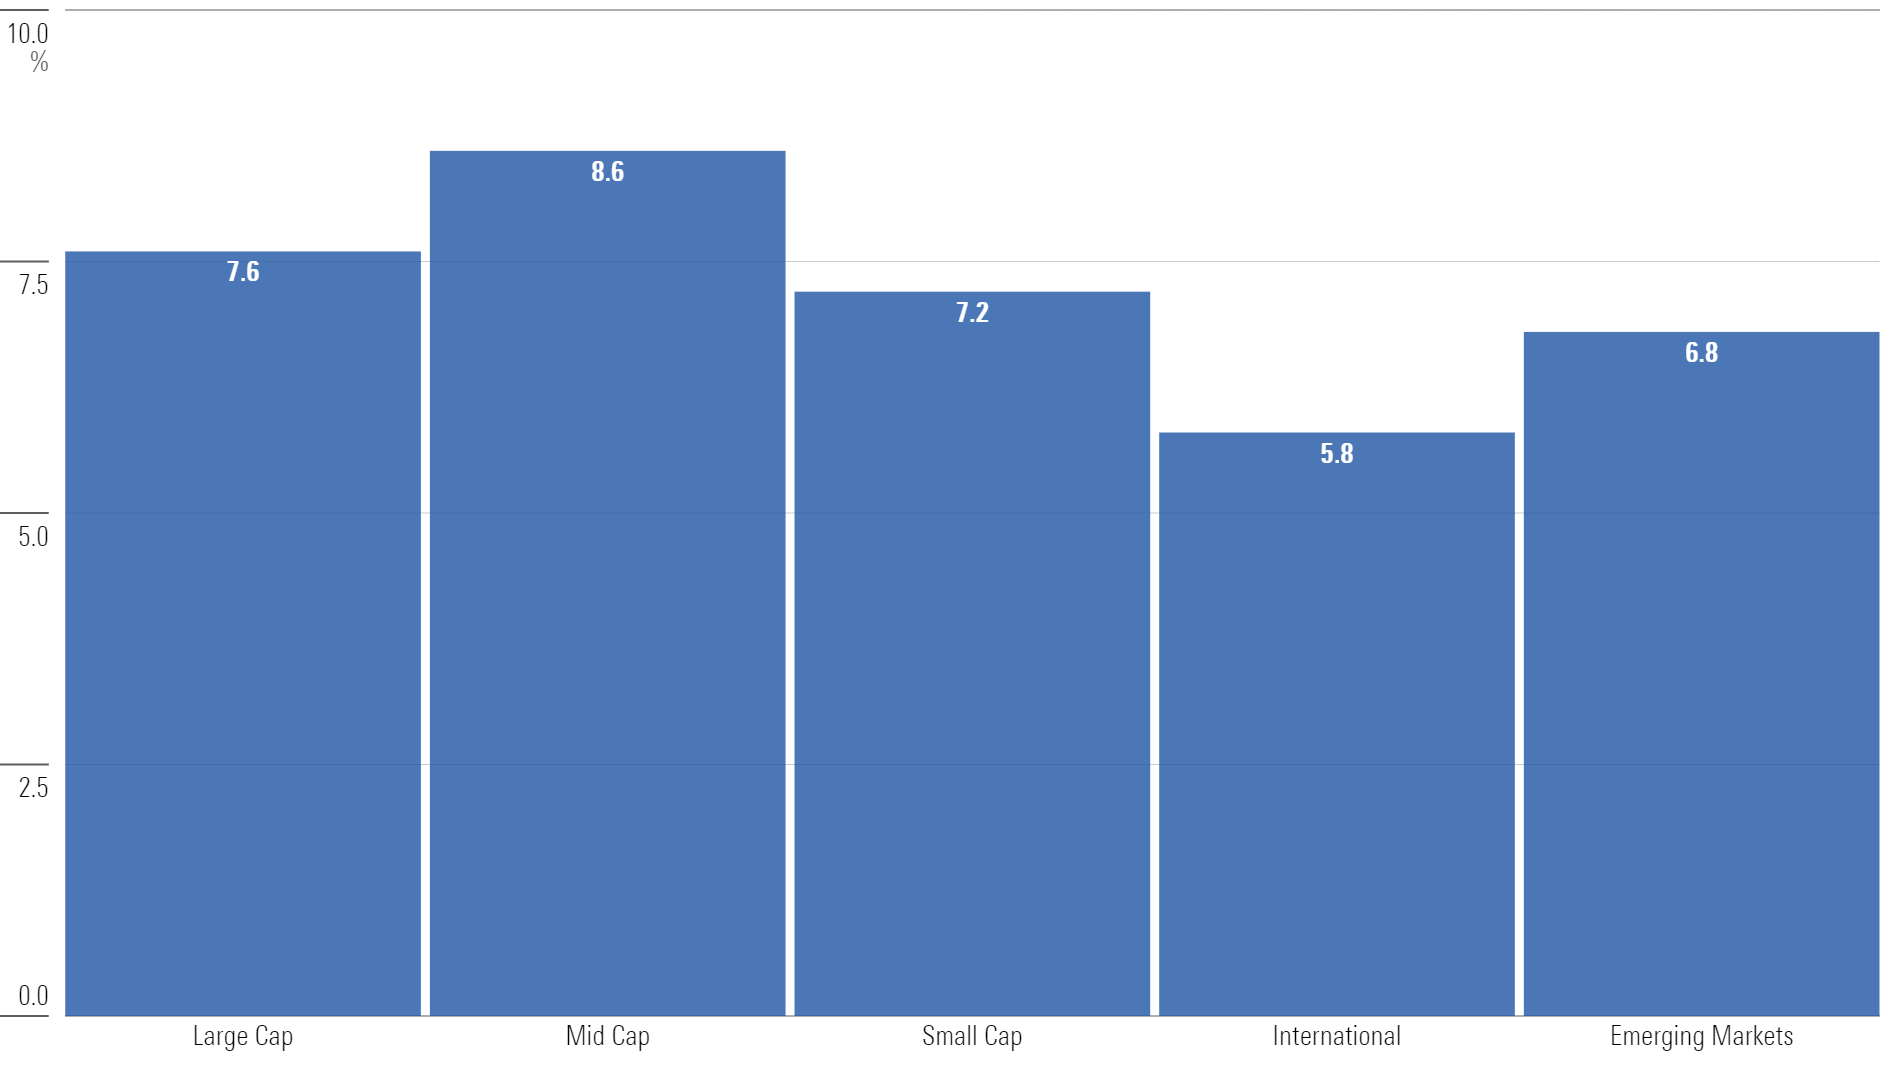
The returns between asset classes are much more competitive over that time.
And if you dig deeper into the above data, you will find there are many periods where these asset classes are not only competitive but also assume market leadership positions at different points.
There will always be quarters, years, and even cycles where diversification doesn’t feel good, but over long periods of time, it’s relentless.
This is a feature, not a bug.
Surveying the market, there are many areas worth diversifying into, but one that is worth highlighting: small caps.
Small Caps
When thinking about what drives stock prices, there’s an old saying, “Randomness dominates the short-term, valuation dominates the medium-term, and earnings dominate the long-term.”
We can’t control for randomness. We can try to forecast earnings, but it’s not easy. However, the one factor we can be very diligent about is the prices we pay, or valuation.
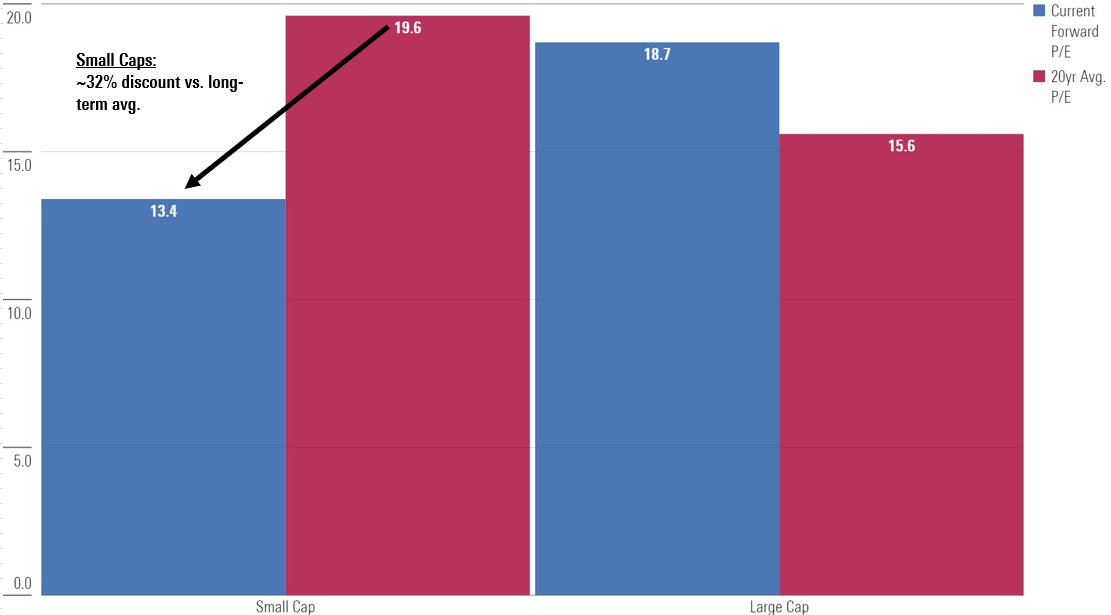
That leads us to small caps: current prices—valuations—could be signaling future success. Prices have hardly been cheaper.
Valuations by Asset Class
It’s not just valuations, either. The dominant run by large companies has led to some extreme disparities.
Apple AAPL and Microsoft MSFT both have market caps larger than the combined market cap of all the stocks in the Russell 2000!
Total Market Value (USD Trillions)
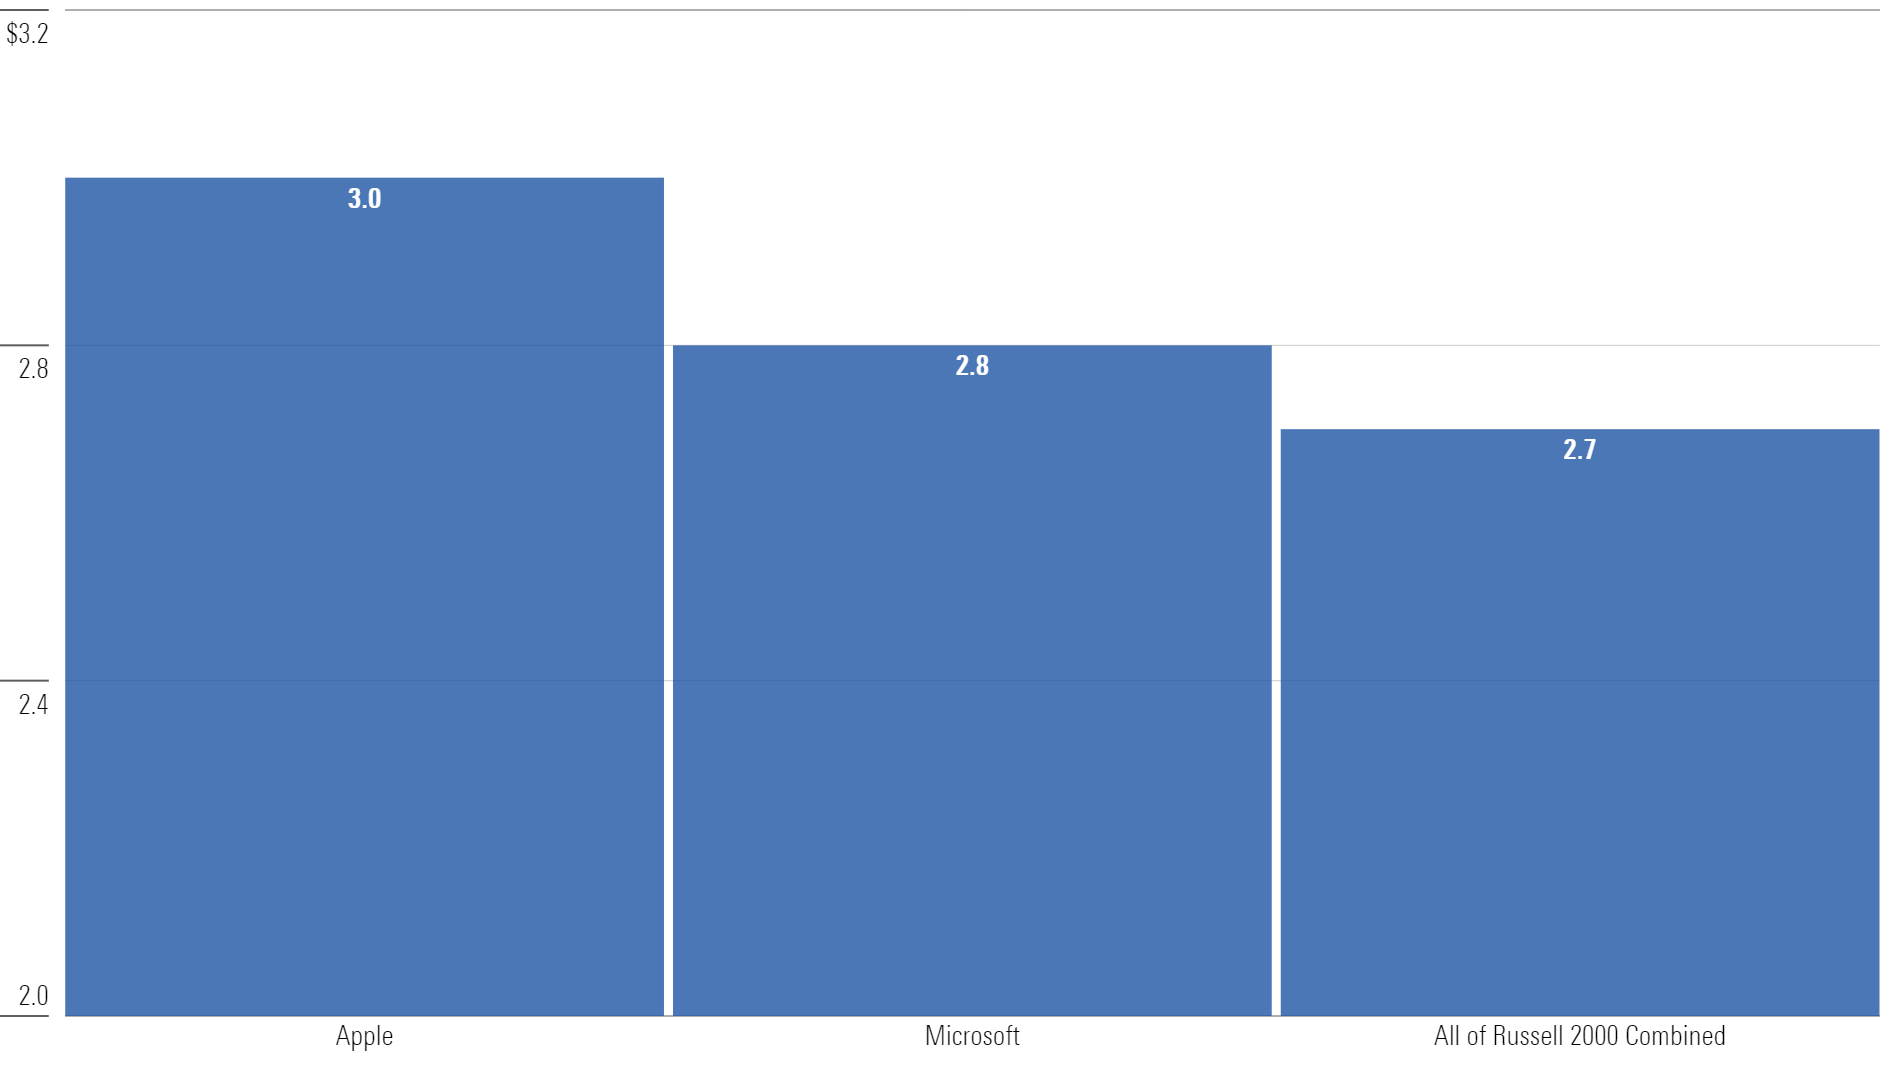
Additionally, small caps as a percentage of the total stock market are at their lowest levels since the 1930s, per data from the University of Chicago.
Now, valuations are never a silver bullet. Certain asset classes become cheap for a reason.
Small caps certainly come with caveats, including:
- more than 40% of small-cap companies are not profitable
- greater sensitivity to the economic cycle
- higher amounts of debt
The last point—small caps have more debt than large caps—is worth highlighting further. This seems to be a significant reason small caps sit at their current valuation levels, given the uptick in interest rates.
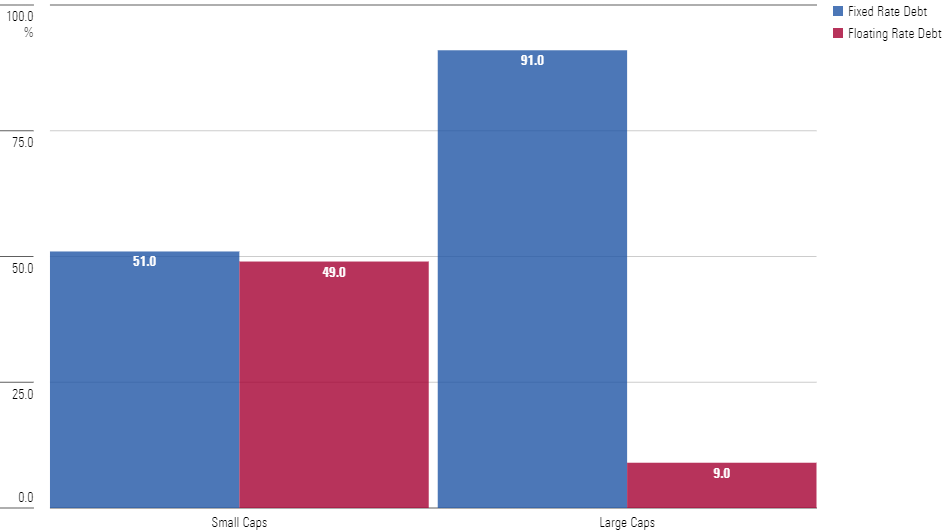
Using data from FactSet, 49% of the total debt held by small caps is floating rate. For large caps, less than 10% of their debt is floating rate.
Small Caps vs. Large Caps: Fixed and Floating-Rate Debt
Why is that important?
Put simply, the interest payments on debt for small caps has been adjusting higher—a competitive disadvantage—while large caps are holding mostly fixed-rate debt, which means their debt payments are not rising.
Are there other reasons investors might be ignoring small caps? Of course, but the unfavorable debt structure—in the face of rising rates—has been a major hindrance.
The good news is this hindrance could soon flip. The market believes the first rate cut could take place in the first half of next year.
Market Expectations for the Fed-Funds Rate
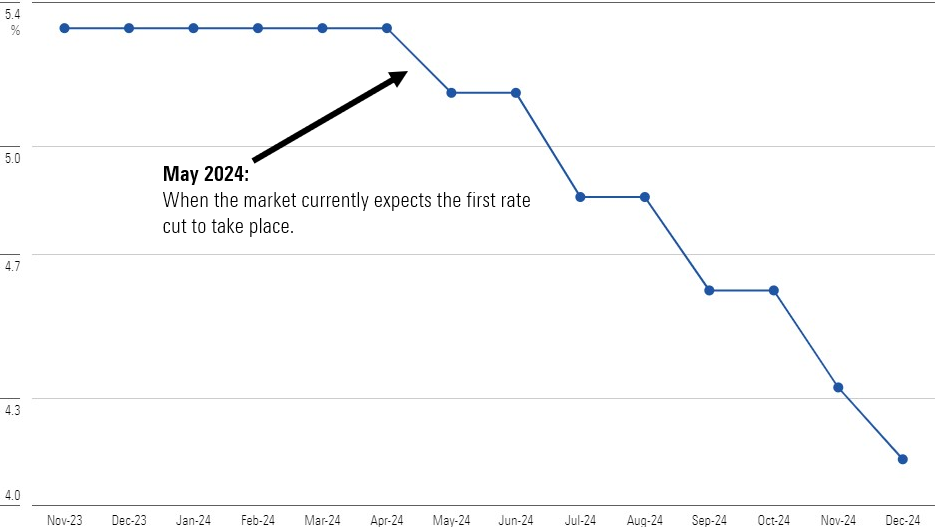
This could be an important driver for small caps and potentially help close some of that valuation gap.
Deflation?
If the word inflation could charge royalties based on usage, the monthly mailbox money would make the cast of Friends jealous.
Inflation’s been a topic the entire globe has been wrestling with and talking about. But the trend in inflation has been slowing for some time. It peaked at around 9% in mid-2022, trended lower since then, and now hovers in the 3% range.
There’s been some interesting comments recently from a few large global retailers and a manufacturer that indicate we might need to learn a new word.
That word? Deflation.
A sample of recent commentary includes:
Wal-Mart WMT: “We may be managing through a period of deflation in the months to come. And while that [may pressure our margins], we welcome it because it’s better for our customers.”
Home Depot HD: “The most important observation we’ve made is that the worst of the inflationary environment is behind us.”
Deere DE: “This was the first quarter in a number of years where we’ve seen production costs actually become deflationary and serve as a tailwind for our business.”
Will falling prices ultimately stick? It’s too early to tell, but consumers are hardly noticing.
The Consumer
The average American consumer is expected to spend more than $1,600 this holiday season, up nearly 14% versus last year, according to a Deloitte survey.
Obviously, a survey is a collection of expectations—it guarantees nothing. However, we already have hard data on consumer spending from Black Friday and Cyber Monday.
The quick summary: Consumers are not feeling bashful. In fact, they’re breaking records.
Data from Adobe Analytics on Cyber Monday paints a clear picture: “The $12.4 billion spent on Cyber Monday topped last year’s $11.3 billion on the same day. The rise was broadly driven by new demand and not simply higher prices, and in fact the number would have been even higher if the figure was adjusted for inflation—making it the biggest online shopping day of all time.”
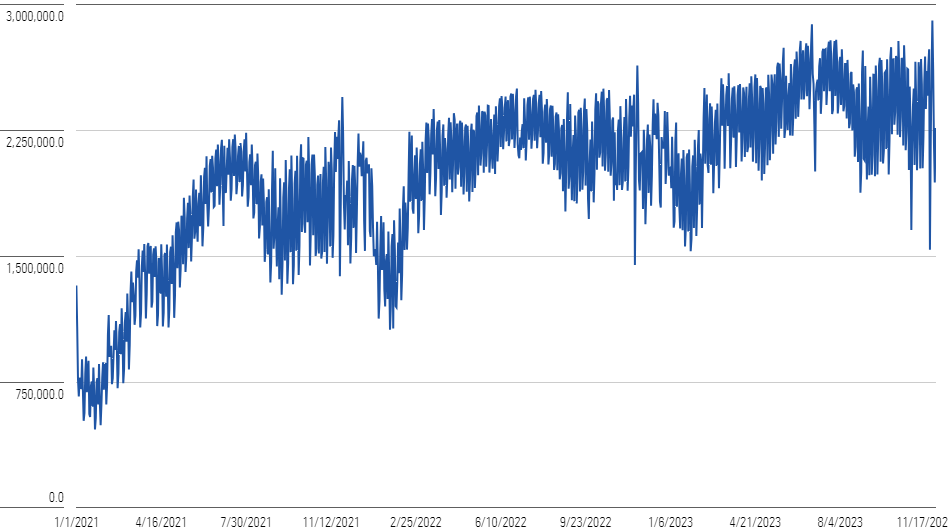
And shopping is not the only area seeing a surge. The Sunday travel day after Thanksgiving was the busiest day ever (again for emphasis: EVER!) at U.S. airports.
According to TSA data, more than 2.9 million people were screened at security checkpoints that day.
Daily Travelers Screened at TSA Checkpoints
A couple of days of strong data is not indicative of where things will be in a few months, but it certainly is a surprise given where we thought things might be headed at the start of the year.
One reason the consumer might be proverbially surprising to the upside? Unlike small caps, almost 90% of all U.S. household debt is locked in at a fixed rate, according to Federal Reserve data.
This data is surprising. There have been plenty of stories written about soaring mortgage rates, auto payments, and credit card debt pinching the consumer.
But broadly speaking, those pockets of pain likely don’t represent the entire story. And many of the figures being reported are consistent with the longer-term trends we’ve been discussing in recent months that detail a resilient economy, strong employment, and a stock market that continues to chug along.
This article is a condensed version of a monthly article from Morningstar Wealth. If interested, a full version of the article can be viewed here.
Morningstar Investment Management LLC is a Registered Investment Advisor and subsidiary of Morningstar, Inc. The Morningstar name and logo are registered marks of Morningstar, Inc. Opinions expressed are as of the date indicated; such opinions are subject to change without notice. Morningstar Investment Management and its affiliates shall not be responsible for any trading decisions, damages, or other losses resulting from, or related to, the information, data, analyses or opinions or their use. This commentary is for informational purposes only. The information data, analyses, and opinions presented herein do not constitute investment advice, are provided solely for informational purposes and therefore are not an offer to buy or sell a security. Before making any investment decision, please consider consulting a financial or tax professional regarding your unique situation.
The author or authors do not own shares in any securities mentioned in this article. Find out about Morningstar’s editorial policies.
/cloudfront-us-east-1.images.arcpublishing.com/morningstar/2TT3THVKOJAKBFGHCCRTVPNEQ4.png)
/cloudfront-us-east-1.images.arcpublishing.com/morningstar/6NPXWNF2RNA7ZGPY5VF7JT4YC4.png)
/cloudfront-us-east-1.images.arcpublishing.com/morningstar/RYIQ2SKRKNCENPDOV5MK5TH5NY.jpg)