
Actively Managed Funds Surprise in Market Rebound
In a rare reversal, the 12 months through June 2023 were some of active managers’ best, the latest Active/Passive Barometer finds.
/s3.amazonaws.com/arc-authors/morningstar/30e2fda6-bf21-4e54-9e50-831a2bcccd80.jpg)

As global stocks and bonds roared back to life in the first half of 2023, so did the fund managers that actively buy and sell them. Over the 12 months through June 2023, 57% of actively managed funds survived and beat their average passive peer, their highest success rate in years. Active strategies normally trail passive index rivals during market rallies, but strong security selection and some wobbly index returns set the stage for an unexpected active-fund renaissance.
We explore the engines that powered active funds’ strong year in the midyear 2023 Active/Passive Barometer, a semiannual report that measures the performance of U.S. active funds against a composite of index peers in their respective Morningstar Categories. The report spans more than 8,200 unique funds that amounted to more than $17 trillion, or 55.9% of the U.S. fund market, halfway through 2023.
The full report can be found here. You can learn more about the background and our approach to study in this article.
Actively Managed Funds Come to Life
The active-fund revival swept across a range of categories: 16 of the 20 Morningstar Categories surveyed either improved or maintained their success rate from one year prior. It’s surprising that a market rally provided the backdrop for improvement. Historically, there is an inverse relationship between the performance of active managers and the performance of their targeted market segment. But active funds fared well even in the hottest corners of the market.
Nearly 57% of active U.S. equity funds survived and beat their average index peer over the 12 months through June 2023. Active U.S. small-cap funds succeeded at a better clip (65%) than large caps (53%), but it was a balanced effort: Eight of the nine U.S. stock categories posted active success rates higher than 50%. After gradually improving their short-term results in recent Active/Passive Barometers, the trailing 12 months marked some of the finest for active U.S. stock funds.
If active U.S. stock strategies took another step forward in early 2023, active foreign-equity funds vaulted from a standstill. Over the 12 months through June 2023, more than 57% of them survived and beat the index average. That’s more than double the success rate from one year earlier. All six foreign-equity categories maintained or improved their active success rate, increasing by 28 percentage points on average.
Year-Over-Year Change in Active Funds’ One-Year Success Rate by Category (%)
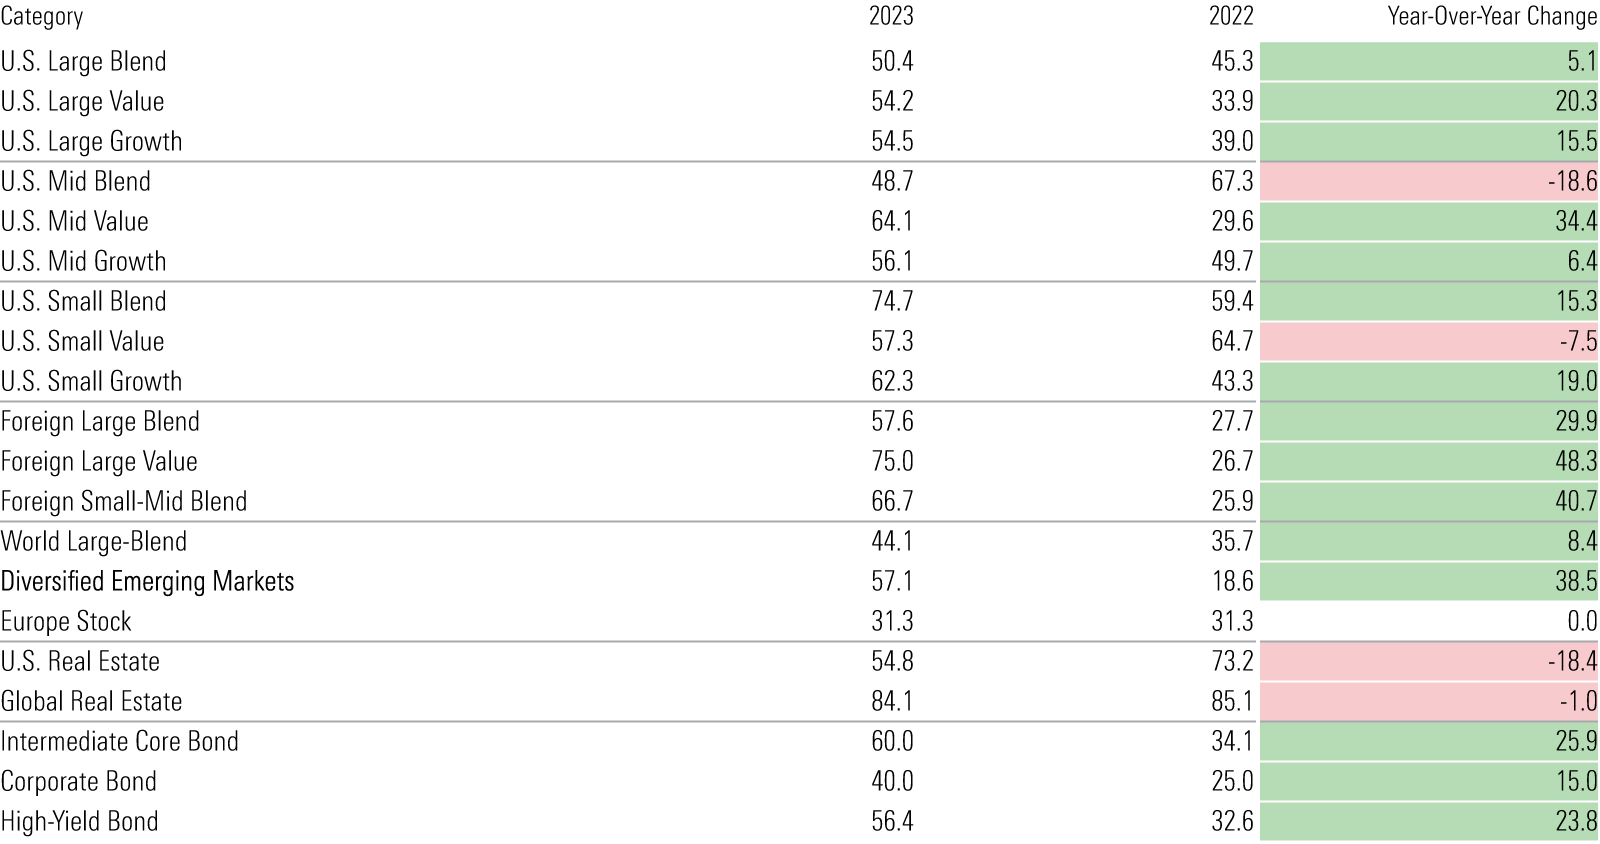
The leap in active funds’ success stemmed from two developments. For one, active managers pushed the right buttons. They picked stocks effectively—an arduous task considering index portfolios often held a greater share of the market’s top performers. In the fixed-income arena, their penchant for credit risk paid off and sparked a 55% success rate among actively managed bond funds.
Weak spots in the index-fund universe also lowered the hurdle for their active foes to clear. Dividend and low-volatility funds took a nosedive in 2023′s first half after excelling the year prior. Many late-to-the-party thematic funds cratered and/or closed. And the momentum factor struggled. These woes washed out solid returns from traditional, market-cap-weighted index funds and helped pave the road to success for actively managed strategies.
The Bigger Picture
One year isn’t a sufficient time horizon from which to draw conclusions. Success rates can fluctuate wildly from year to year, depending on what’s going on in the markets and how that uniquely affects the active and passive funds we compare. For example, active bond strategies were rewarded for shouldering more credit risk over the 12 months through June 2023 but were punished for it in recent periods. Market segments with fewer funds can send especially noisy signals in the short term. For instance, active funds in the global real estate category boosted their trailing 12-month success rate to 84% as of June 2023 from 20% as of December 2022.
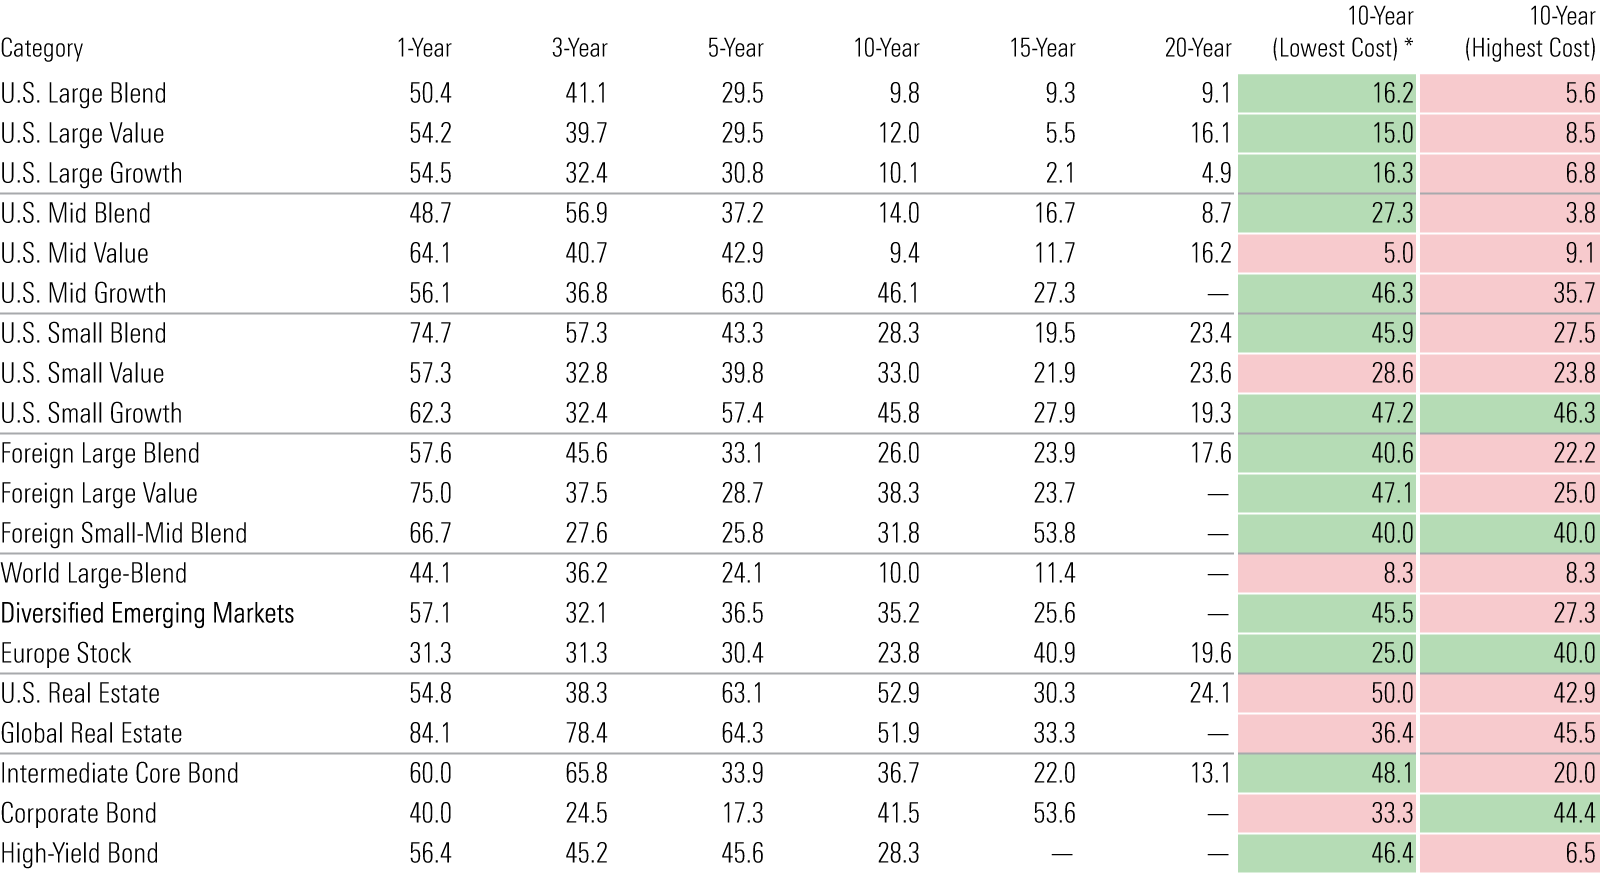
Longer horizons provide stronger signals that investors can incorporate into their selection processes. In general, actively managed funds have failed to survive and beat their benchmarks, especially over longer time horizons. Just one out of every four active funds topped the average of passive rivals over the 10-year period ended June 2023.
But success rates vary across categories. Long-term success rates were generally higher among bond, real estate, and foreign-stock funds, where active management may hold the upper hand. Investors can use this data to identify areas of the market where they have better odds of picking winning active funds.
Active Funds' Success Rate by Category (%)
Margin of Victory Matters
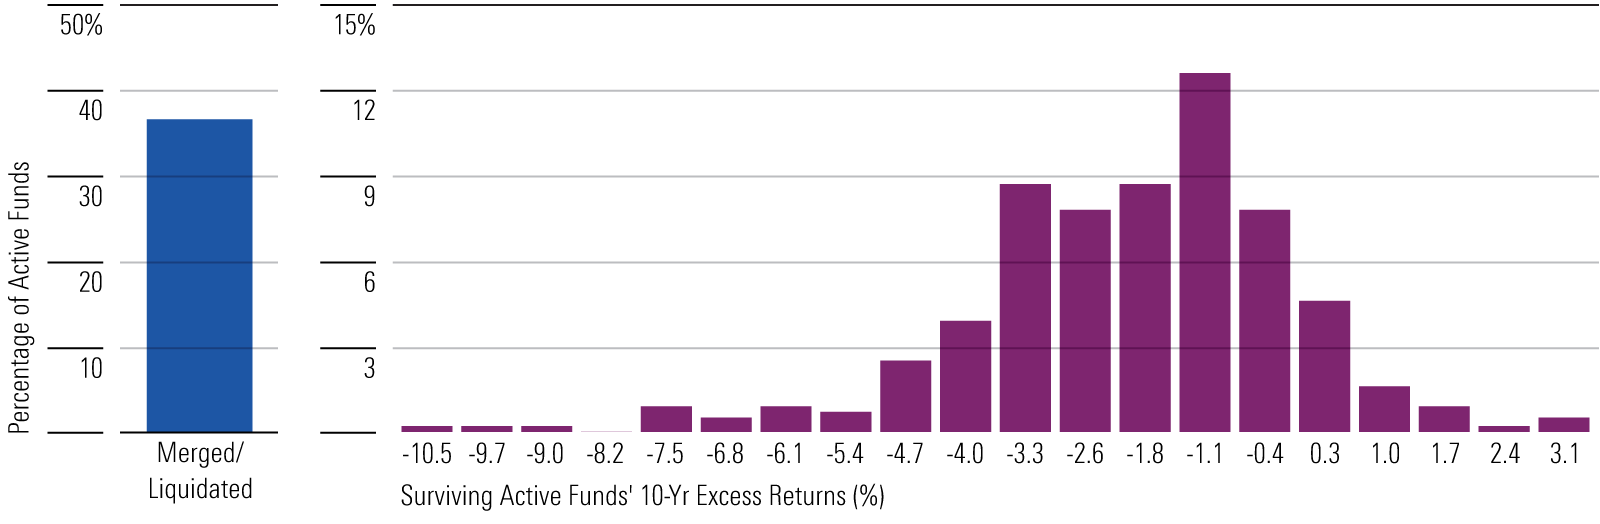
What percentage of funds survive and beat the average index fund is only half the story. The payoff for choosing a winning fund and the penalty for picking a loser is just as important. The Active/Passive Barometer provides this information by plotting the distribution of 10-year excess returns for surviving active funds versus the average of their passive peers.
Much like success rates, these distributions vary widely across categories. In the case of U.S. large-cap funds, the distributions skew negative. This paints a bleak picture for active funds in these categories. They have low long-term success rates, while penalties are high for picking a loser (per the negatively skewed distribution).
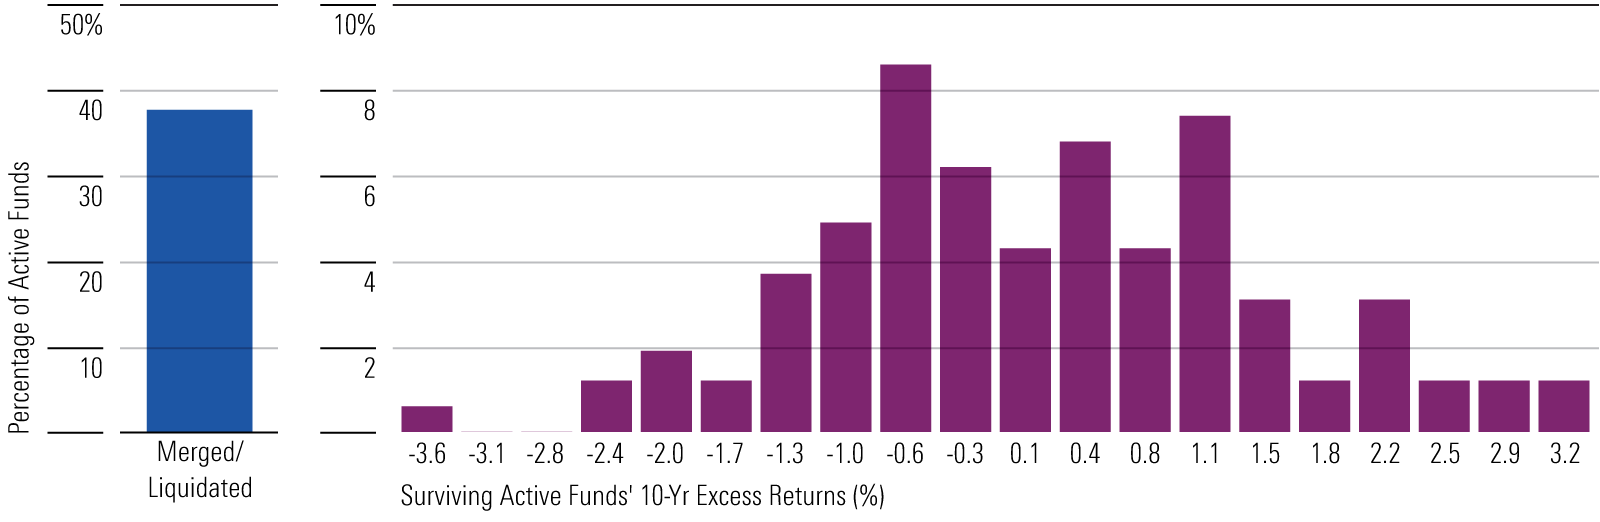
The opposite tends to be true of fixed-income and certain foreign-stock categories. Excess returns among surviving active managers have skewed positive in the past decade, and success rates have generally been higher. The next two exhibits show the distributions of excess returns for surviving active funds from the large-growth and diversified emerging-markets categories, providing a flavor of both ends of the spectrum.
Mortality and Distribution of 10-Year Annualized Excess Returns for Surviving Active Large-Growth Funds
Mortality and Distribution of 10-Year Annualized Excess Returns for Surviving Active Diversified Emerging-Markets Funds
Don’t Forget Fees
Fees matter. Over the 10 years ended June 2023, funds in the cheapest quintile of their category succeeded at a 31% rate, compared with 19% for the priciest ones. Lower-cost funds also had slightly better staying power, as 64% of the cheapest funds survived, whereas less than 60% of the most expensive funds did so.
The author or authors do not own shares in any securities mentioned in this article. Find out about Morningstar’s editorial policies.
/cloudfront-us-east-1.images.arcpublishing.com/morningstar/YI7RBXKMXVAZDBWEJYQREEJJL4.png)
/cloudfront-us-east-1.images.arcpublishing.com/morningstar/NZE33UZQNJC6FGMLKRPNGFAAYA.png)
/cloudfront-us-east-1.images.arcpublishing.com/morningstar/ZHTKX3QAYCHPXKWRA6SEOUGCK4.png)
:quality(80)/s3.amazonaws.com/arc-authors/morningstar/30e2fda6-bf21-4e54-9e50-831a2bcccd80.jpg)