
Markets Brief: Why You Should Watch the Dot Plots at the Fed’s March Meeting
Will the Fed signal an interest-rate cut in June, but with fewer to follow?
/s3.amazonaws.com/arc-authors/morningstar/ed529c14-e87a-417f-a91c-4cee045d88b4.jpg)

As Federal Reserve officials gather for their March meeting, the focus isn’t on Wednesday afternoon’s decision for interest rates, but on what may happen months from now. The central bank is widely expected to announce that it will leave interest rates unchanged. The bigger question is whether it will lower rates in June (as the bond market currently expects), and how many cuts to expect in 2024.
“We’re approaching the endgame where the Fed would like to have a point where they cut rates,” says Donald Rissmiller, chief economist at Strategas Research Partners. “But not yet.”
Hints about the timing and scope of rate cuts could come from the Fed’s so-called dot plots, a quarterly visual depiction of individual officials’ economic and interest-rate forecasts. In December, the median Fed forecast called for three rate cuts in 2024. However, with the economy staying strong and inflation pressures still sticky, some believe the Fed may pare back to just two cuts this year. This would signal investors to expect a “higher for longer” rate landscape for some time.
“There’s going to be a lot of information embedded in those dots and those estimates,” says Lindsay Rosner, portfolio manager for the $2 billion Goldman Sachs Core Bond Fund.
Federal Funds Rate
Confidence About Inflation Key to Fed Rate Cuts
Even if the Fed doesn’t signal fewer rate cuts on Wednesday, the expected message from the bank’s statement and Chair Jerome Powell’s press conference is that officials will be cautious about easing monetary policy.
While investors came into 2024 expecting rate cuts would begin this month, the consensus is now that June is the more likely option. The bond market had previously been priced for six cuts this year, but more economists now lean toward three cuts staggered through every other meeting.
There will also be close attention to any discussion of Fed officials winding down their reduction in bond holdings, a process known as quantitative tightening.
For the Fed, the key is having more confidence that the inflation battle has been won—a sentiment Powell is widely expected to reinforce. “I don’t think we can say mission accomplished, but I think we can say mission almost accomplished, and the Fed has certainly made progress in the last two years,” Rissmiller says.
However, the Fed is also aware that changes in monetary policy affect the economy with a significant lag. “Should they start an adjustment process today that could get the economy into a better place one or two years for now? I think that’s the argument here, so there’s an appetite to cut rates slowly,” Rissmiller explains.
Federal-Funds Rate Target Expectations For June Meeting
Watching the Dot Plots
The dot plots may hold clues about how confident the Fed is about a continued downtrend in inflation leaving room for rate cuts. Investors should remember that behind the plots are predictions that often turn out to be as wrong as those made by Wall Street analysts. However, they provide a window into how policymakers think about interest rates.
When the Fed last released these projections in December, inflation pressures were cooling and officials’ median forecast called for the economy to grow 1.4% in 2024, a slowdown from the 3.2% growth in the fourth quarter of 2023. As measured by the Fed’s preferred indicator, the Personal Consumption Expenditure Price Index, inflation was forecast to fall to a 2.4% rate for 2024, both with and without volatile food and energy costs factored in. Economists at Bank of America expect the central bank to upgrade its economic growth forecast to 1.8%, raise its inflation estimate to 2.5%, and hold its unemployment forecast steady.
However, progress on lowering inflation ground to a halt at the beginning of this year, with larger-than-expected CPI increases in January and February. “It will be important to see if there is an upgrade in terms of inflation expectations, unemployment, and growth,” says Rosner. From there, she says, the open question is how the Fed responds with its interest-rate forecasts.
What Will the Dot Plot Signal About Rate Cuts?
There will likely be more attention on the Fed’s median forecast for the key federal-funds rate, which was 4.6% for the end of 2024. This implied that Fed officials on balance expected three quarter-point cuts to the funds rate this year. Since last July, the rate target range has been 5.25%-5.50%.
“If it stays at three [cuts], that’s probably a pretty healthy sign that the Fed is ready to cut this summer,” says Maulik Bhansali, a senior portfolio manager and co-head of the core fixed income team at Allspring Global Investments.
The Dot Plot: Federal-Funds Rate Target Level
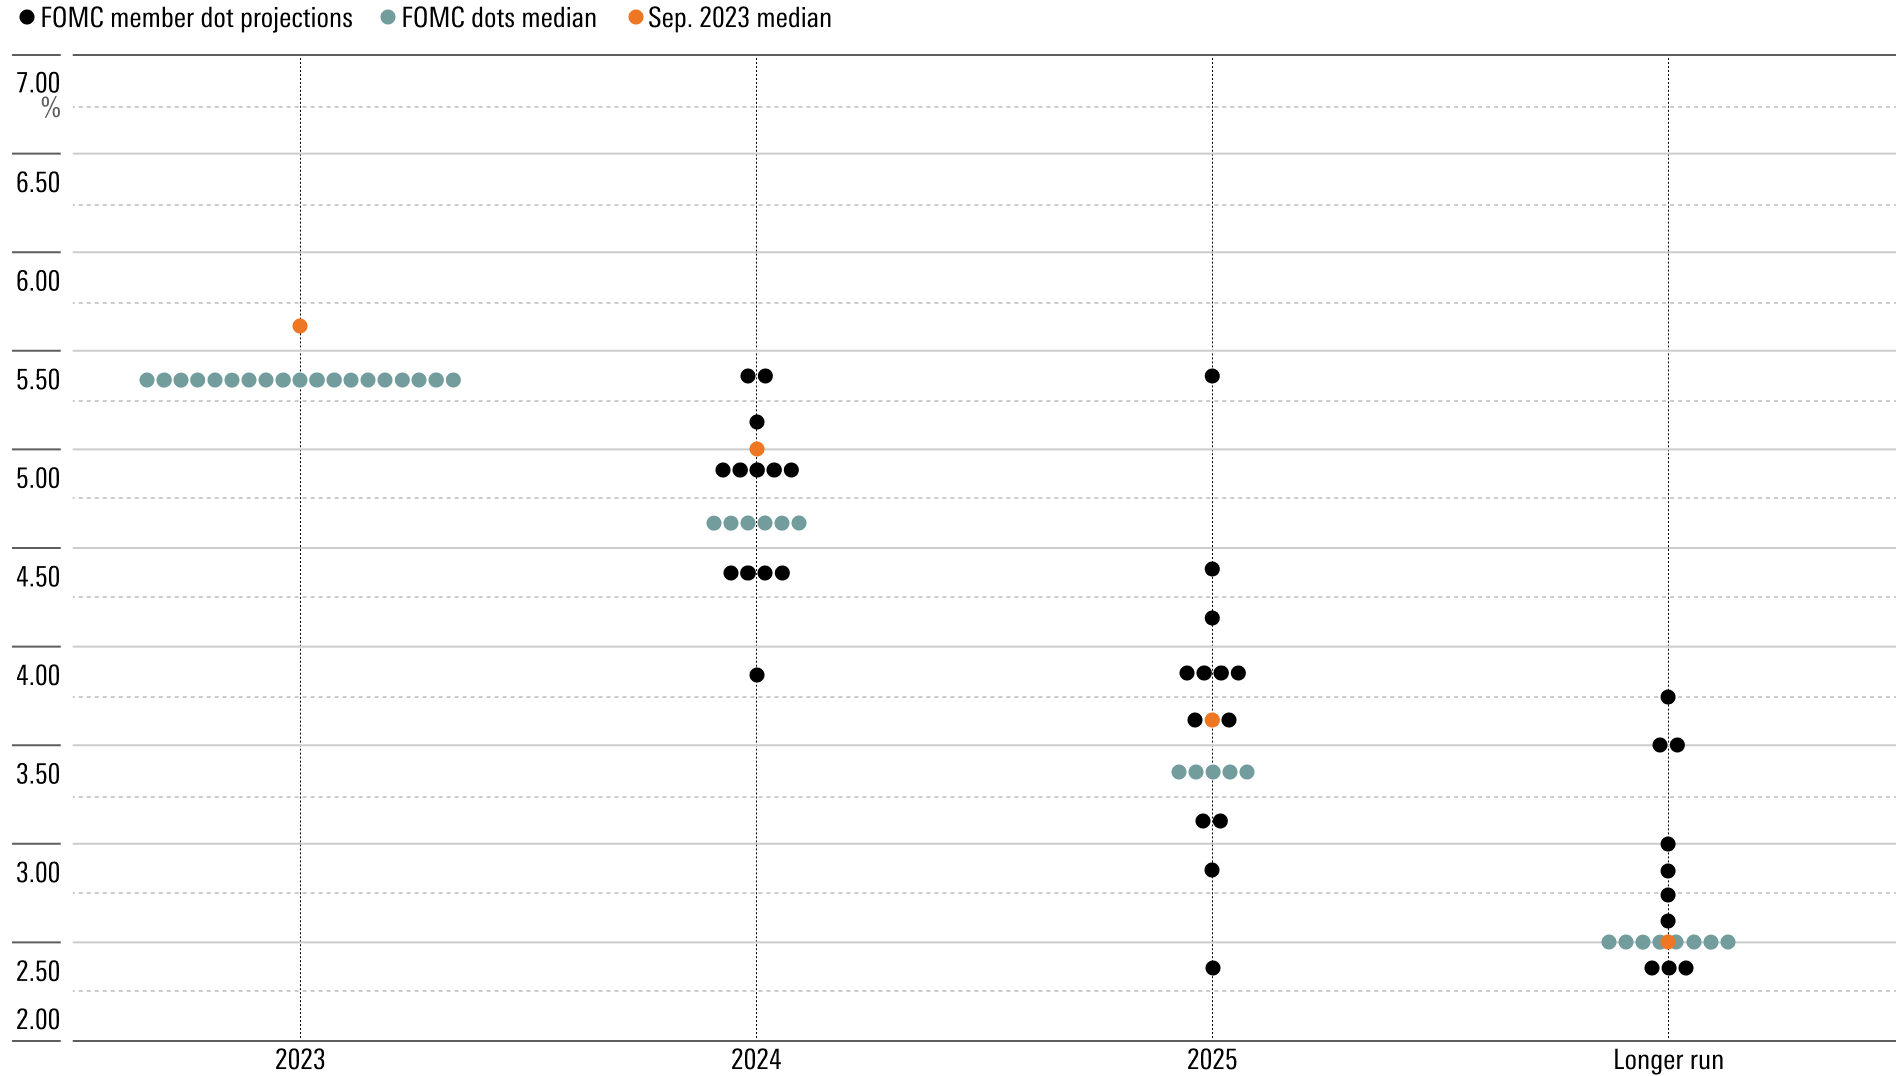
However, as progress toward reducing inflation has stalled, Bhansali says investors shouldn’t be surprised if the dot plot only predicts two rate cuts. Bank of America’s team expects the call to remain at three cuts with a “clear risk” of fewer, US economist Michael Gapen wrote in a research note Friday.
At J.P. Morgan, chief US economist Michael Feroli sees “better than even odds” that the Fed signals just two cuts for the year. “The December dot plot left a low bar for that dot to move from showing three cuts this year to two cuts,” he wrote Friday. His forecast calls for three cuts this year, starting in June and happening every other meeting.
Long-Run Expectations for Interest Rates
Economists are also alert for any change to the Fed’s longer-run forecast for the funds rate, which was 2.5% in December. For example, Feroli thinks the target could increase to 2.625% or 2.750%. Behind the potential increase is the surprising degree of resiliency the US economy has shown to the Fed’s most aggressive series of interest-rate increases in history.
“The long-run interest rate has been 2.5% for a very long time, but we’ve heard some comments that there could be scope for that to go up slightly,” says Bhansali. “If the longer-run rate shows signs of moving up, that has implications for … five-year [or] 10-year interest rates, which are more important for the economy.”
A higher long-run rate has implications for how much the Fed could ultimately cut rates, Bhansali explains: “If the rate is higher than 2.5%, they have less scope to cut to get to a neutral position.” For investors, “it probably means more to watch what the longer-run rate is doing than what happens this year.”
Watching for the End of Quantitative Tightening
While the spotlight will be on clues about future rate cuts, analysts will also be paying close attention to the somewhat arcane discussion about what’s called the Fed’s balance sheet: the central bank’s holdings of bonds it purchased in the open market as part of efforts to pump money into the economy during the pandemic-driven recession. Those purchases were part of a process known as quantitative easing. In May 2022, the Fed’s holdings of bonds totaled nearly $9 trillion. But since June 2022, the Fed has been reversing that effort through quantitative tightening.
Now officials are looking to wind down quantitative tightening. While this won’t have the same impact on the economy as changes in interest rates, it’s an important step for liquidity in the banking system and would reinforce the Fed’s tilt toward lowering rates. “Quantitative tightening has been running in the background; it’s not been the primary tool,” says Rissmiller. “I would expect it to stay mostly on autopilot, but maybe with a slightly different trajectory.”
For the Trading Week Ended March 15
- The Morningstar US Market Index fell 0.28%.
- The best-performing sectors were energy, up 3.66%, and basic materials, up 0.90%.
- The worst-performing sector was real estate, down 2.92%.
- Yields on 10-year US Treasury notes rose to 4.31% from 4.09%.
- West Texas Intermediate crude prices rose 2.62% to $81.03 per barrel.
- Of the 704 US-listed companies covered by Morningstar, 270, or 38%, were up, and 435, or 62%, were down.
What Stocks Are Up?
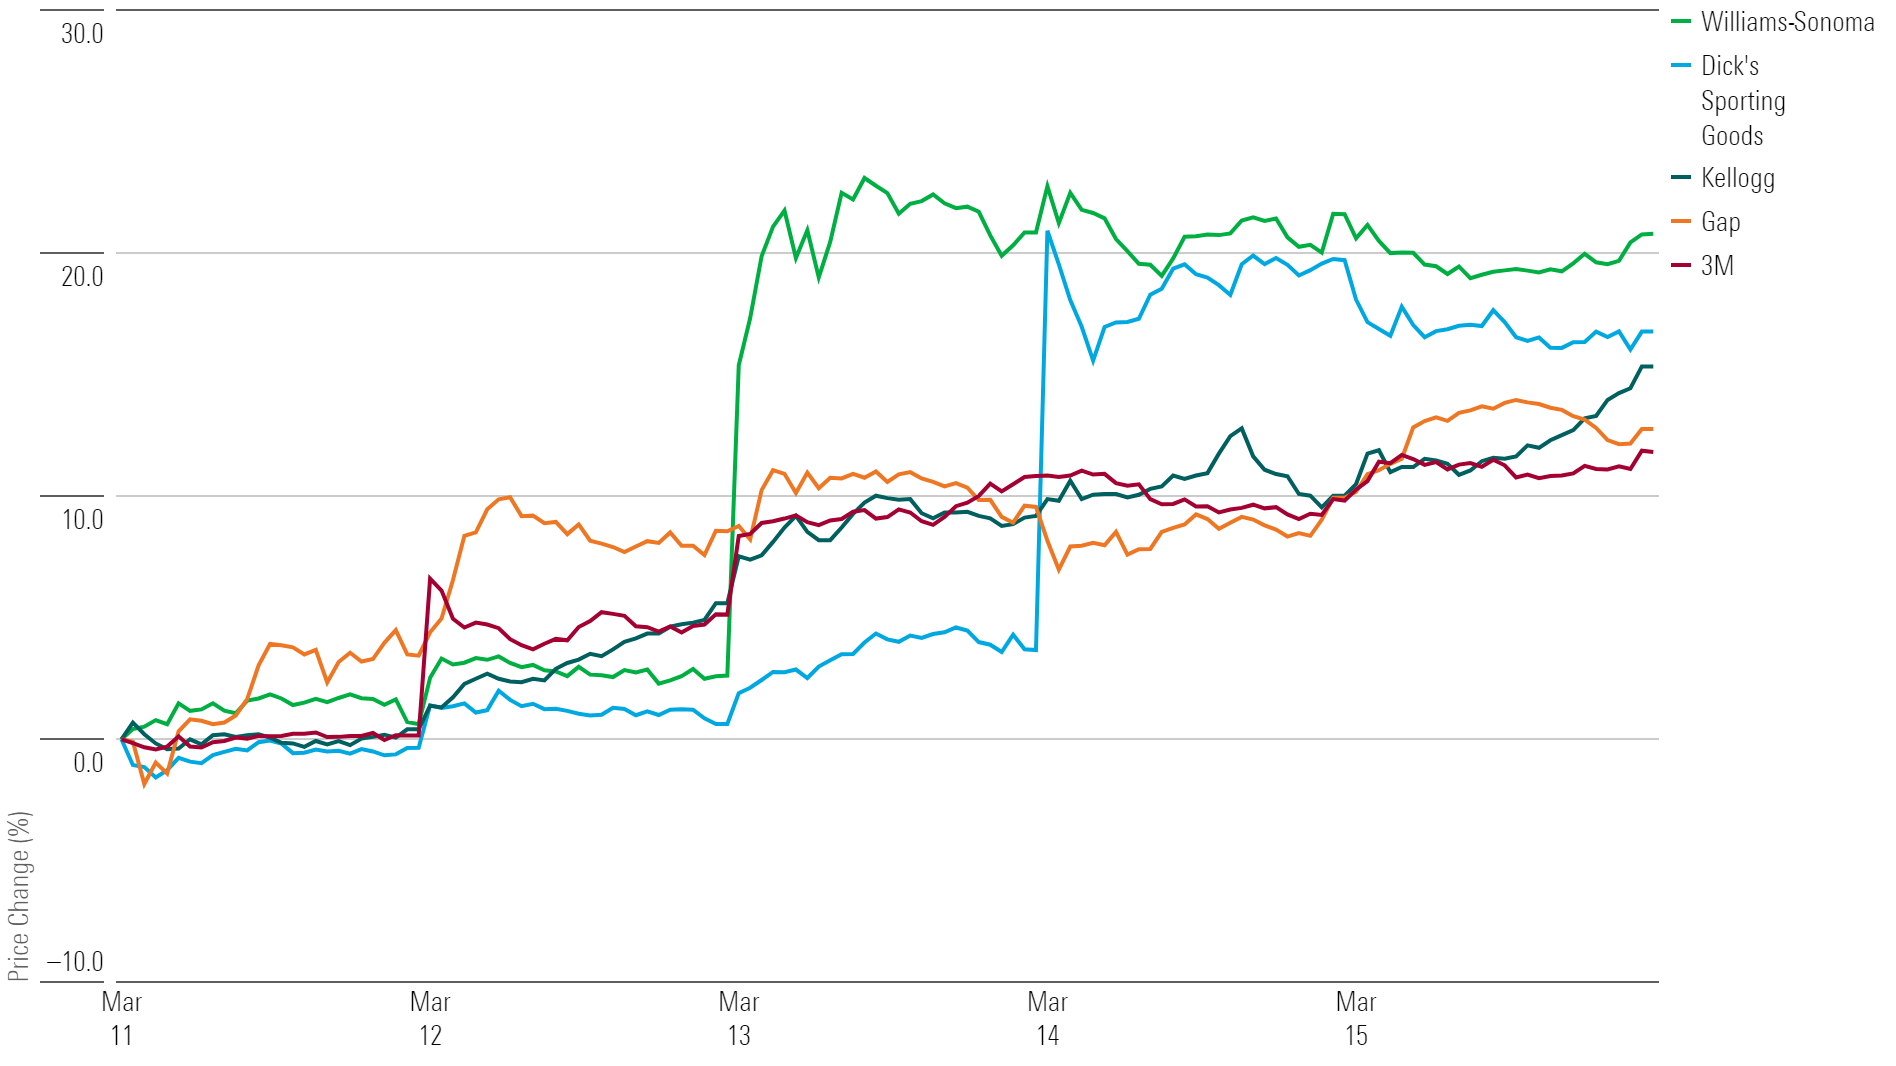
Williams-Sonoma WSM, Dick’s Sporting Goods DKS, WK Kellogg KLG, Gap GPS, and 3M MMM.
Best-Performing Stocks of the Week
What Stocks Are Down?
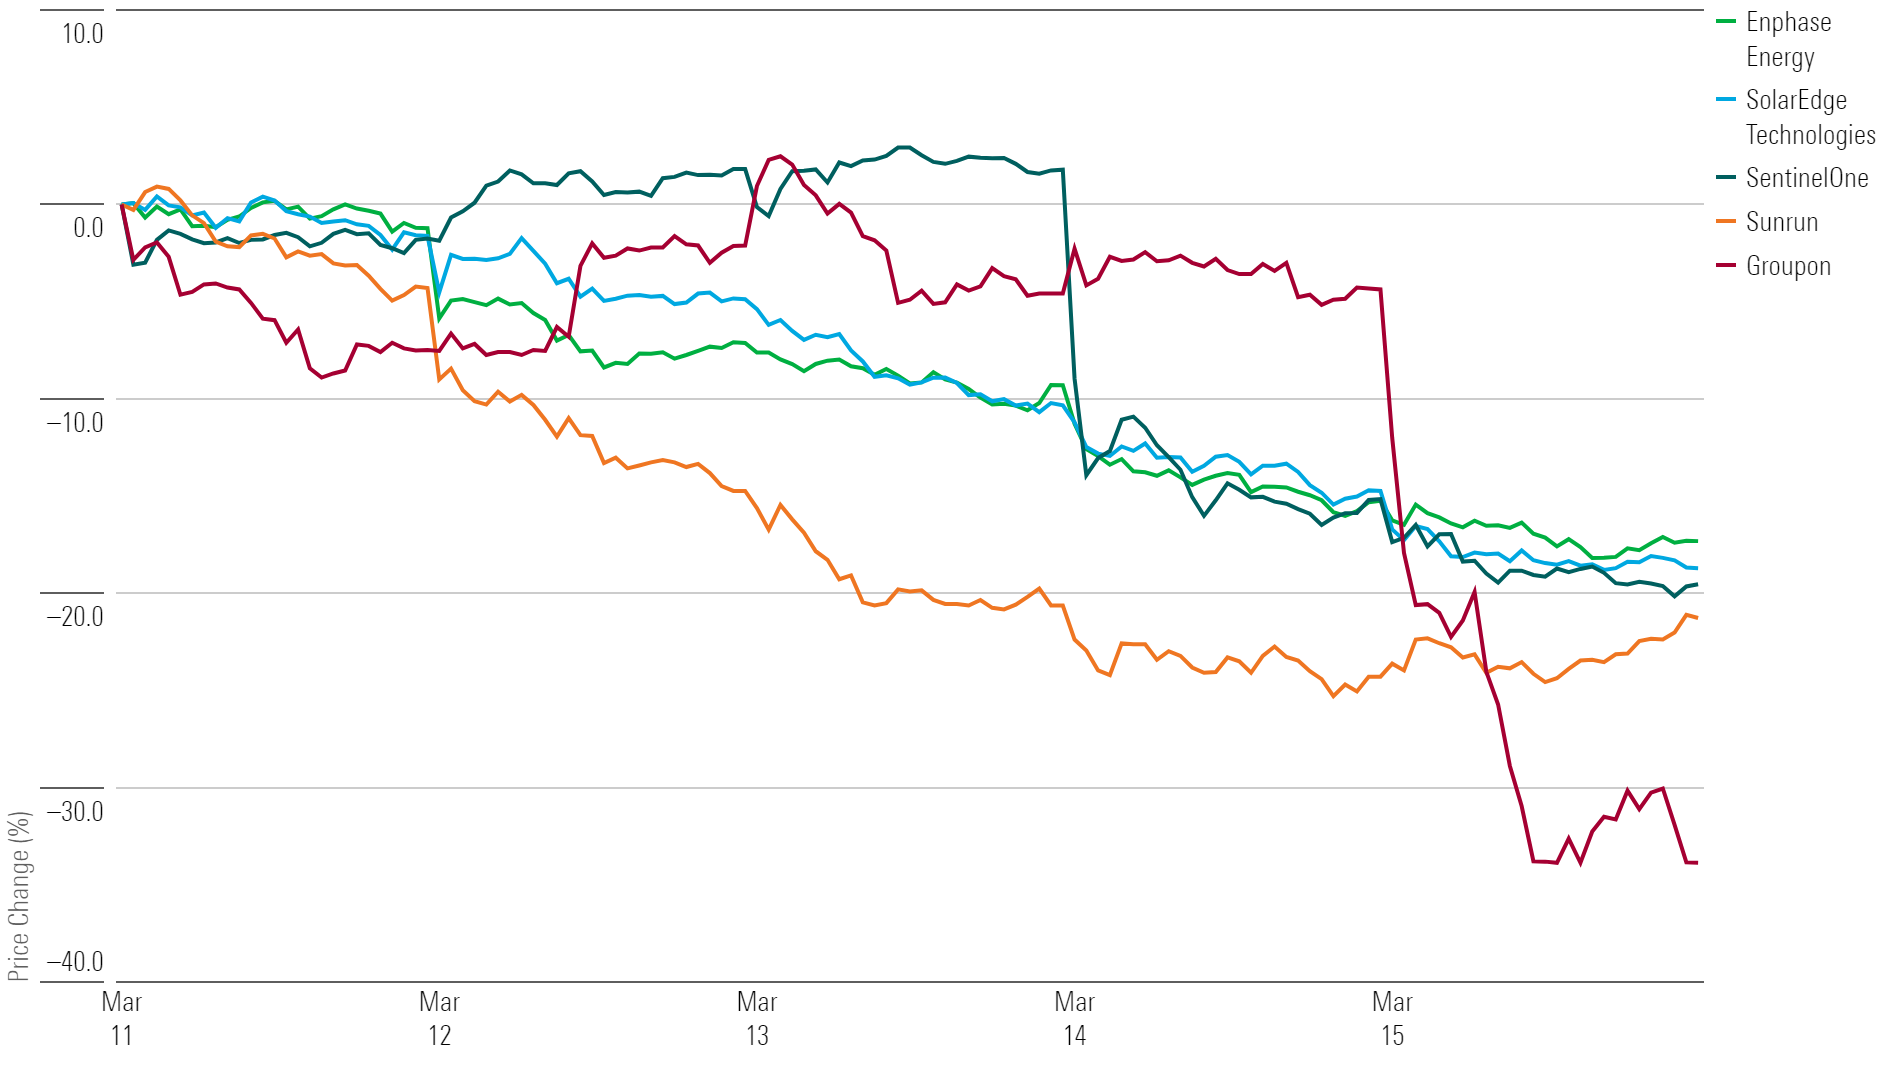
Groupon GRPN, Sunrun RUN, SentinelOne S, SolarEdge Technologies SEDG, and Enphase Energy ENPH.
Worst-Performing Stocks of the Week
The author or authors do not own shares in any securities mentioned in this article. Find out about Morningstar’s editorial policies.
/cloudfront-us-east-1.images.arcpublishing.com/morningstar/XF7WENSYN5BFBFLPPFH7BJYUHE.png)
/cloudfront-us-east-1.images.arcpublishing.com/morningstar/G3DCA6SF2FAR5PKHPEXOIB6CWQ.jpg)
/cloudfront-us-east-1.images.arcpublishing.com/morningstar/VUWQI723Q5E43P5QRTRHGLJ7TI.png)
:quality(80)/s3.amazonaws.com/arc-authors/morningstar/ed529c14-e87a-417f-a91c-4cee045d88b4.jpg)