
Value vs. Growth: At Midyear 2020, Value Falls Further Behind
Energy stocks helped hold back value.
/s3.amazonaws.com/arc-authors/morningstar/8b2e267c-9b75-4539-a610-dd2b6ed6064a.jpg)
Editor’s note: Read the latest on how the coronavirus is rattling the markets and what investors can do to navigate it. Morningstar Direct users can download the full historical Value vs. Growth returns PDF heatmap here.
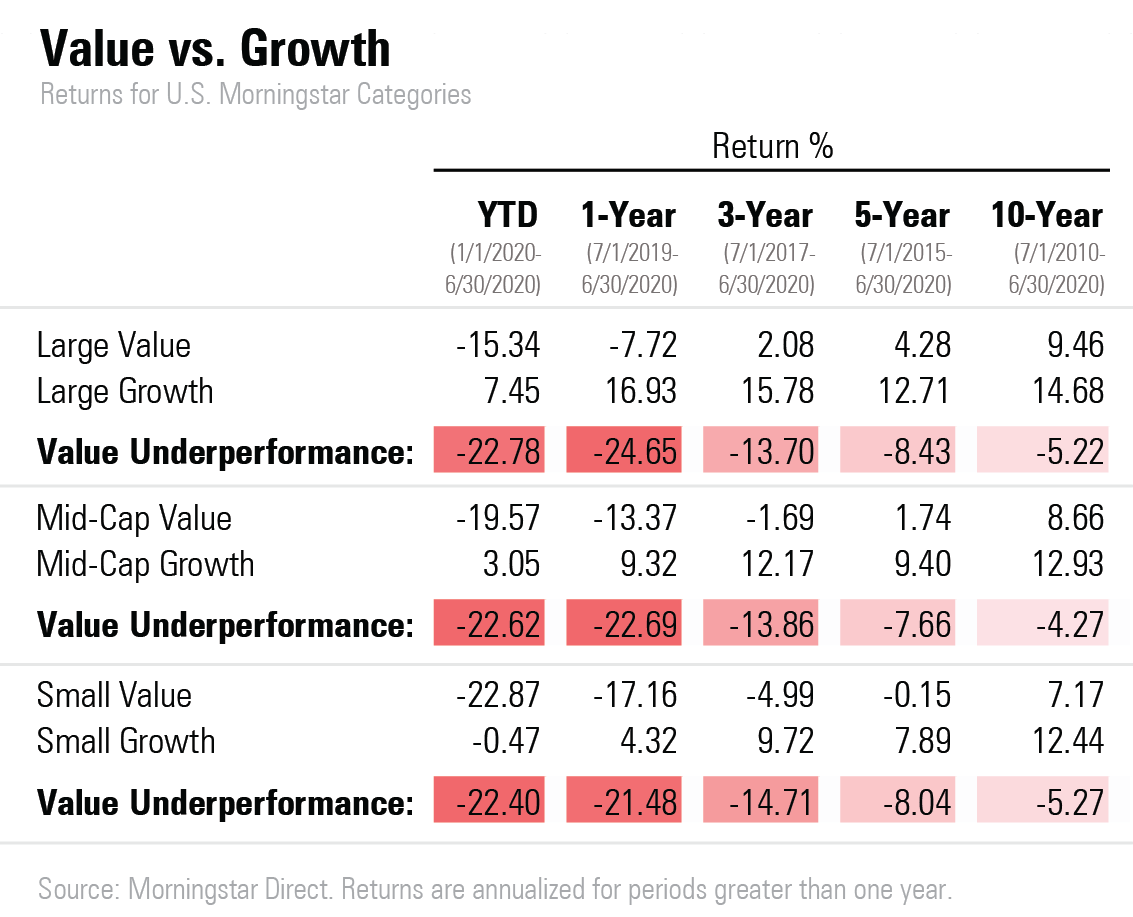
U.S. growth-stock funds are emerging from the first half’s market turmoil with an even wider performance advantage over value strategies than they had at the start of 2020.
Across one-, three-, five-, and 10-year time frames, and for large-, mid-, and small-cap stock funds, growth is outperforming value by the largest margin since the tech-stock bubble of 1999.
While value strategies have been left in the dust behind growth for years, the first-half 2020 underperformance is more striking in that value funds have historically tended to prove more buoyant in market downturns.
However, during the stock market collapse caused by the coronavirus, growth outperformed both as stocks fell and again as stocks recovered lost ground. The buoyancy of growth strategies has been led by tech and communications stocks, while value strategies have been weighed down by their exposure to energy stocks.
Value’s underperformance so far in 2020 is consistent across all market capitalizations.
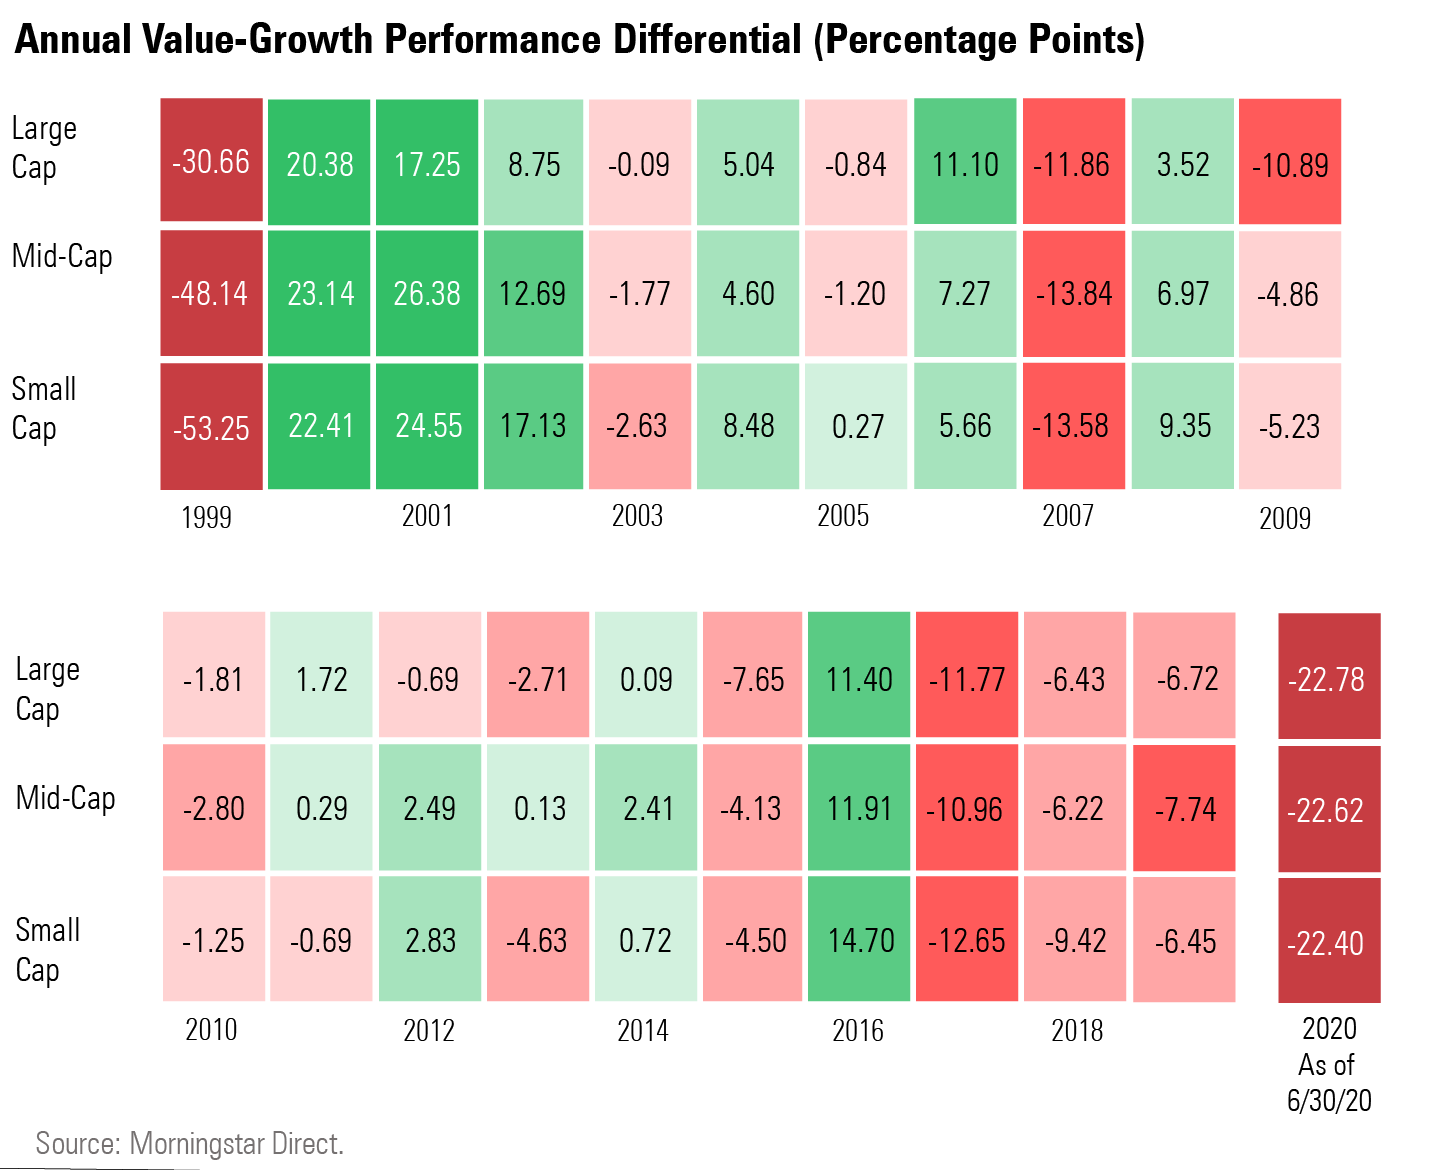
On a one-year returns basis, it has been a long drought for value strategies. The last year in which value solidly outperformed growth across all three market caps was 2016, and prior to that, it takes looking back to the first decade of the 2000s, when value stocks had their best year versus growth stocks in the years immediately following 1999.
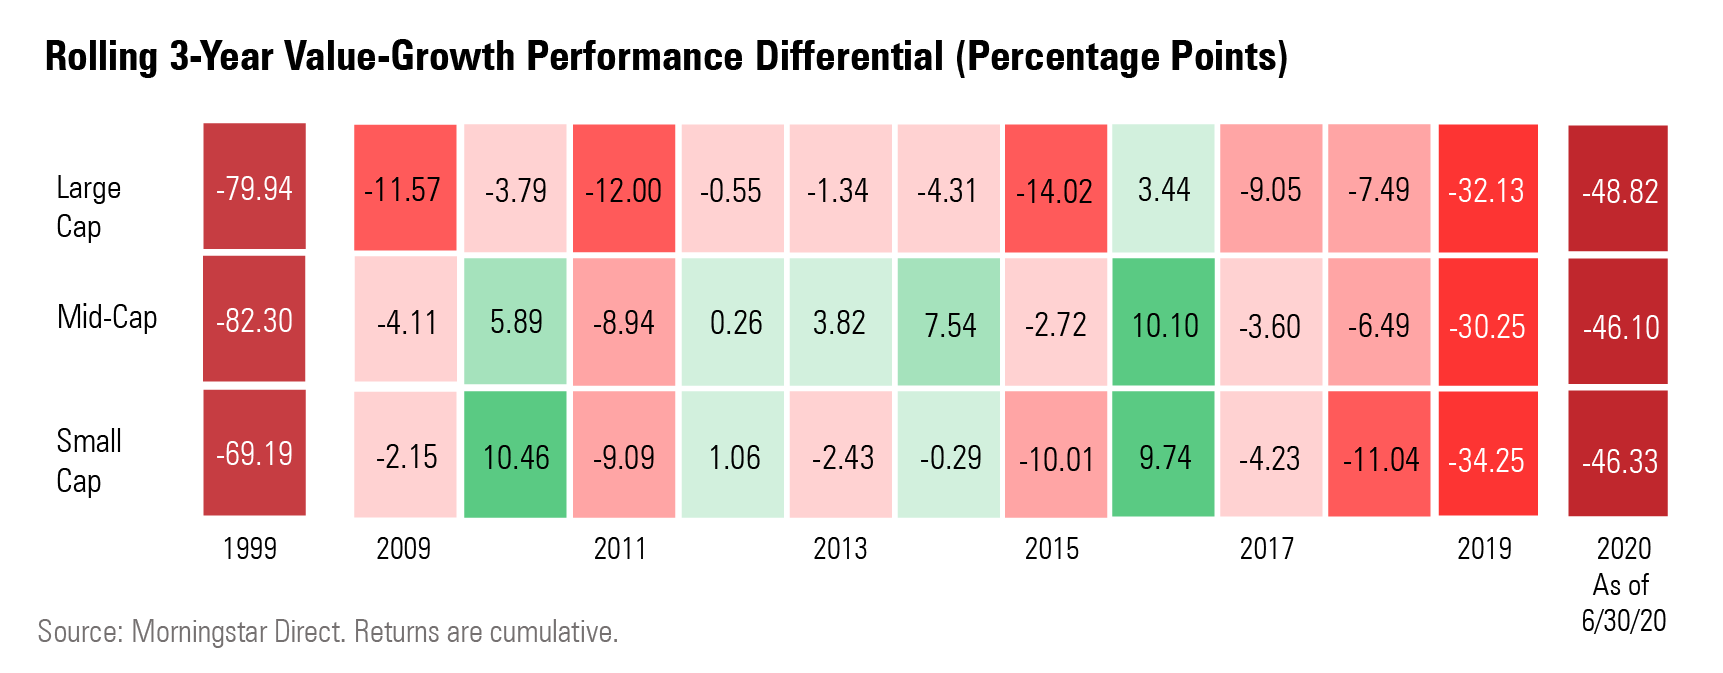
The extent of the poor first-half performance for value strategies relative to growth has widened out the longer-term differentials from where they finished 2019. For example, at the end of 2019, large-growth stocks were 32.1 cumulative return percentage points behind value for three-year returns, and mid-value stocks lagged mid-growth stocks by 30.2 percentage points for three-year returns. As of the end of June, that gap now stands at 48.8 percentage points for large cap and 46.1 percentage points for mid-cap. In both cases, those levels are the widest since 1999 but still a good distance away from the tech-bubble peaks. But the small-cap differential of 46.3 percentage points is now at two thirds of the 1999 peak.
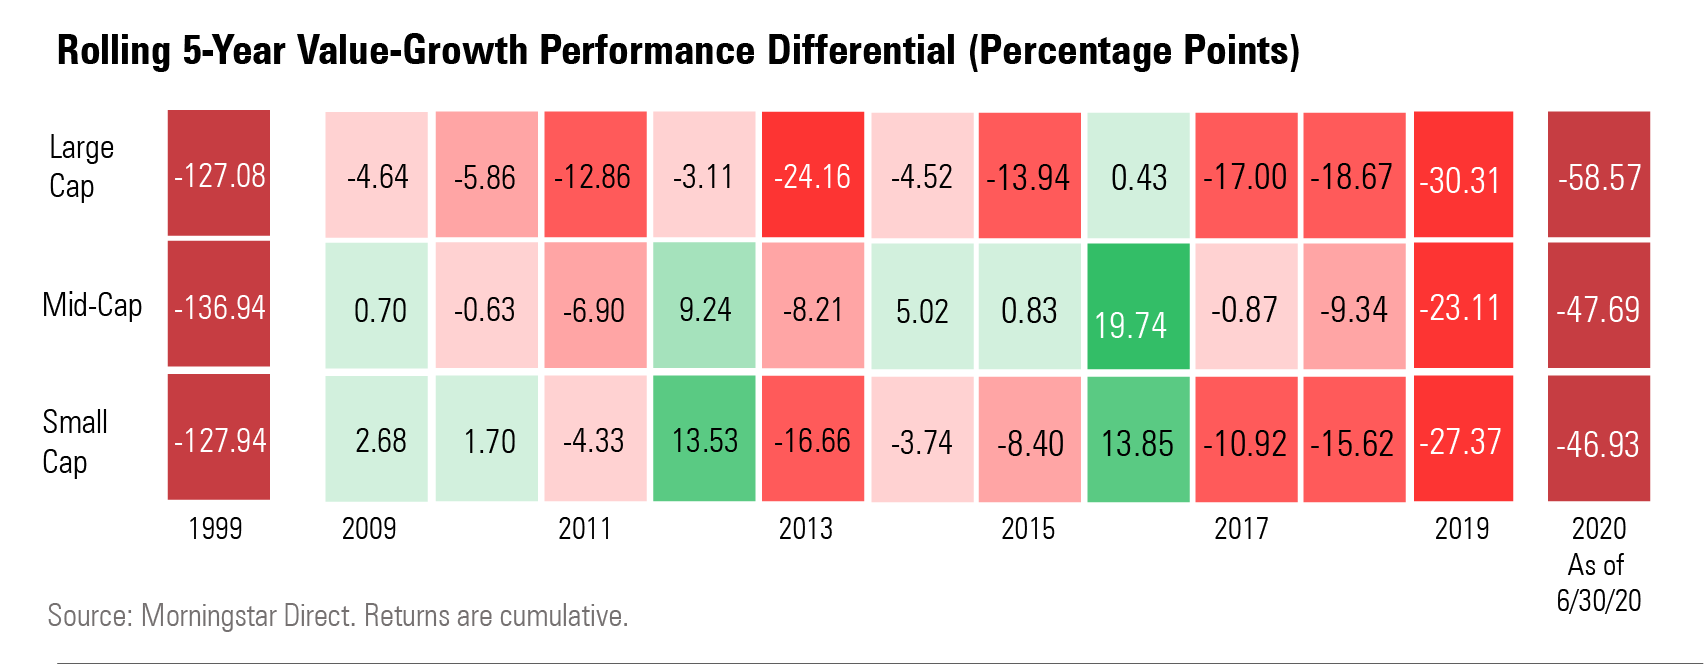
The five-year rolling return statistics capture the 2016 outperformance of value, helping mitigate the damage somewhat compared with the 1999 differential gap. But value has steadily been worsening on this metric, too.
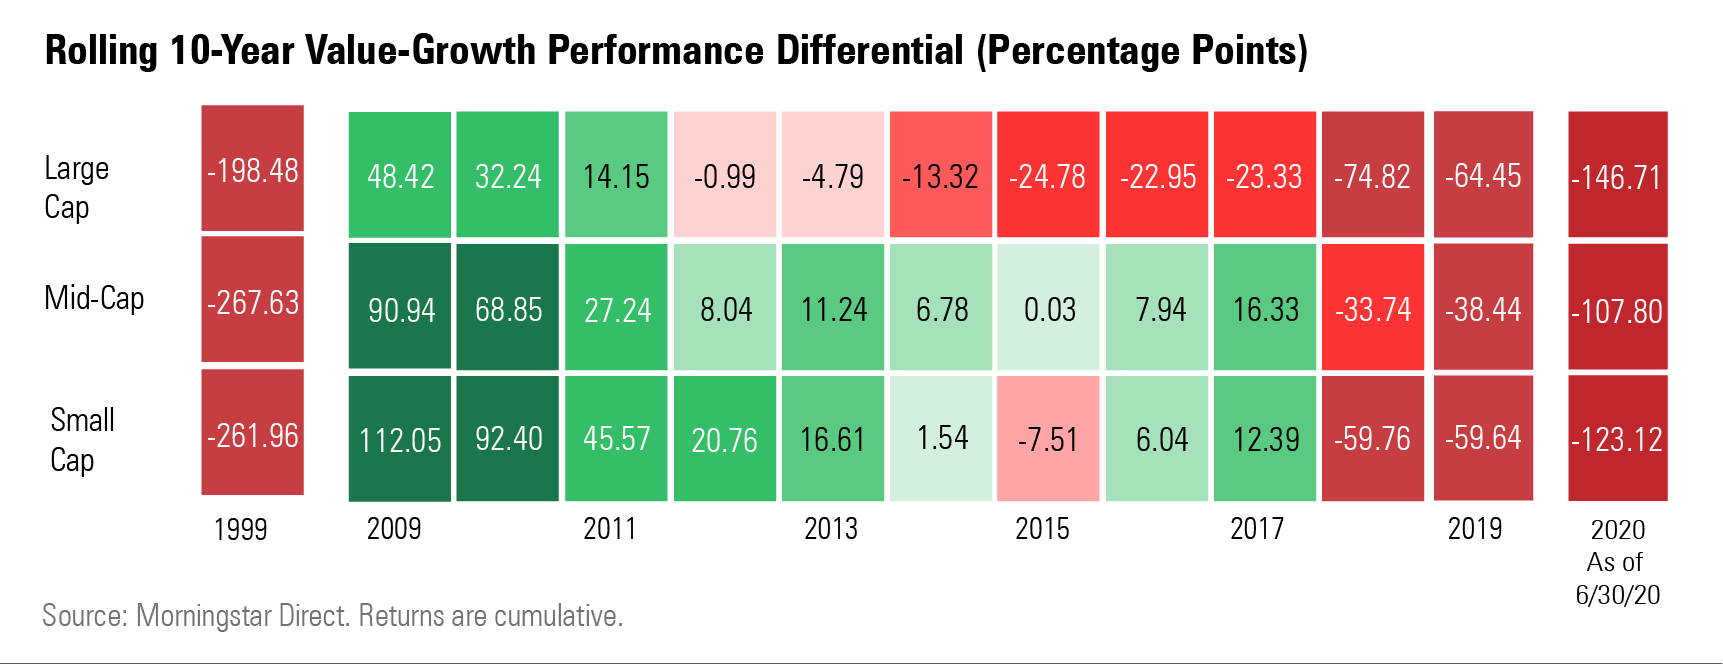
It’s on the 10-year rolling returns that the change in fortune for value over the past decade becomes clear. Thanks to the post-financial-crisis outperformance for value strategies, the group had come into the most recent decade well ahead of growth strategies.
As recently as 2017, mid- and small-cap value stocks had an advantage over growth stocks on a 10-year basis. For the 10-year period ended Dec. 21, 2017, the mid-value Morningstar Category gained an annualized 10.2% while the mid-growth category returned 7.9%.
Strong gains in growth-oriented sectors in recent years have turned the tide. As of June of this year, mid-value stocks have gained 10.6% and mid-growth stocks 15.5% over the past 10 years. The universe of large-cap stocks is the area where value has fallen behind the most. Ten-year returns for large-growth stocks have bested value since 2011, and the divergence has only grown. In 2014, the gap was 13.32 cumulative return percentage points; today, large-value lags large-growth over the past 10 years by 146.71 percentage points.
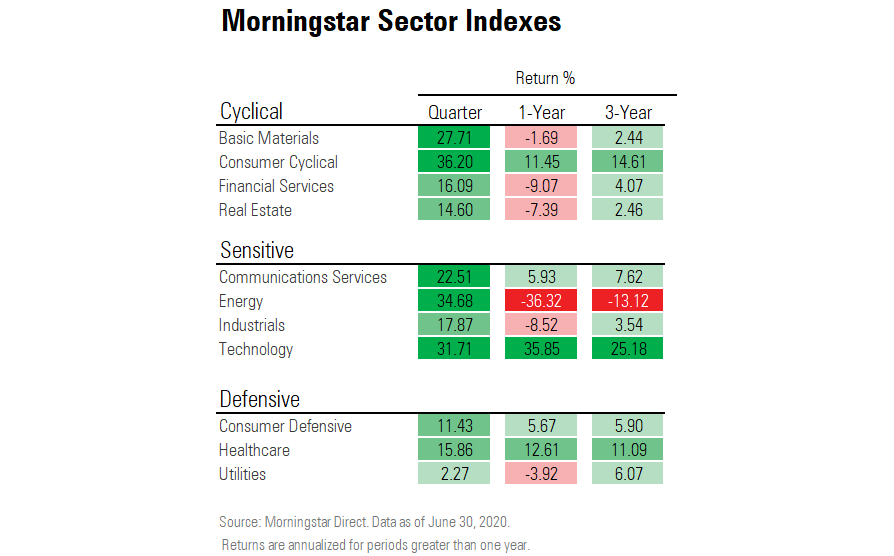
Underlying these trends to a large degree are sector weightings. Energy stocks, which account for 6.2% of the large-value category and less than 1% of the large-growth category, have significantly weighed down returns for value funds. Over the trailing 12 months, the energy sector has lost 35.3% and remains the only equity sector that is the red over the past three years.
Financial-services and consumer defensive stocks--both value-oriented sectors--also explain some of the underperformance. The large-value category has a 6.2% weight in consumer defensive and 18.5% in financial-services sectors compared with the large-growth category’s 4.1% and 10.9%. In the one-year period ended June 30, 2020, the financial-services sector has lost 9.1% and the consumer defensive sector has advanced 5.7%.
Of course, one of the biggest differences is in tech stocks. The tech sector--where large-growth funds hold an average weight of 29% but large-value funds average 10.8%--has returned 35.8% over the past year.
/cloudfront-us-east-1.images.arcpublishing.com/morningstar/6ZMXY4RCRNEADPDWYQVTTWALWM.jpg)
/cloudfront-us-east-1.images.arcpublishing.com/morningstar/URSWZ2VN4JCXXALUUYEFYMOBIE.png)
/cloudfront-us-east-1.images.arcpublishing.com/morningstar/CGEMAKSOGVCKBCSH32YM7X5FWI.png)
:quality(80)/s3.amazonaws.com/arc-authors/morningstar/8b2e267c-9b75-4539-a610-dd2b6ed6064a.jpg)