
14 Charts on the Q1 2023 Whiplash Market Performance
Big swings in expectations around Fed policy dominated stock and bond market returns.
/s3.amazonaws.com/arc-authors/morningstar/ba63f047-a5cf-49a2-aa38-61ba5ba0cc9e.jpg)
After a brutal 2022, stocks and bonds posted gains during the first quarter. But it was a back-and-forth, back-again ride along the way as the banking crisis turned expectations for Federal Reserve policy upside down.
It was also a quarter of reversals within the markets: Investors rotated back into beaten-up stocks of tech giants, leading to huge price gains on many of the same names that inflicted huge losses on investors’ portfolios last year. Growth stocks more broadly staged a rebound, while value and dividend-paying stocks slumped. In the bond market, investors flocked to safety in Treasuries and away from riskier debt.
The start of the year also saw a divergence between the stock and bond markets when it came to signals about the economic outlook. During the first quarter, stocks were stuck in the range they’ve been trapped in for over six months, suggesting investors see little difference in the outlook for the economy or corporate profits despite the banking crisis. But bond yields have been falling fast, highlighting concerns about the growing potential for a recession.
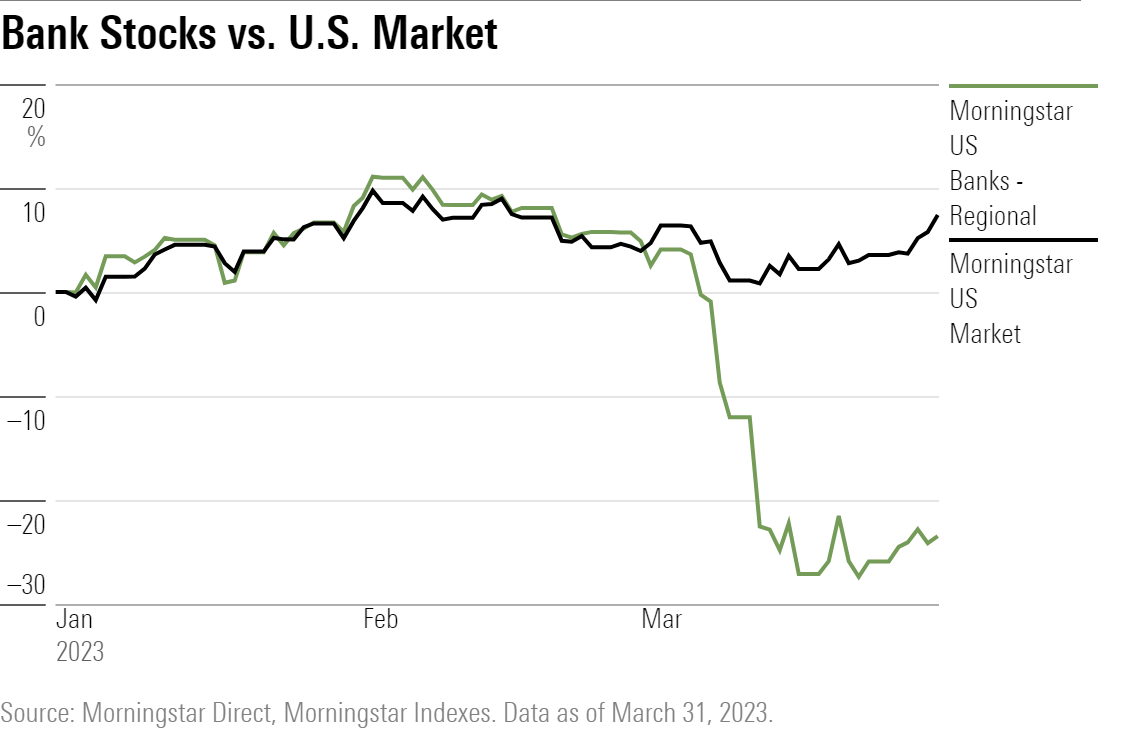
The chief concern among many investors shifted from inflation to a liquidity crisis among regional banks, which began with the collapse of Silicon Valley Bank on March 9. But because investors seem convinced that the Fed has contained the problem, much of the stock market was able to weather the storm.
Damage was largely limited to regional bank stocks and real estate investment trusts. The Morningstar US Banks-Regional Index fell further than all other Morningstar U.S. indexes, down 23.5% for the first quarter of 2023. San Francisco-based First Republic Bank FRC lost 88.3%, and bank holding company KeyCorp KEY fell 27.0%.
Investors had been warned that something in the markets or economy might break as a result of the Fed’s interest-rate hikes, and the banking crisis was the first big crack. Now, investors and the Fed are watching and waiting to see how much of an impact it really has on the economy. But at the very least, with the Fed thinking that it doesn’t have to raise rates as high as it did just a few weeks ago, a friendlier interest-rate outlook has provided some support for the stock market.
Key Stats: Q1 2023 Market Performance
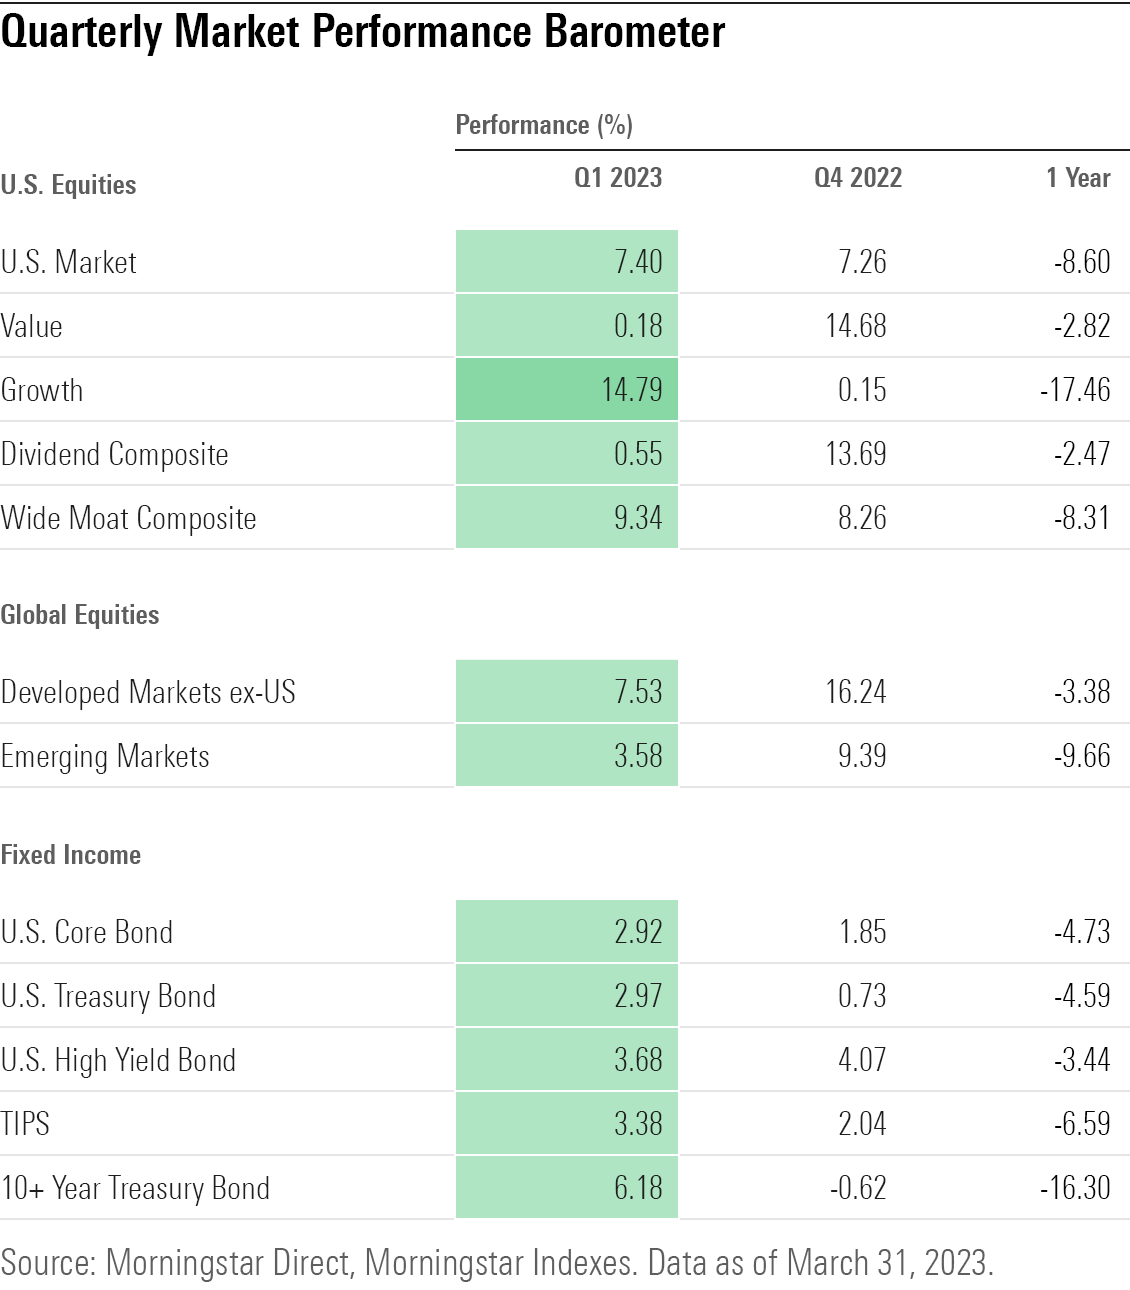
- The Morningstar US Market Index gained 7.4% during the first quarter. Stocks are up 12.5% from their Oct. 14 low but still down 13.5% from their latest high on Jan. 3, 2022.
- Growth stocks bested value by 14 percentage points in the first quarter of 2023.
- At the sector level, tech stocks had their best quarter since the second quarter of 2020, as measured by the Morningstar US Technology Index. Meanwhile, energy stocks ended first-quarter 2023 down 5.0% for their first quarter in the red since second-quarter 2022.
- Dividend stocks lagged, ending the quarter near where they started, trailing the broader market by nearly 7 percentage points.
- Bonds gained during the quarter: The Morningstar US Core Bond Index rose 2.9%.
- Volatility in the bond market remains at twice its long-term levels for the fourth quarter in a row.
- Within the bond market, investors sought the safety of U.S. Treasuries while shunning bonds with lower credit ratings.
- The Fed raised its benchmark federal-funds rate twice in the first quarter, each time by 0.25 percentage point. The funds rate finished the quarter at a range of 4.75%-5.00%, its highest since 2007.
- The yield on the two-year U.S. Treasury reached a high of 5.05% on March 8, only to plummet to a low of 3.76% on March 24. The days following March 8 brought the steepest three-day decline in the two-year Treasury yield since the stock market crash of 1987.
- At its steepest point during first-quarter 2023, the yield curve became the most inverted it had been since 1981.
- Crude-oil prices dipped to $66.74 per barrel on March 17, their lowest level since November 2021. Oil prices ended the first quarter at $75.67 per barrel.
- Leading cryptocurrencies made gains in the first quarter as bitcoin BTC rose 67.1% and ethereum ETH rose 47.2%.
Stock Market Performance
For the first three months of the year, stocks seesawed in territory well-worn over the past six months, tossed back and forth by shifting expectations for Fed policy.
Stocks gained 6.8% in January, fell 2.3% in February, and finished March up 2.3%. That left the Morningstar US Market Index up 7.4% for the first quarter.
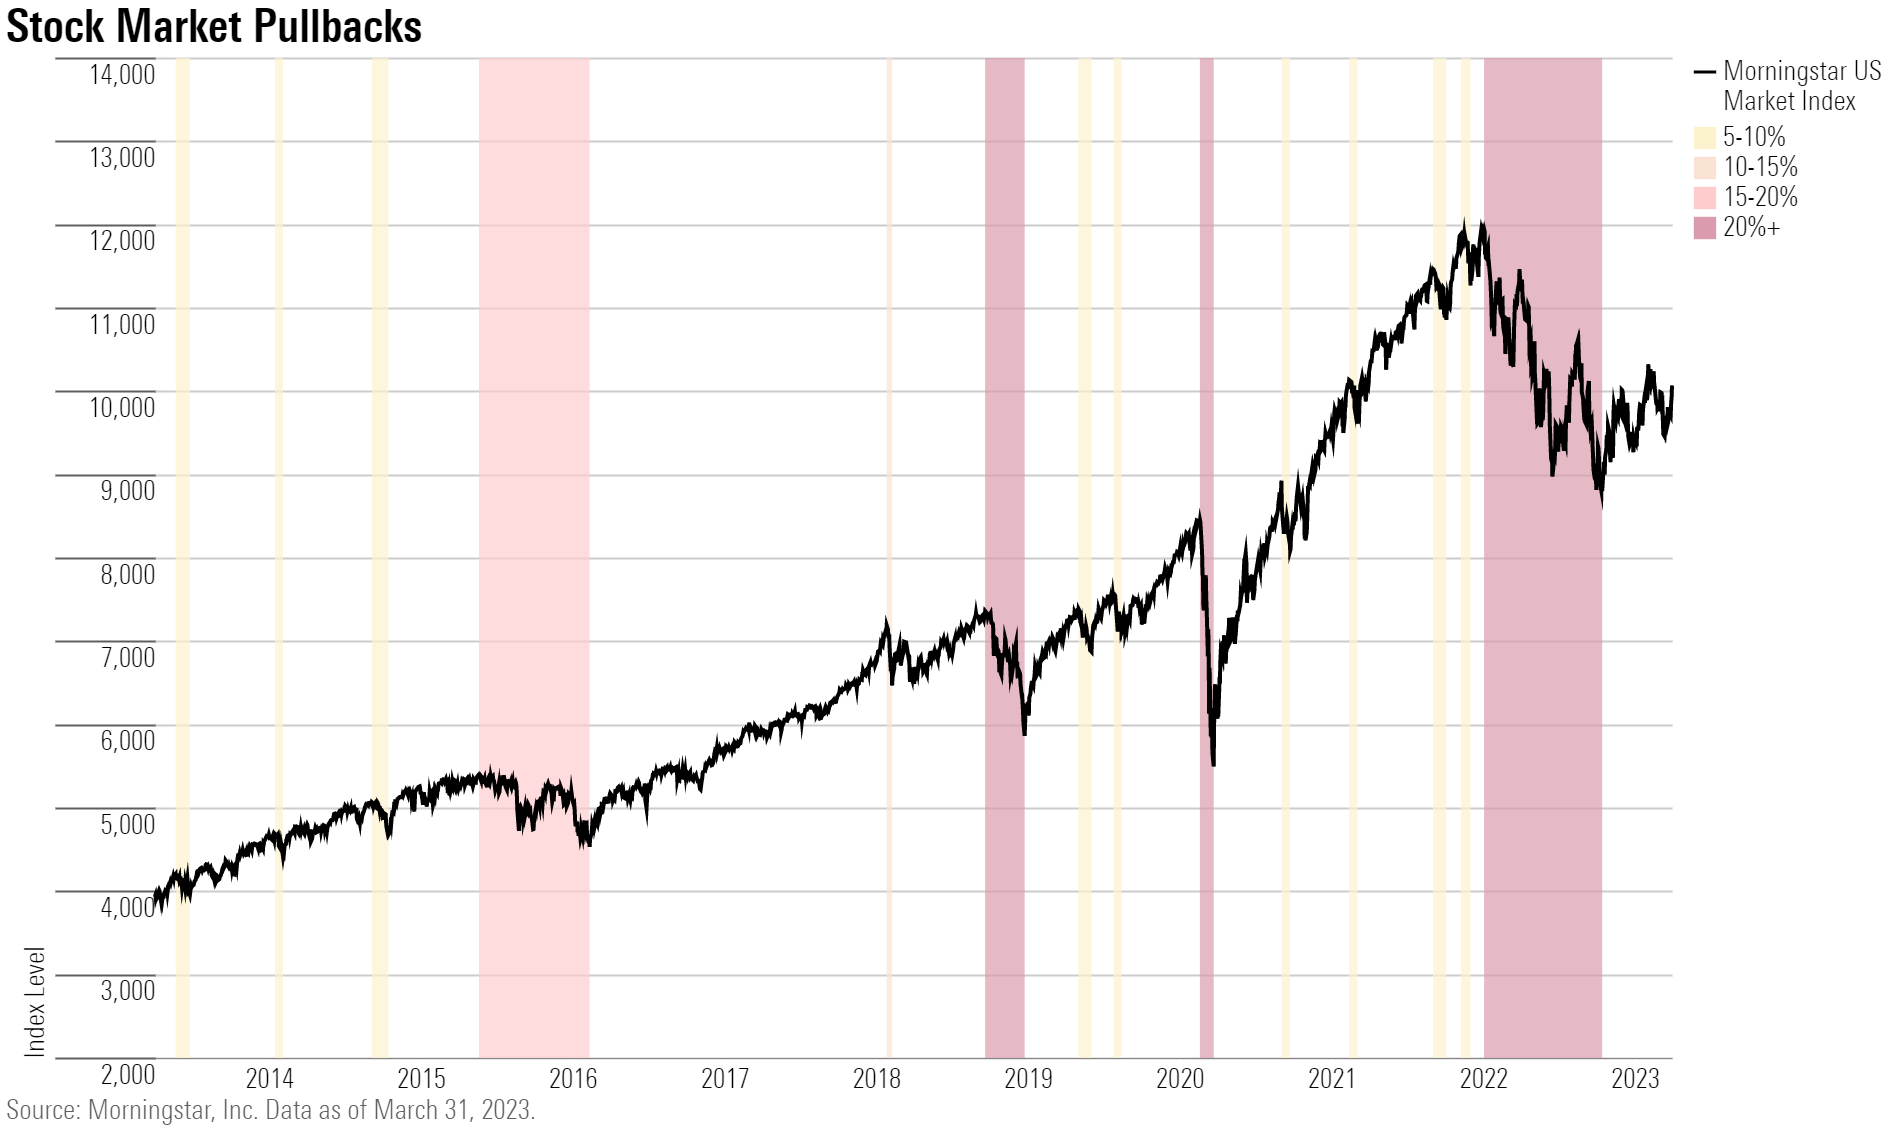
Still, U.S. stocks ended the quarter stuck near bear-market territory, down 13.5% from their last record-high set on Jan. 3, 2022.
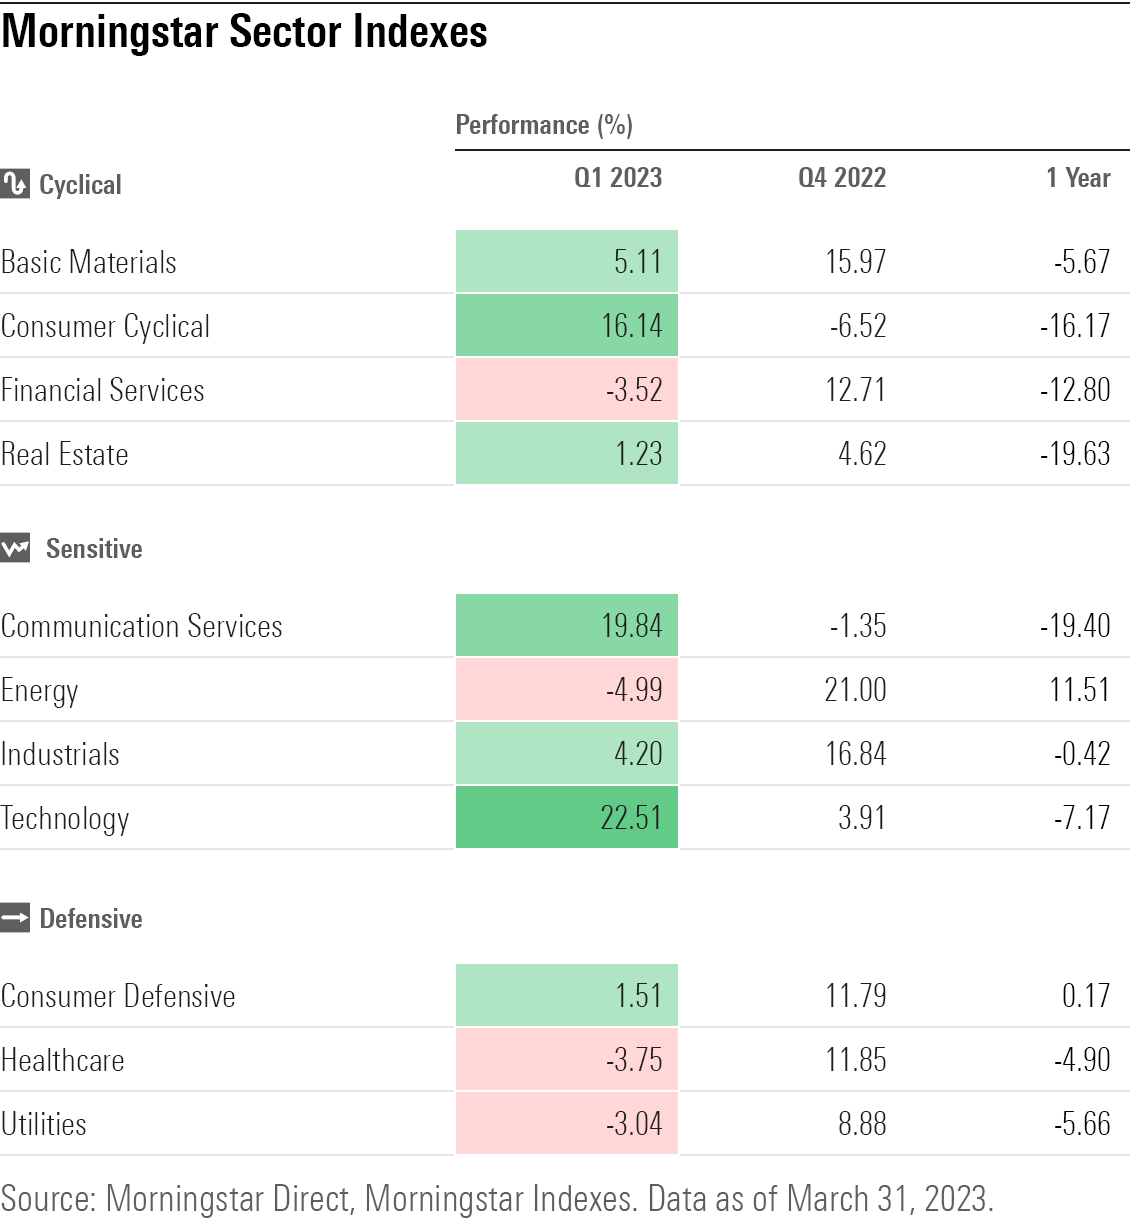
Stock Sector Performance
At the sector level, the first quarter saw a reversal of the trends that dominated the market in 2022.
Technology and communication services stocks, home to many of the market’s worst performers last year, carried the market higher during the first quarter. Meanwhile, while energy and defensive sectors—generally the most buoyant names in 2022—lagged in the first three months of year.
Big tech stocks such as Apple AAPL—up over 27% for the quarter—and Nvidia NVDA, which gained roughly 90%, were the leading contributors within the Morningstar US Technology Index.
Communication services rallied strongly during the first quarter, but for the past 12 months, they remain deeply in the red, down 19.4%. Within the Morningstar US Communication Services Index, first-quarter leading contributors included Facebook parent company Meta Platforms META, which rose about 76%. Google parent company Alphabet GOOGL, another heavyweight in the index, gained just shy of 18% for the first three months of the year.
Energy stocks—which led the stock market in 2022 by a long shot—were the bottom-performing sector in the first quarter as oil prices slid lower on concerns about a U.S. recession.
Defensive stocks also suffered in the first quarter, as stocks in the value-centric consumer defensive, healthcare, and utilities sectors all ended the quarter with losses.
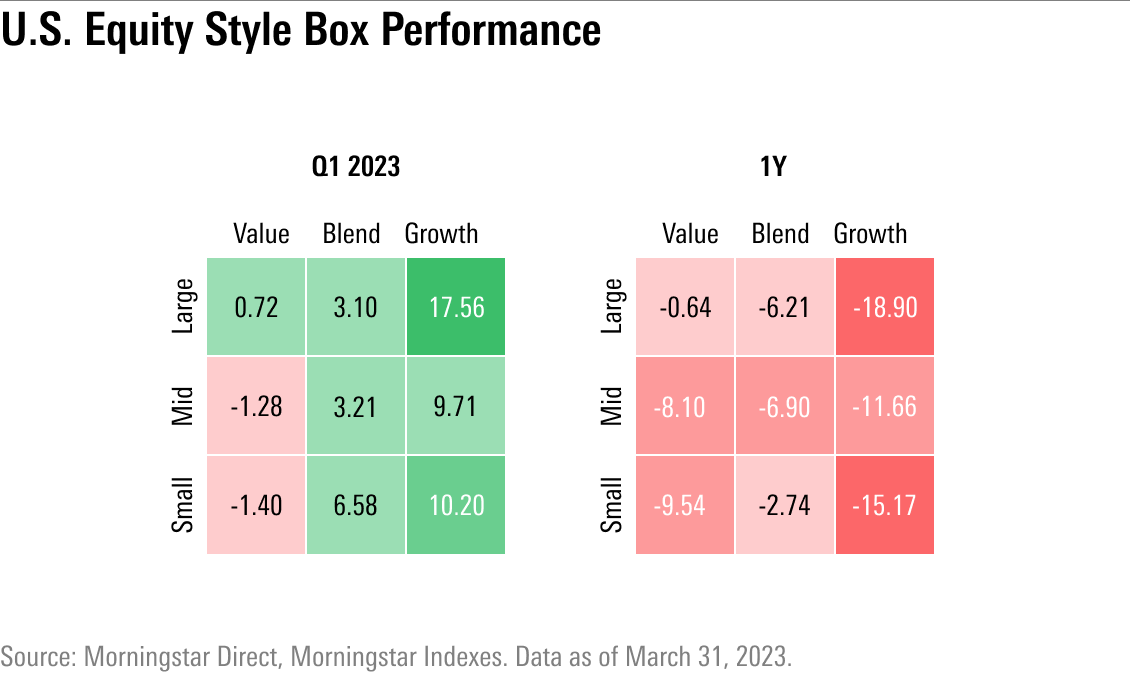
Value Stock vs. Growth Stock Performance
The first quarter brought a fresh reversal in the tug of war between value stocks and growth stocks.
Growth staged a rebound for the first quarter after 2022 saw the group’s worst year in decades. At the same time, value stocks—which had been the clear leader in 2022—lost ground. The Morningstar US Growth Index ended the quarter with a gain of 14.8%, and value stocks stayed flat as measured by the Morningstar US Value Index.
Overall, large stocks fared better than small ones during the first quarter: the Morningstar US Large Cap Index gained 8.7% while the Morningstar US Small Cap Index rose by just about half that amount. From year-ago levels, both are down about 9%.
Large-growth stocks were the leaders within the Morningstar Style Box during the first quarter, while small and midsize value stocks fell into the red. Smaller stocks tend to get hit harder by fears of a U.S. recession when compared with larger stocks, in part because many large-company stocks generate more revenues from non-U.S. economies than small companies do. Over the past 12 months, though, large-growth stocks are still down with double-digit losses, while value stocks generally protected against the worst of the bear market’s losses.
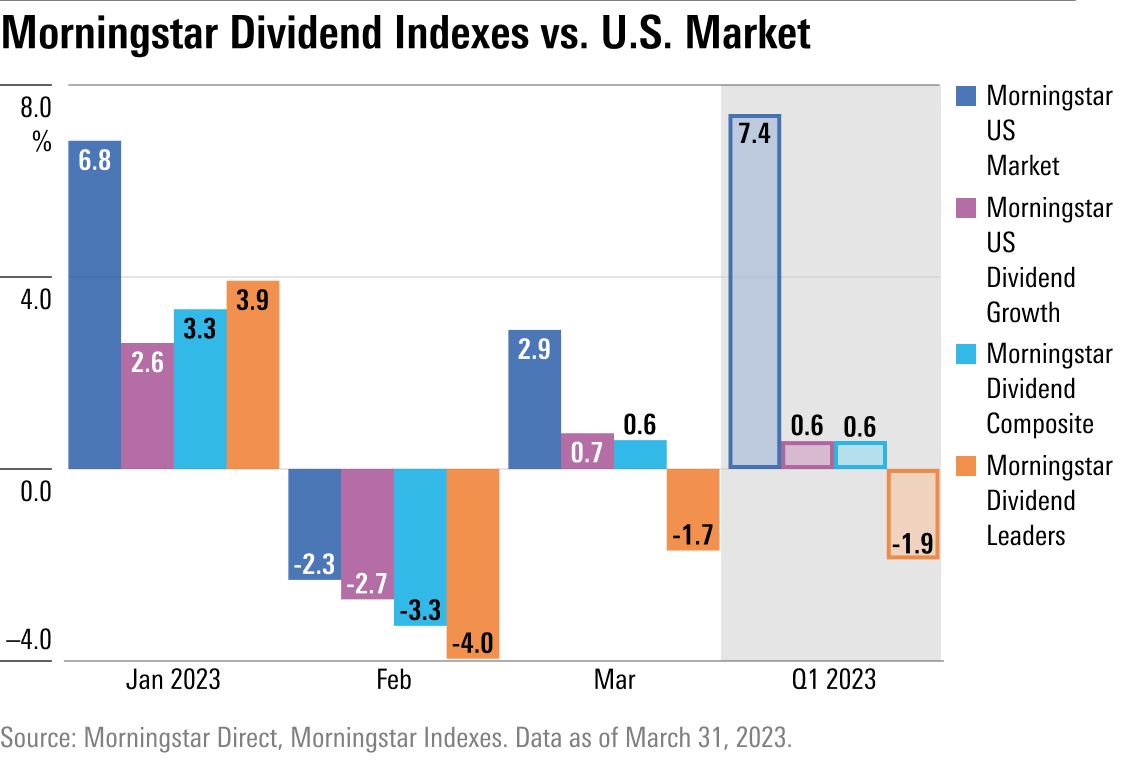
Dividend-Stock Performance
Against the backdrop of growth stocks faring better than value, dividend strategies lagged the market.
The Morningstar Dividend Composite Index—a broad measure of dividend stock performance—gained 0.6%, about 7 full percentage points behind the overall market.
The Morningstar Dividend Leaders Index—a collection of the 100 consistently paying, highest-yielding stocks—had a tough quarter, as it lost 1.9%. The dividend leaders index is composed of 78.9% value stocks and only 10.7% growth by weight (the remaining 10.4% is made up of “core” companies that display characteristics of both value and growth). In 2022, the dividend leaders group helped cushion the blows of the bear market, finishing the year with single-digit gains as nearly every other corner of the market saw big losses.
Among dividend-paying stocks, companies that have been growing their dividends over time fared better. The Morningstar Dividend Growth Index, which carries a much higher percentage of core- and growth-stocks compared with the dividend leaders index, gained 0.6% during the first quarter. The index was carried by Apple and Microsoft MSFT, which each ended the quarter with double-digit gains. The main detractors were Pfizer PFE—down 19.6%—and Johnson & Johnson JNJ, which fell 11.6%.
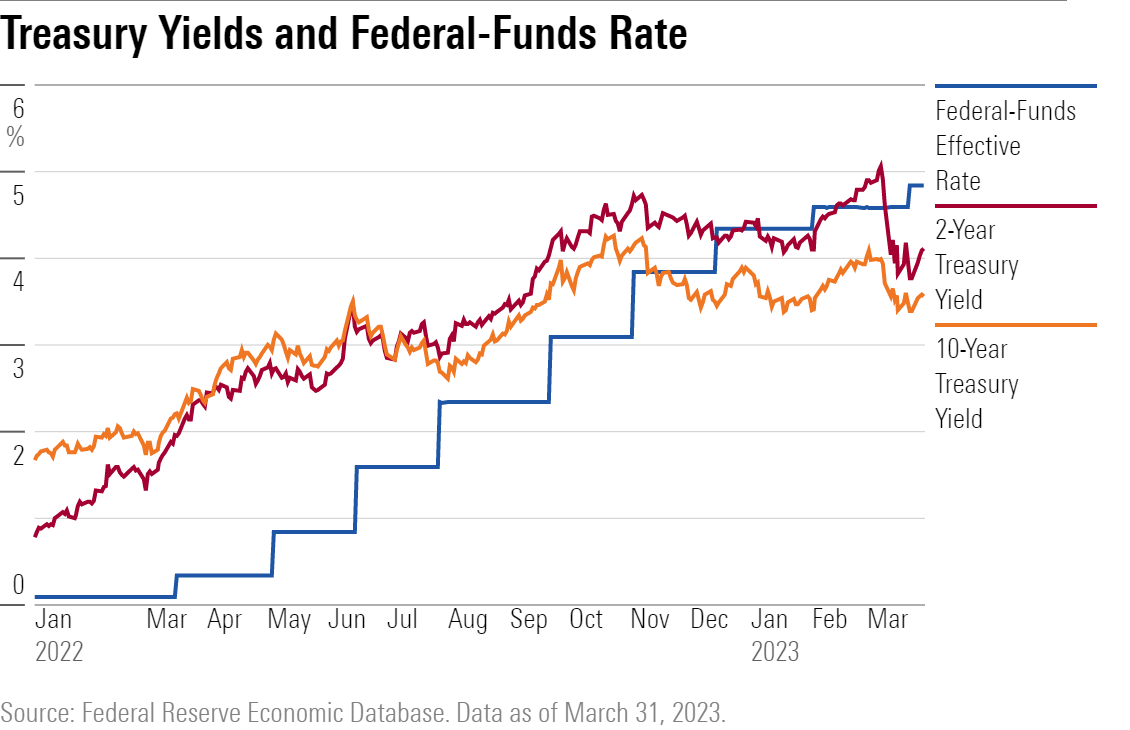
Changing Expectations for Fed Policy
Underlying the back and forth of sentiment in the stock and bond markets were significant swings in expectations for Fed policy. Investors started off the year believing that inflation pressures were coming under control, which could enable the Fed to end its interest-rate hikes by the second quarter and begin easing monetary policy by year-end.
However, by early February, a much stronger-than-expected jobs report, coupled with data showing inflation was remained stubbornly high, had investors rethinking the notion of a friendlier Fed. By early March, markets were braced for the Fed taking rates higher and keep them there longer.
However, the outlook changed practically overnight on March 9 with the collapse of Silicon Valley Bank. The crisis among regional banks sparked worries of a credit crunch that would slow economic growth, which in turn could take the pressure of the Fed to stop raising rates. The Fed validated this view at its March meeting, where it signaled that perhaps only one more rate hike was on its way in the wake of the banking crisis.
As the second quarter gets underway, the question facing the Fed and investors is whether the banking crisis will cause the kind of economic pain that sends the U.S. into a recession or if a soft landing remains in the cards.
Q1 2023 Bond Market Performance
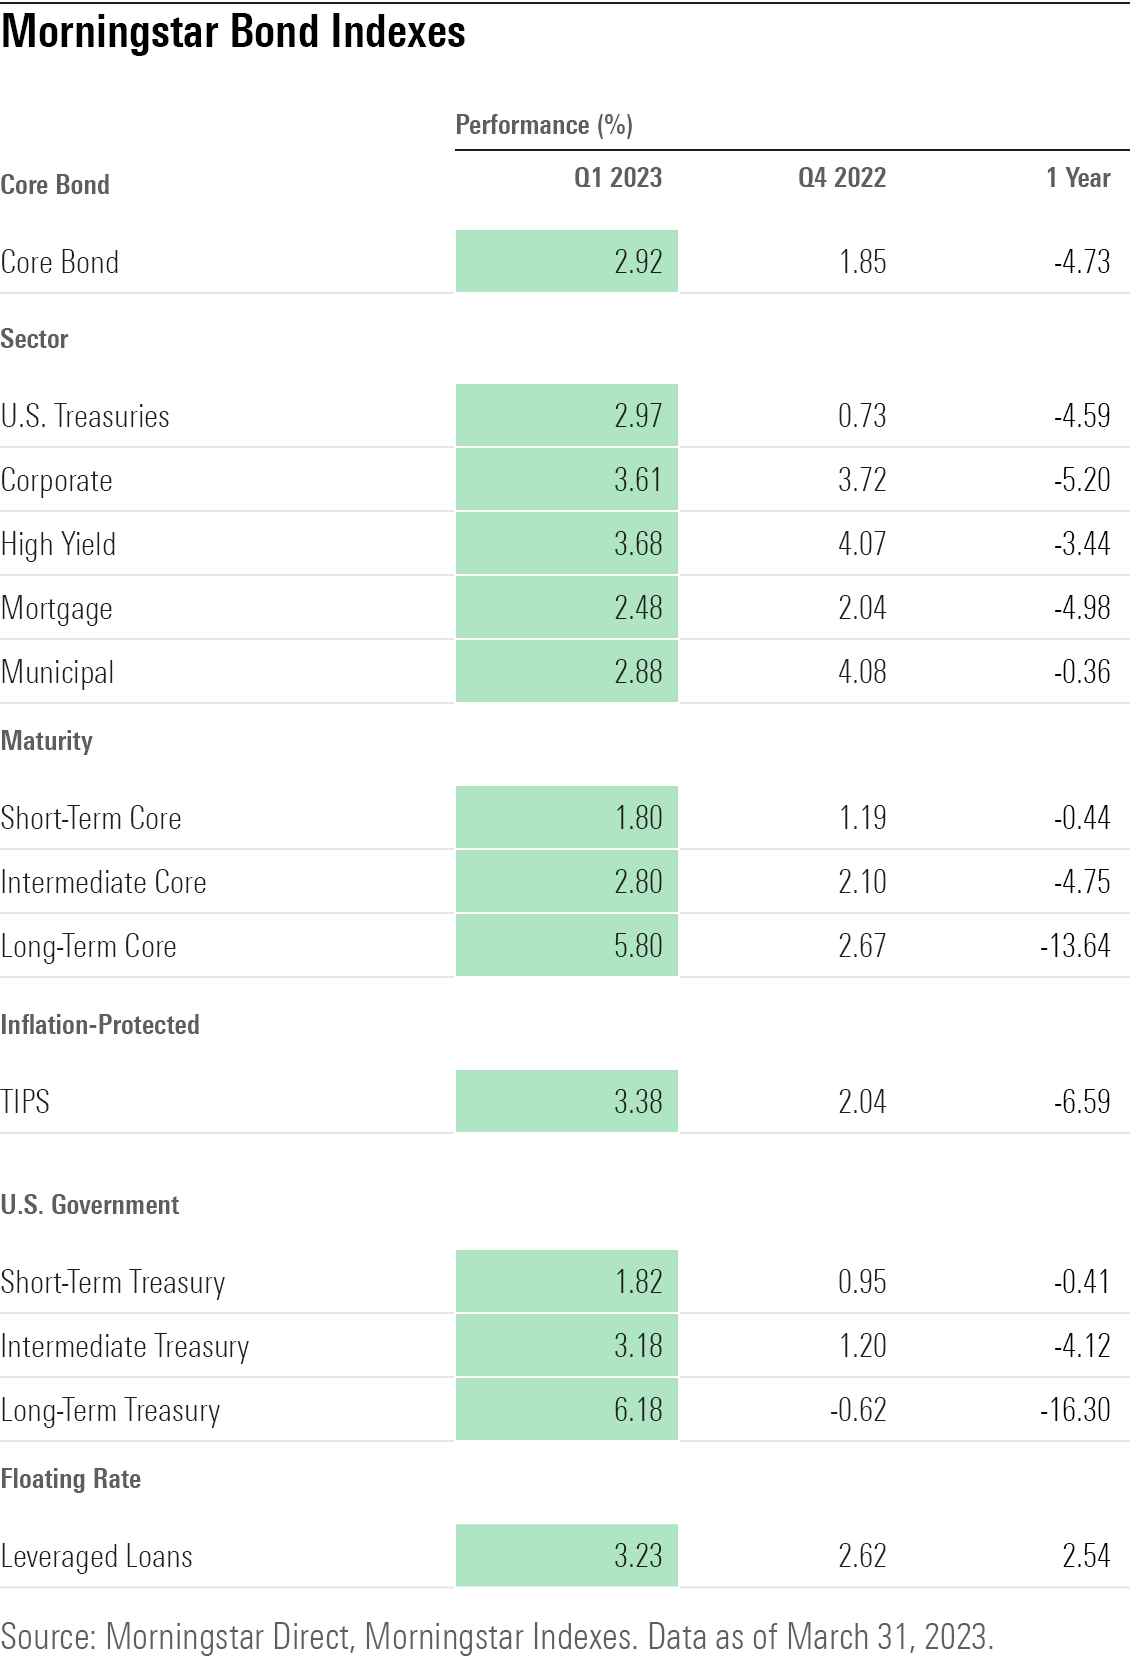
After one of the worst years in history for bonds in 2022, the bond market finished the first quarter back in positive territory as bonds of nearly all kinds posted positive returns.
However, in the wake of the banking crisis, the highest-quality bonds gained while lower-quality, higher-yield bonds lagged. A potential credit crunch could make it harder for borrowers to pay back debts, and lower-quality bonds carry the highest risk of default.
In March alone, the Morningstar US Treasury Bond Index—representing U.S. government bonds with the highest-quality credit ratings—gained 2.9% as investors rushed to safety.
Prior to early March, interest rates, as well as the outlook for the Fed, were the driving factor behind bond-fund returns over the past year. Long-term Treasury bonds—which are the most sensitive to changes in interest rates—fell the furthest in price in 2022 as the Fed raised interest rates at a breakneck pace. That dynamic for rates changed, however, as the Morningstar US 10+ Year Core Bond Index was the first quarter’s top performer.
Meanwhile, as credit concerns grew, the riskier, lower-quality Morningstar US High Yield Bond Index was a full 2 percentage points behind for the month of March and just over 2 percentage points behind the long-term core bond index for the quarter.
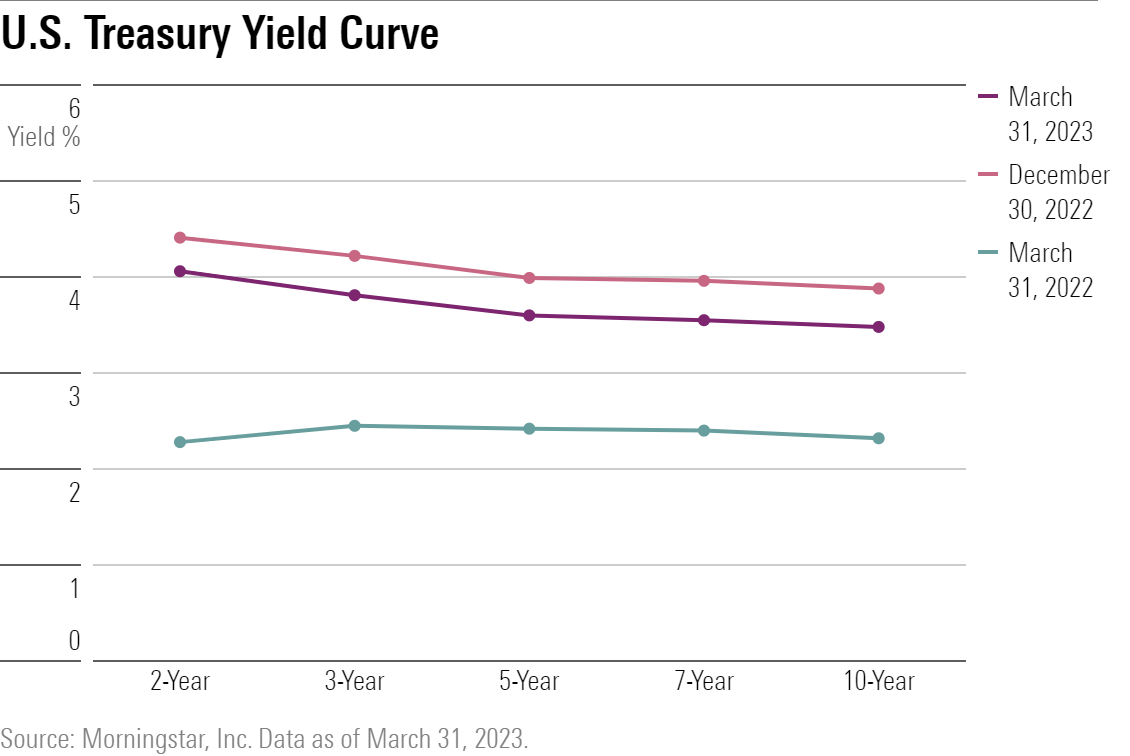
Treasury Yield-Curve Inversion
Although yields of all maturities have fallen slightly this year on expectations of weakening economic growth and an end to the Fed’s rate hikes, the yield curve remains inverted.
When short-term Treasury yields exceed long-term yields, it’s known as an inverted yield curve in Wall Street jargon. An inverted yield curve is a sign of investor pessimism about the economy and widely seen as a precursor to recession (not all yield-curve inversions lead to recessions, but historically all recessions have been preceded by an inversion of the yield curve).
Short-term yields ended the first quarter of 2023 well above long-term yields for the fourth quarter in a row. The gap between the yield on the two-year note and the 10-year note reached a high of 1.07 percentage points on March 8, its biggest inversion since 1981.
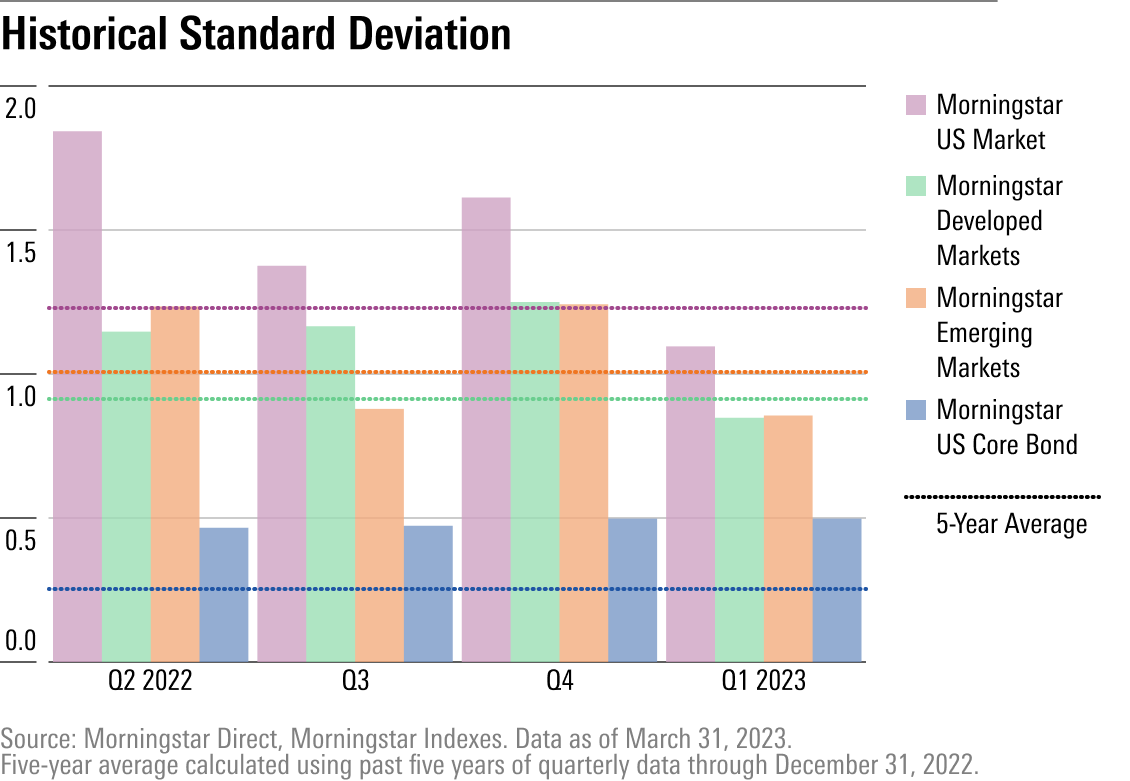
Stock and Bond Market Volatility
Bond prices continued to post wide swings during the first quarter, while volatility eased among stocks.
Volatility in the bond market has remained at twice its historical level over the past four quarters, a notable occurrence for a market that most investors look to for stability.
The bond market was whipsawed by both the back-and-forth swings in Fed interest-rate expectations over the quarter and the ripples from the collapse of Silicon Valley Bank. The banking crisis sparked both a massive flight to quality in the Treasury market—where prices soared—and worries about credit-sensitive bonds.
The stock market, where many investors now appear to be less worried about the banking crisis, has had a more muted response, and expectations for Fed rate cuts this year have damped price swings.
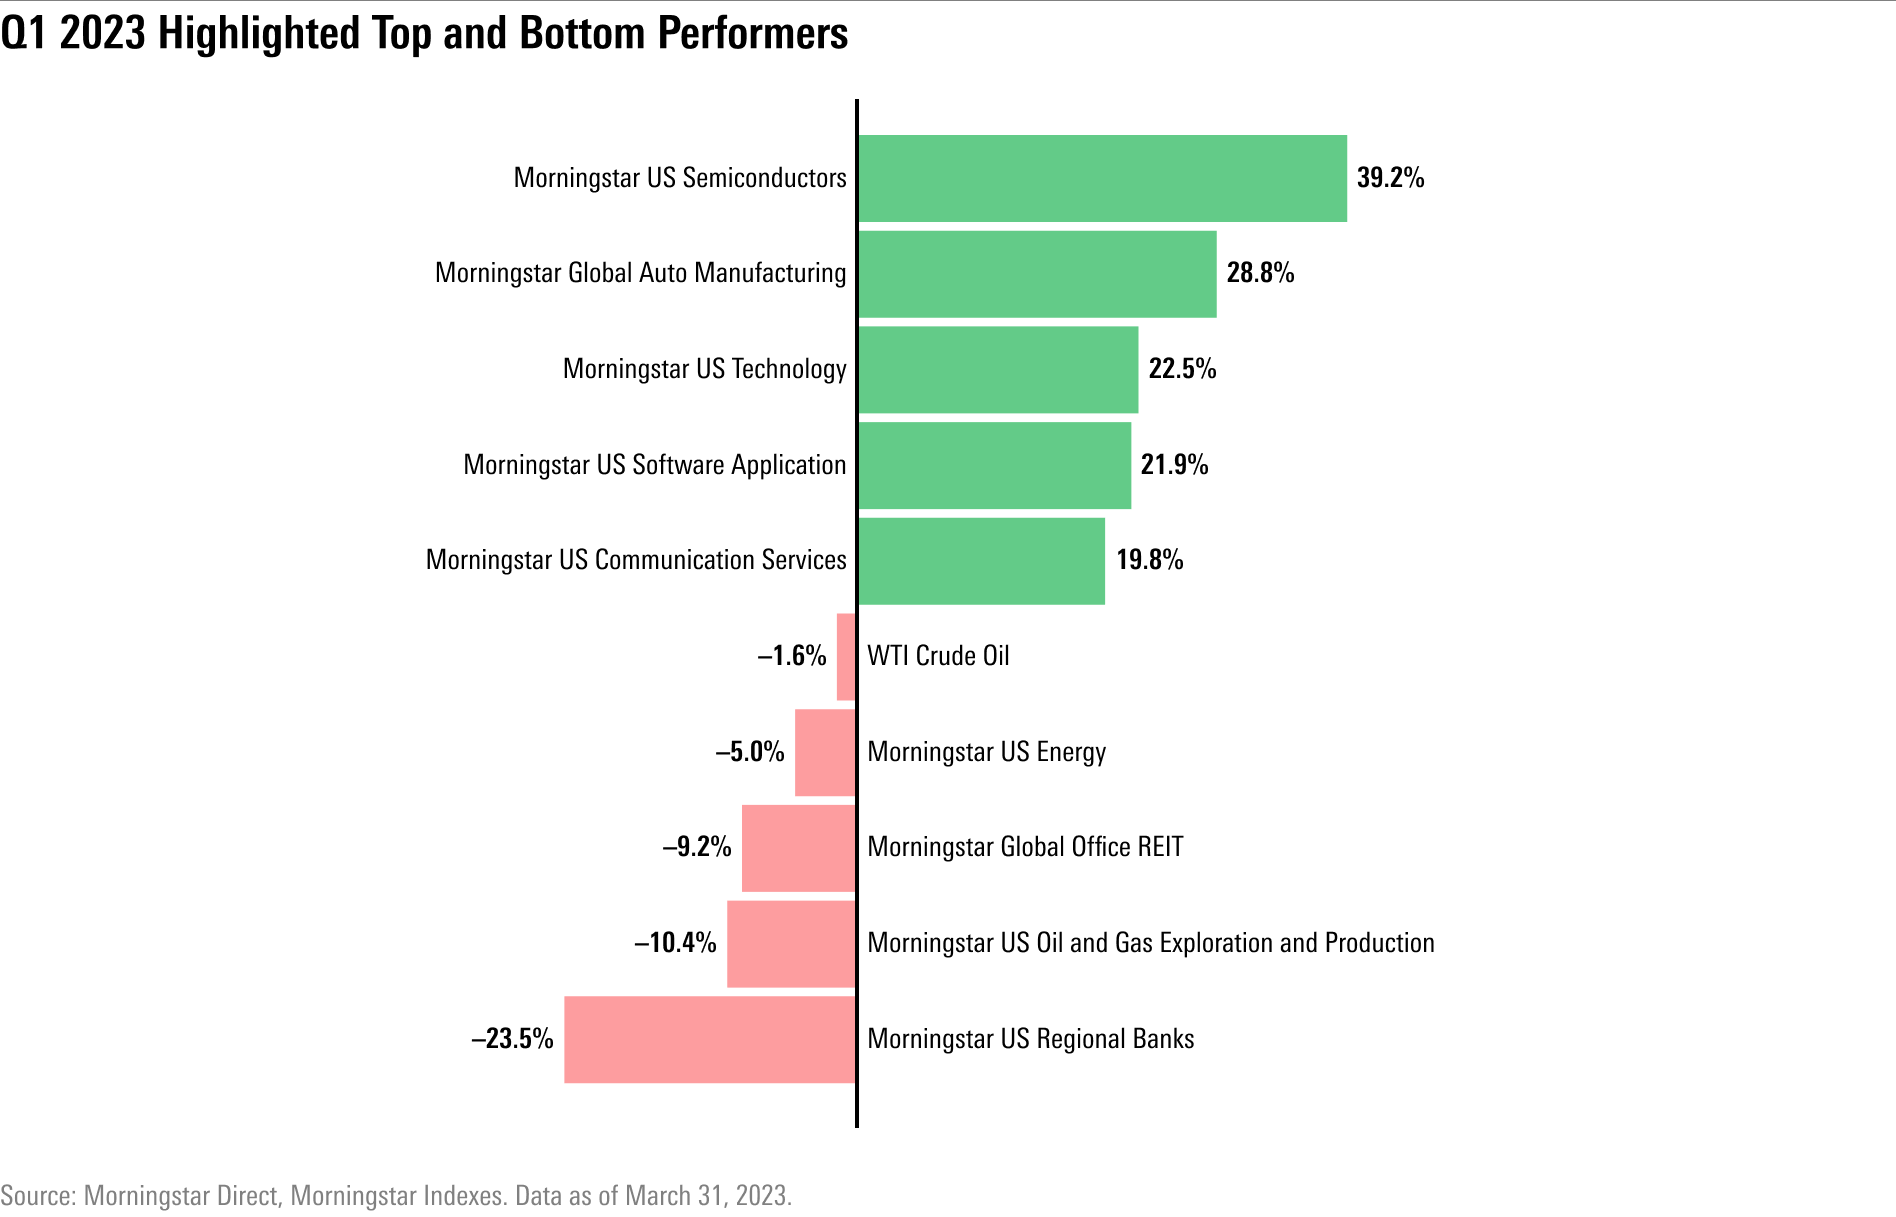
Top and Bottom Market Performers of Q1 2023
Recession fears drove the losses behind the market’s bottom performers in the first quarter.
The Morningstar US Banks-Regional Index fell the furthest of all of Morningstar’s U.S.-based indexes after the failures of two banks and the rescue of another. The health of the banking system is critical to the health of the economy.
Real estate investment trusts, commonly known as REITs, also got caught up in the wave of the banking fear as investors worried that the dividend-paying companies could get squeezed by tenants, lenders, or both.
Among top performers, high-tech, high-growth indexes were the leaders in the first quarter of 2023. The Morningstar US Semiconductors Index rose 39.2%, led by Nvidia and Advanced Micro Devices AMD. The Morningstar US Technology Index was the top performer of all U.S. equity sectors, with the communication services sector index following close behind.
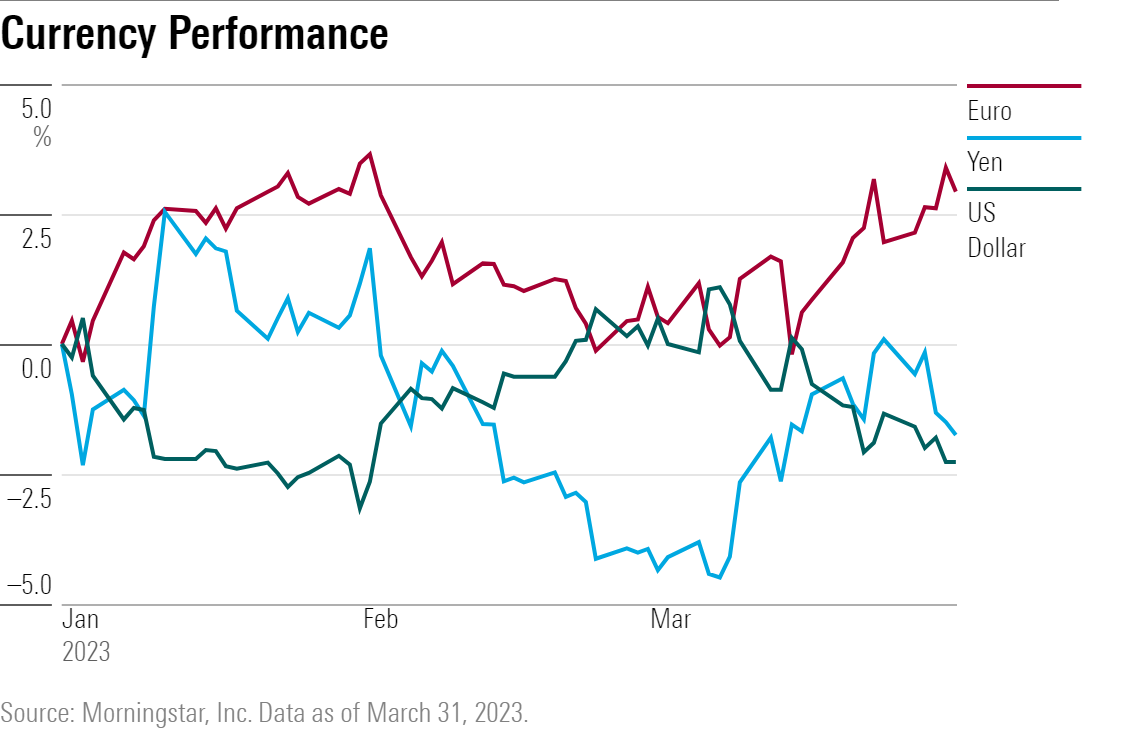
Currency Market Performance
After a big rally in 2022, the U.S. dollar started the year on a weak note, then rallied again in February as investors rethought the idea that the Fed was going to be cutting interest rates. After March 9, though, the dollar fell again on investor fears sparked by the collapse of Silicon Valley Bank.
Meanwhile, the euro strengthened during this quarter as the European Central Bank raised interest rates.
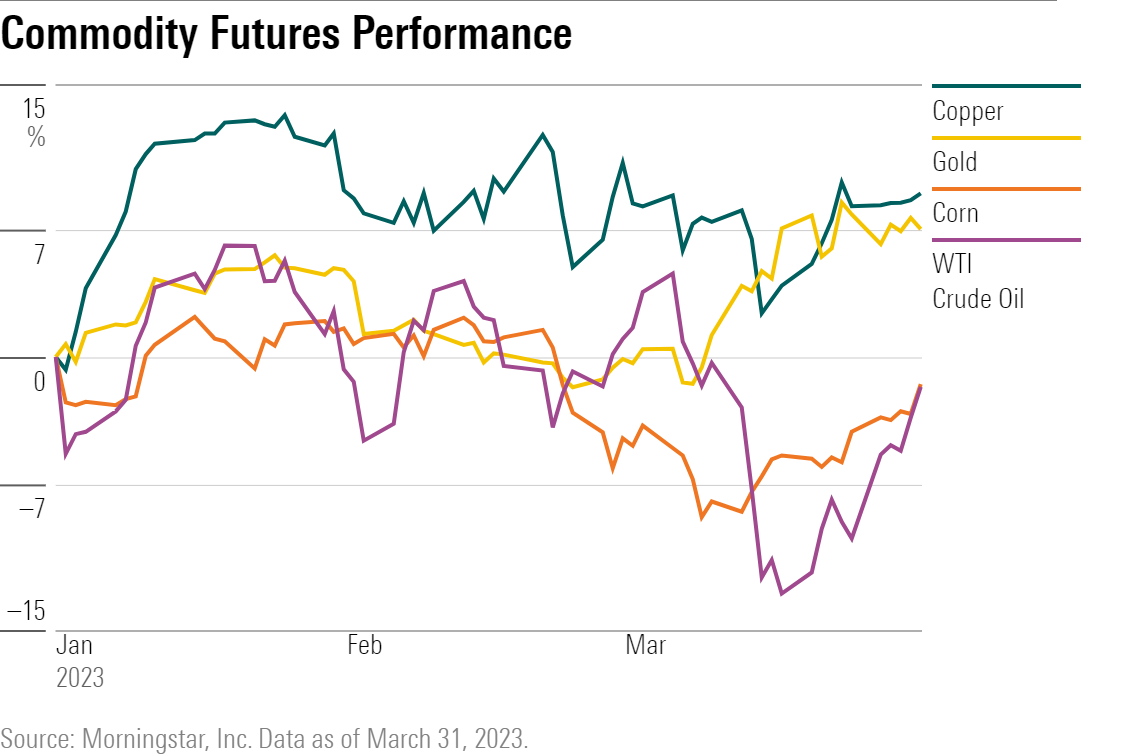
Commodity Market Performance
Commodities gave mixed signals about the economy to investors in the first quarter of 2023.
Oil futures prices sank on worries about the strength of the U.S. economy. Think gas usage: During a recession, people spend less and travel less, so oil demand falls.
At the same time, though, copper prices rose during the first quarter. Copper is seen as a bellwether for the global economy, as it is a common input for equipment and products in a wide range of industries. Copper futures ended the first quarter up nearly 9% after spending most of 2022 in negative territory.
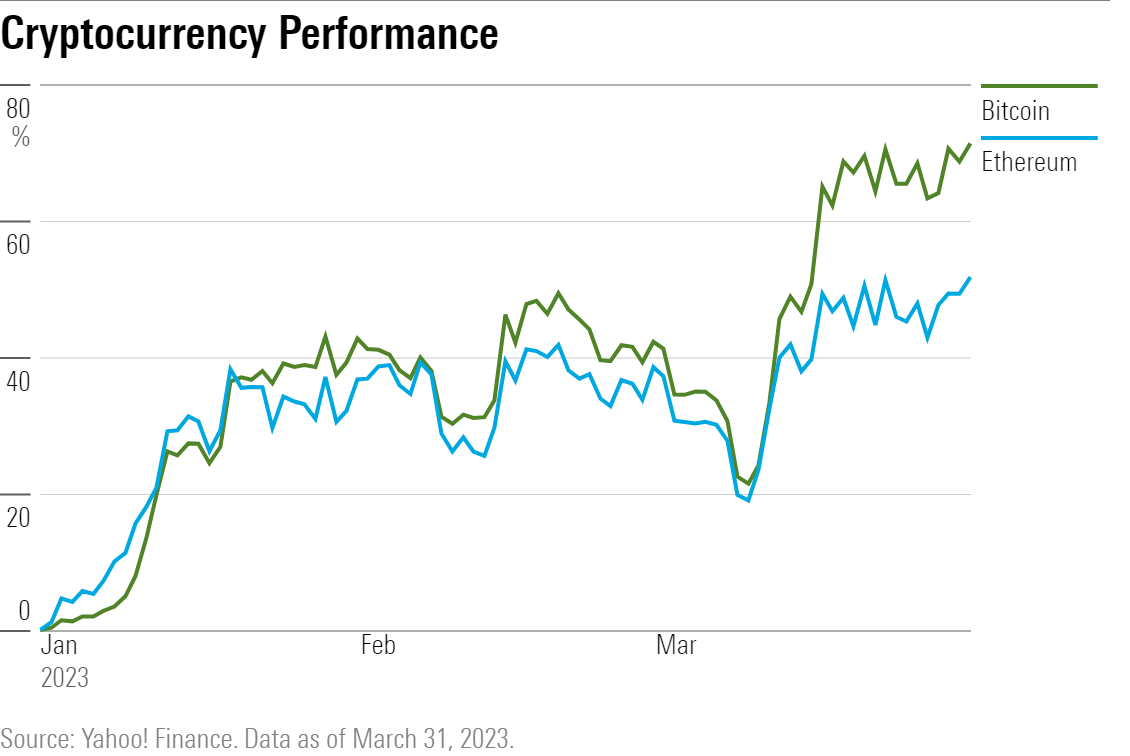
Cryptocurrency Performance
After plummeting in 2022, major cryptocurrencies weathered continued crises in the industry and rose substantially during the first quarter of 2023.
The two largest cryptocurrencies, bitcoin BTC-USD and ethereum ETH-USD, each ended the quarter up roughly 50%. The gains came even as the ripples continued from the collapse of crypto-exchange FTX, the shuttering of crypto-bank Silvergate Capital, and the bankruptcy-protection filing of cryptocurrency lender Genesis.
Shortly after the bank-stock selloff sparked by Silicon Valley Bank’s liquidity crunch, bitcoin briefly traded above $28,000 for the first time since June 2022, driven up by investors who believe in cryptocurrency as an alternative to traditional banking.
But from year-ago levels, bitcoin is down 29.8% and ethereum is down 35.8%.
The author or authors do not own shares in any securities mentioned in this article. Find out about Morningstar’s editorial policies.
/cloudfront-us-east-1.images.arcpublishing.com/morningstar/T5MECJUE65CADONYJ7GARN2A3E.jpeg)
/cloudfront-us-east-1.images.arcpublishing.com/morningstar/VUWQI723Q5E43P5QRTRHGLJ7TI.png)
/d10o6nnig0wrdw.cloudfront.net/04-22-2024/t_ffc6e675543a4913a5312be02f5c571a_name_file_960x540_1600_v4_.jpg)
:quality(80)/s3.amazonaws.com/arc-authors/morningstar/ba63f047-a5cf-49a2-aa38-61ba5ba0cc9e.jpg)