
How Large Will Losses Be in Commercial Real Estate?
Here’s what it could mean for the banking sector.
/s3.amazonaws.com/arc-authors/morningstar/e03383eb-3d0b-4b25-96ab-00a6aa2121de.jpg)
/s3.amazonaws.com/arc-authors/morningstar/06b2be46-9454-4b31-8c0e-7e13c47e080c.jpg)

There will be losses stemming from commercial real estate, or CRE, portfolios for US banks, but they will be manageable for our coverage.
We think New York Community Bancorp NYCB was uniquely risky and would have been highlighted as such by our risk screens.
Rather than a real estate apocalypse, we see a small to medium drag on earnings for several of the banks we cover, and potentially a larger drag for Zions ZION in particular. However, we think every one of our banks will emerge from this pressure intact.
As certain market participants remain worried about CRE risks, understanding how to sort and size these risks is paramount. We think any increased pessimism that is at least partially based on CRE loss content could present opportunities for patient investors.
How Large Will Losses Be in Commercial Real Estate?
The four primary sectors within commercial real estate include industrial (which primarily represents warehouses and manufacturing facilities), multifamily (which represents housing units that accommodate more than one family, primarily apartment complexes), retail, and offices.
Our analysis shows:
- Industrial’s fundamentals are great, with strong demand and low vacancy rates, and we do not anticipate any major stress.
- Retail, while not as strong as industrial, should remain relatively stable due to less of a dramatic demand drop and supply that has been adjusting for over a decade.
- We would keep an eye on multifamily, particularly in the Southeast, as we think overbuilding combined with higher interest rates (that is, higher funding costs/lower property values) will put stress on some properties. However, the lack of a dramatic demand shock makes us predict the pain here will be limited.
Office is where the real pain is, and we think it will get worse before it gets better. There has been a structural demand shock that will take years to work its way through the system, as we are in year four of what will likely be a six- to seven-year process.
The pandemic massively accelerated the remote work trend and created a real structural drop in demand for office property. A significant proportion of the US workforce has now worked remotely for over three years, and we do not think it is ever going back to the way it was before the pandemic. Hybrid work has become a norm in corporate America, and most employers in the US now offer some form of it.
The impact of the hybrid-work-related disruption can be seen in office real estate fundamentals like vacancy rates, net absorption, and rental rates. All have deteriorated, and we expect additional deterioration as more companies in the US shrink their overall office footprint. We estimate that average quarterly office leasing volume has declined over 30% to around 39 million square feet compared with 59 million square feet prepandemic.
Office leasing volume recovered steadily until the second quarter of 2022, after falling sharply in the early stages of the pandemic, but the recovery reversed over the past year as more companies started to rethink their long-term office requirements.
Office Leasing Volume Recovered Until Mid-2022 but Has Been Under Pressure in Recent Quarters
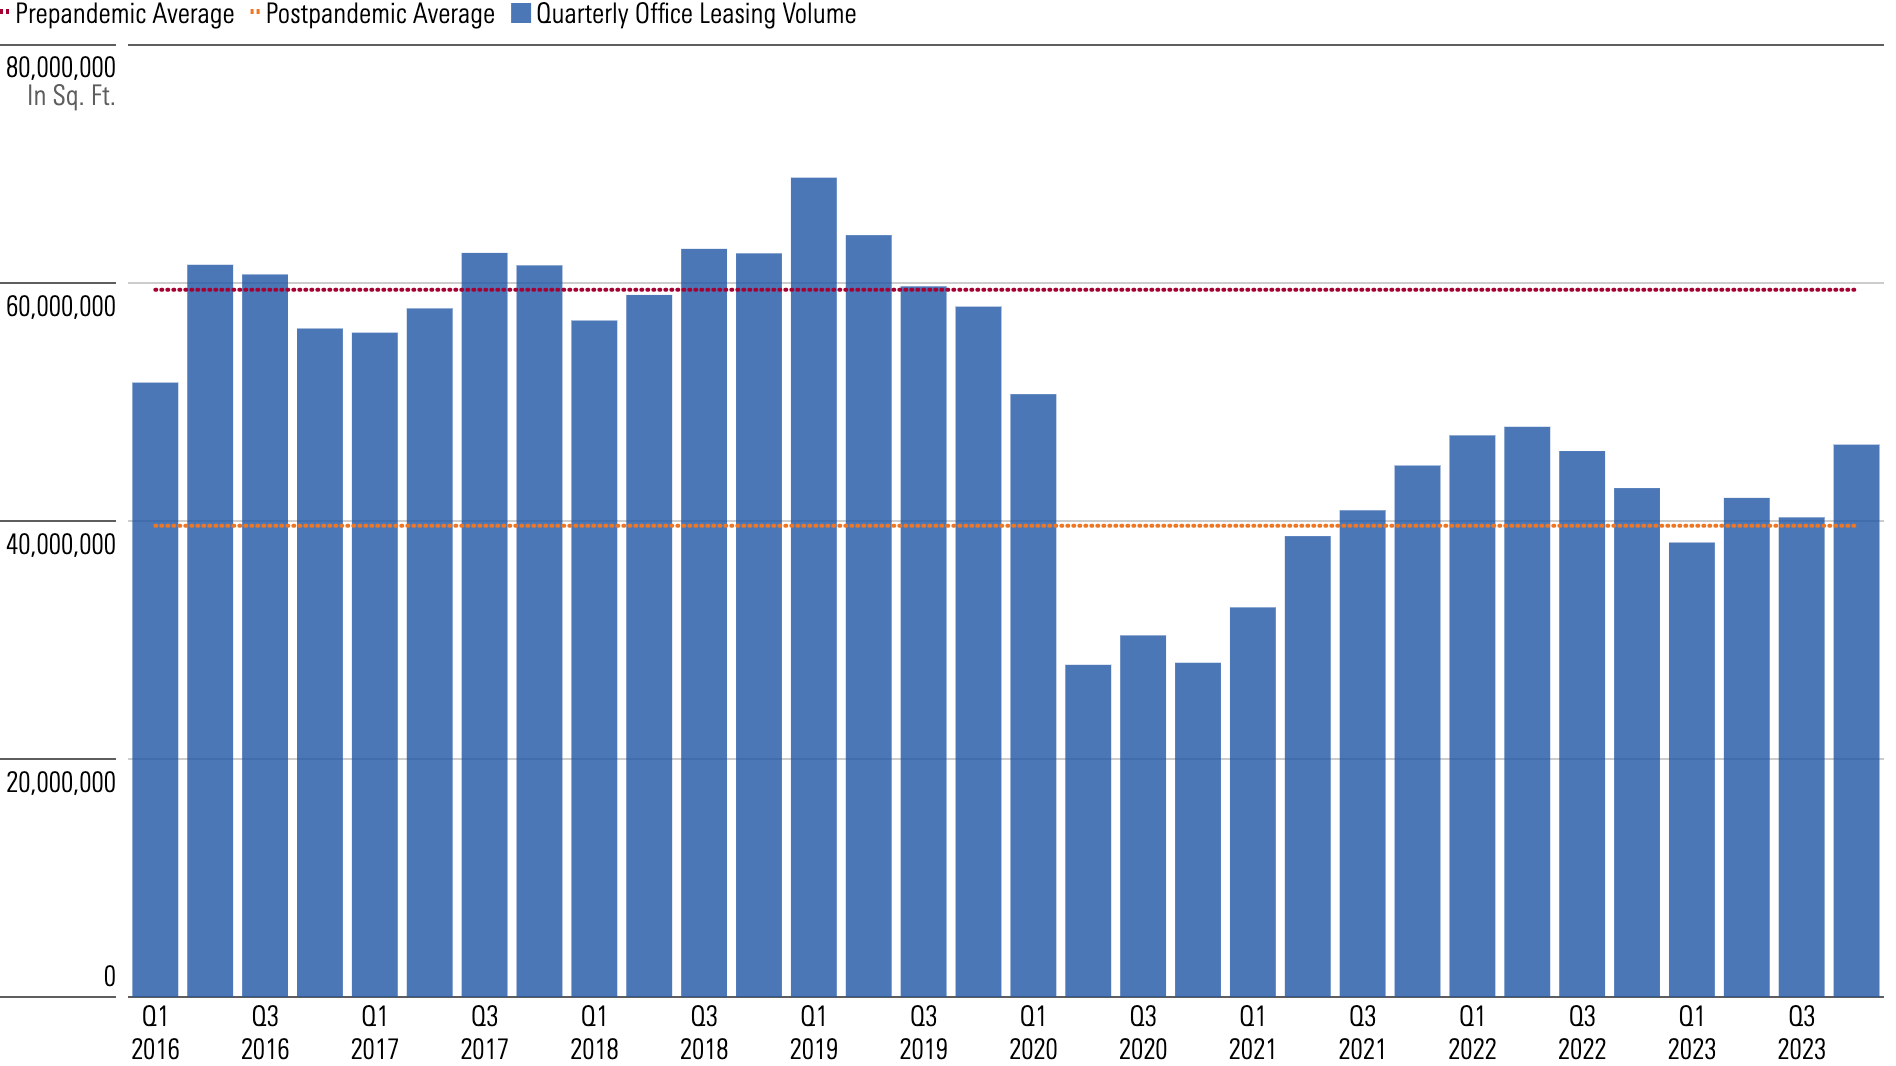
The decline in office leasing volume has been broad-based across industries over the past year. Even sectors like tech, which were the bright spots in 2021 and the early months of 2022, have deteriorated, showing the strongest drawdowns in office leasing volume more recently.
A decline in office utilization rates, down roughly 50%, has led to a decline in demand, with companies reducing their square footage needs, leading to lower leasing volume and therefore higher vacancy rates. And the supply side is reacting, with new office construction dropping to almost zero.
Difficult Office Market Has Caused Construction Groundbreakings to Almost Dry Up
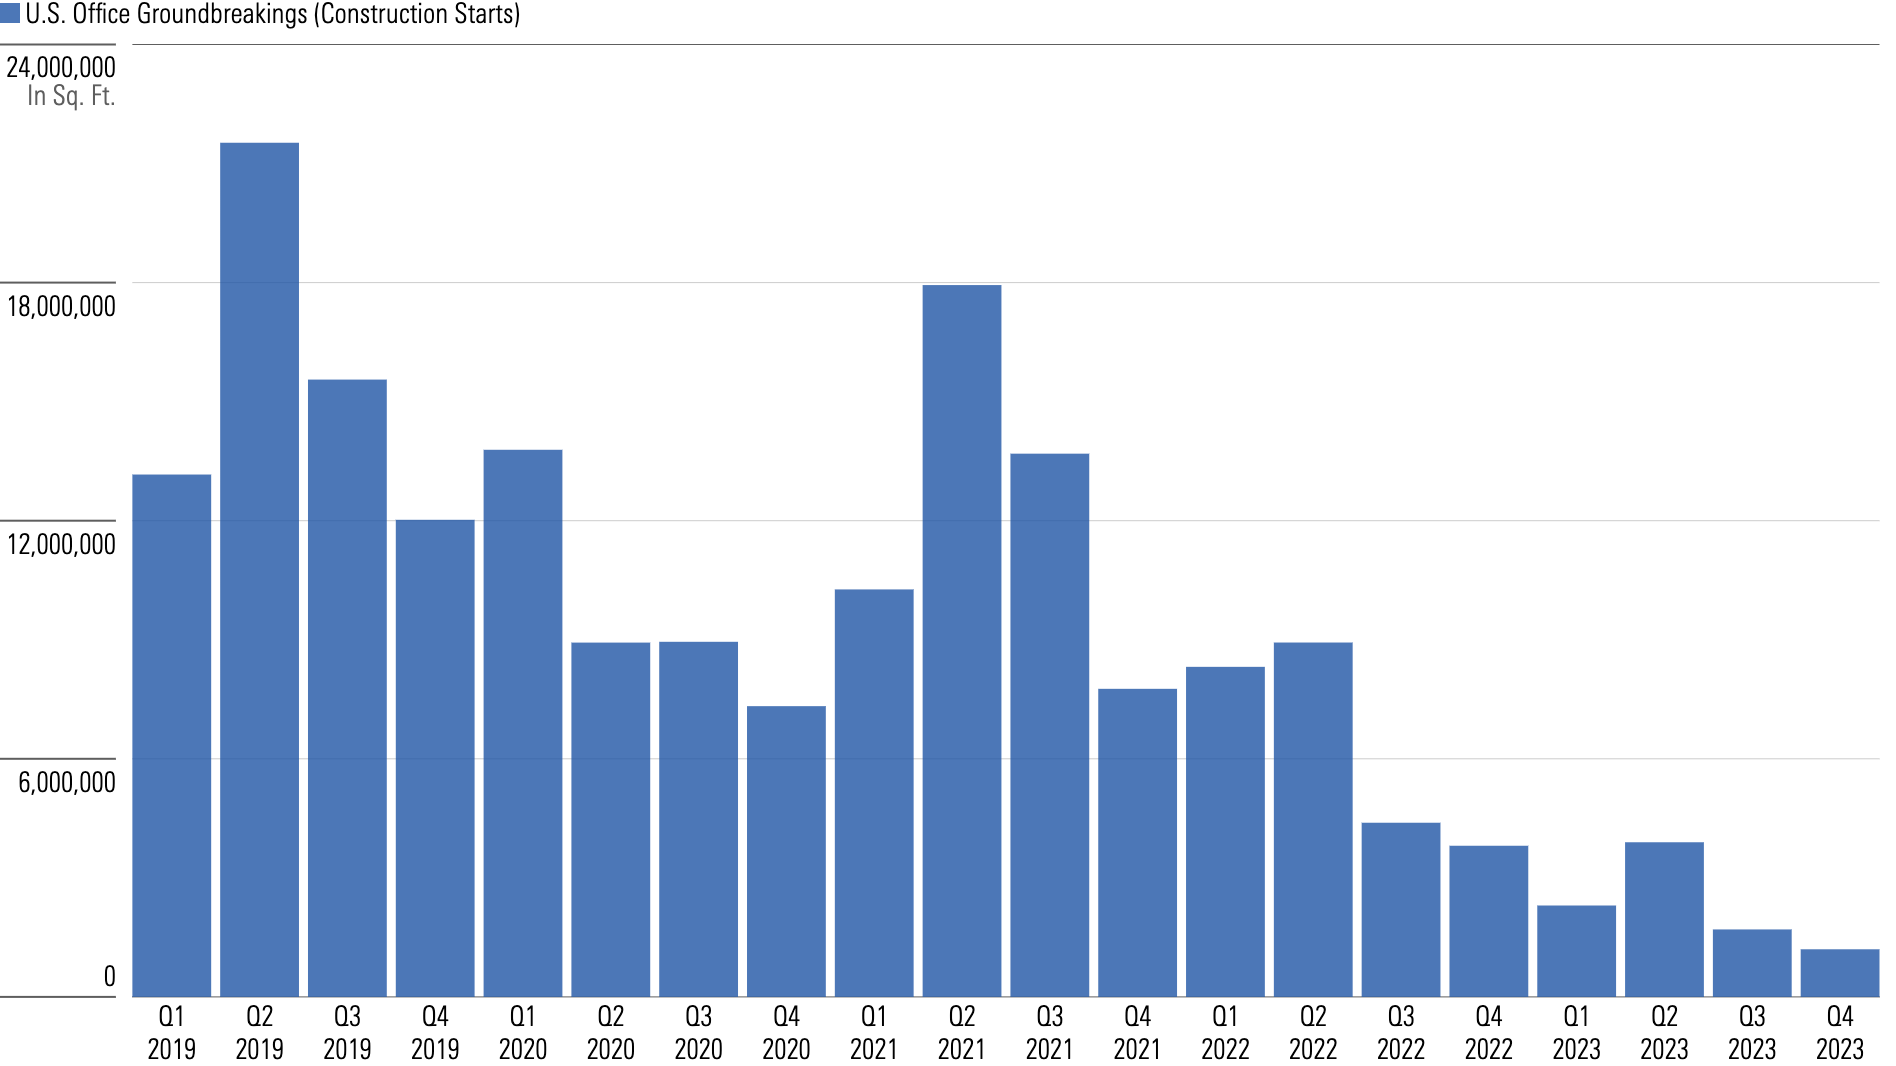
While we think muted supply-side additions will eventually help the office sector reach a more stable equilibrium in the distant future, for now, the demand-side shock is the key factor. There is simply no way to adjust on the supply side for such a drastic decline in demand. Property values will remain under pressure in upcoming years.
What This Means for the Banking Industry
All that said, what can we expect for the banking sector—the largest holder of CRE-related debt?
US Banking Sector Has an Estimated $1.76 Trillion Exposure to Commercial Real Estate Loans
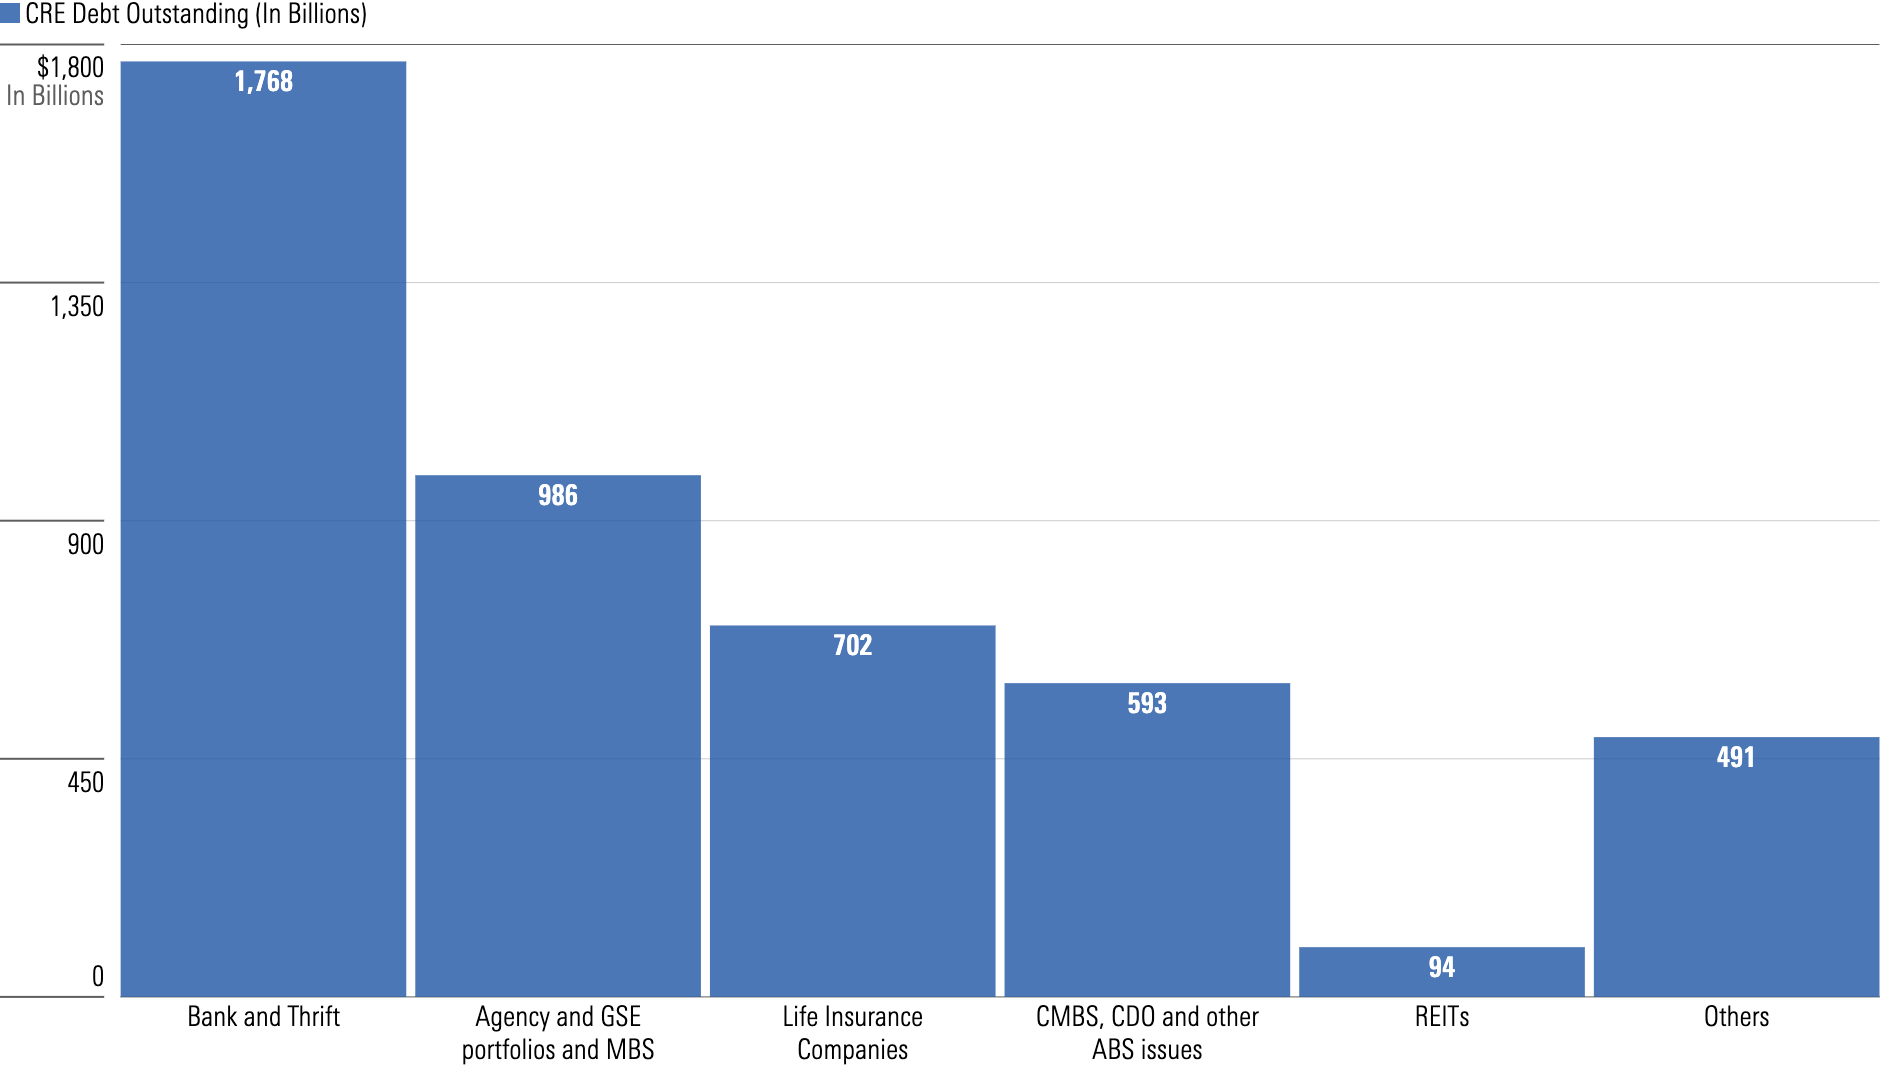
- Banks have already built up sizable reserves, particularly for their most risky portfolios (often 8% or more for office loans). Generalists often miss that this already accounts for material stress in the sector (default rates of over 20% and property value declines of over 50%).
- Not all banks are exposed equally to CRE. NYCB is a case in point. It had close to double the relative CRE exposure of the most exposed bank under our coverage (Zions) and more than 10 times the exposure of the least exposed banks under our coverage. Much of this exposure was to rent-controlled multifamily in New York City, one of the worst multifamily markets since regulations changed in 2019. None of the banks we cover are comparable. Investors must know how to sort through these risks.
- CRE exposure is heavily concentrated in smaller banks with less than $10 billion in assets. We would not be surprised if there are some bank failures here. However, even under a bear case (CRE losses greater than the 2008 financial crisis, particularly for office properties), we don’t anticipate any of the banks under our coverage to face serious capital risks.
We find that generalists are not digging into these details.
The whole sector tends to sell off when CRE risks are front of mind, such as immediately after news of NYCB’s struggles hit. We think times of heightened risk sentiment related to CRE can offer opportunities for cheaper valuations.
As the market better digests potential CRE risks, we think some of the risk premium that banks are experiencing will fade. Therefore, current holders should not panic, and watchers of M&T Bank MTB and Zions should be ready: These banks can go through periods of higher CRE risk discounts, offering opportunities.
The table below shows how, even in a bear case, these banks’ anticipated CET1 ratios (which measures a bank’s capital against its assets) still exceed the regulatory minimums.
| Bank | CET1 Ratio Development Under Bear Case - 2024 | CET1 Ratio Development Under Bear Case - 2025 | CET1 Ratio Development Under Bear Case - 2026 | 2026 CET1, Assuming Fully Phased in AOCI | CET1 Regulatory Minimum | Difference |
|---|---|---|---|---|---|---|
| JPMorgan Chase JPM | 17.3% | 18.7% | 20.2% | 20.2% | 11.9% | 8.3% |
| Bank of America BAC | 13.0% | 13.9% | 15.0% | 15.0% | 10.0% | 5.0% |
| Citigroup C | 12.9% | 13.3% | 13.9% | 13.9% | 12.3% | 1.6% |
| Wells Fargo WFC | 12.7% | 13.7% | 14.9% | 14.9% | 8.9% | 6.0% |
| U.S. Bancorp USB | 10.8% | 11.4% | 12.2% | 11.4% | 7.0% | 4.4% |
| PNC PNC | 10.8% | 11.4% | 12.1% | 11.5% | 7.0% | 4.5% |
| Truist TFC | 10.5% | 11.0% | 11.7% | 10.7% | 7.4% | 3.3% |
| Fifth Third Bancorp FITB | 11.1% | 11.5% | 12.1% | 11.1% | 7.0% | 4.1% |
| M&T Bank Corporation MTB | 12.2% | 12.8% | 13.5% | 13.4% | 8.5% | 4.9% |
| KeyCorp KEY | 10.3% | 10.7% | 11.3% | 10.1% | 7.0% | 3.1% |
| Regions Financial Corporation RF | 11.4% | 12.2% | 13.0% | 12.2% | 7.0% | 5.2% |
| Comerica Incorporated CMA | 11.3% | 11.5% | 11.8% | 10.5% | 7.0% | 3.5% |
| Zions Bancorporation ZION | 10.5% | 10.6% | 10.8% | 9.4% | 7.0% | 2.4% |
The author or authors do not own shares in any securities mentioned in this article. Find out about Morningstar’s editorial policies.
/cloudfront-us-east-1.images.arcpublishing.com/morningstar/TP6GAISC4JE65KVOI3YEE34HGU.jpg)
/d10o6nnig0wrdw.cloudfront.net/04-29-2024/t_d0e8253d77de4af9ae68caf7e502e1bf_name_file_960x540_1600_v4_.jpg)
/cloudfront-us-east-1.images.arcpublishing.com/morningstar/YTLLJ3VT4NFZTCTDNZPCUR27D4.jpg)
:quality(80)/s3.amazonaws.com/arc-authors/morningstar/e03383eb-3d0b-4b25-96ab-00a6aa2121de.jpg)
:quality(80)/s3.amazonaws.com/arc-authors/morningstar/06b2be46-9454-4b31-8c0e-7e13c47e080c.jpg)