
Why Investors Should Keep An Eye on Small-Cap Stocks
Historically, high index concentration implies high expected size premium.
/s3.amazonaws.com/arc-authors/morningstar/8c5d95ea-6364-418e-82fc-473134024ece.jpg)

The 2023 performance of the “Magnificent Seven”—Apple AAPL, Amazon.com AMZN, Microsoft MSFT, Nvidia NVDA, Alphabet GOOG, Tesla TSLA, and Meta Platforms META—has been nothing short of spectacular, leading to the increased concentration of marketlike portfolios. Increasing concentration reduces the benefits of diversification and increases a portfolio’s exposure to idiosyncratic risks. While market-cap-weighted indexes, by their nature, will always have some concentration of risk in the largest stocks, thanks to the research team at Avantis, we can see that concentration levels for the 10 largest stocks in several common indexes are now at historic highs.
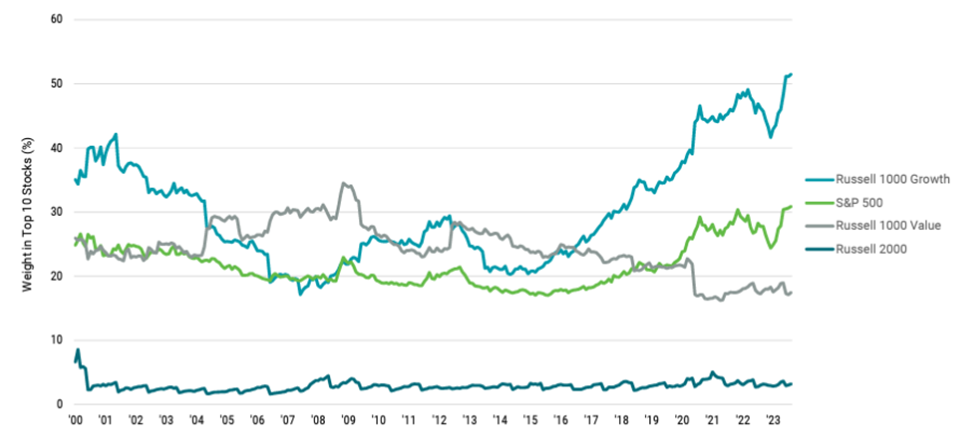
The following chart from Avantis shows that concentration levels have increased dramatically in recent years, while the levels for the smaller-cap and value indexes have been relatively stable. Note also that they are now significantly higher for the Russell 1000 Growth and S&P 500 indexes than they were before the dot-com bubble burst in March 2000. On the other hand, the concentration levels for the Russell 2000 and the Russell 1000 Value indexes are at or near their lowest levels.
U.S. Large Cap and Large Growth Index Concentration Has Been on the Rise
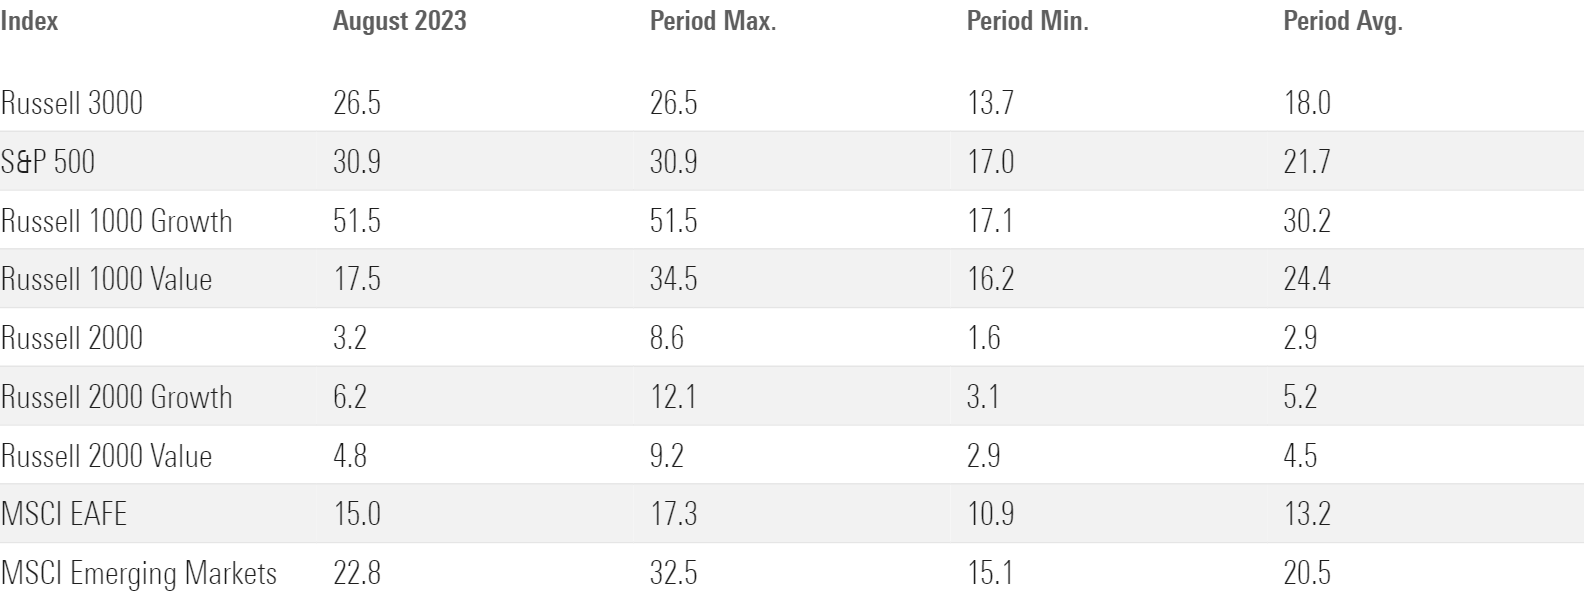
The next table shows the historical concentration levels for various indexes, including their minimum, maximum, and average concentration levels.
Concentration Levels of 10 Top Holdings (Jan. 31, 2000-Aug. 31, 2023)
The Size Premium
What, if any, are the implications of the increased level of concentration beyond the obvious increase in risks to idiosyncratic shocks? Logan Emery and Joren Koëter, authors of the November 2023 study “The Size Premium in a Granular Economy,” investigated how this phenomenon affects the difference in returns between small and large firms—the size premium. They began by noting that recent prior research found that concentrated stock markets dominated by a small number of very successful firms are associated with less efficient capital allocation, sluggish initial public offering and innovation activity, and slower economic growth.
Emery and Koëter hypothesized: “If stock market concentration implies that too little capital is allocated to small firms, the decreased demand for the equity of small firms will increase their expected returns. This capital allocation effect suggests that higher stock market concentration should increase the expected [ex-ante] size premium.”
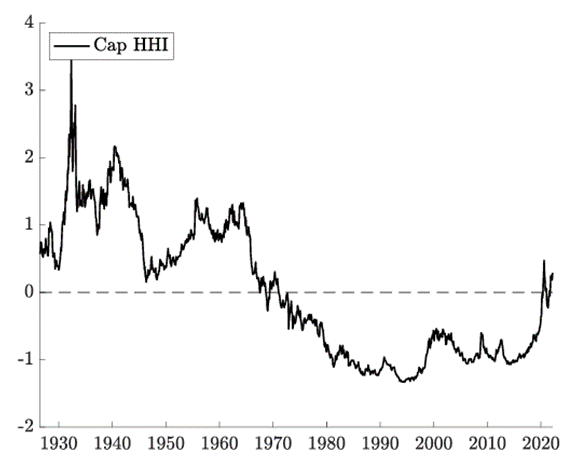
They measured market concentration using the Herfindahl-Hirschman Index. Their sample covered U.S. stocks over the period 1926-2021. Following is a summary of their key findings:
- The stock market was significantly more concentrated before 1970 than it has been in the past several decades. However, it has increased substantially in recent years to levels not seen since the early 1970s.
Stock Market Concentration
- The expected size premium (the difference in returns between the first and fifth quintiles) increased during periods of higher stock market concentration. A one-standard-deviation increase in stock market concentration increased the expected returns of small firms by 9.4 percentage points per year and decreased the expected return of the largest firms by 0.83 percentage points per year—most of the effect was caused by the small firms. The effect was statistically and economically significant in both the earlier (1926-85) and later (1985-2021) sample periods.
- The average size premium was 6.33% per year over the period 1926-2021. Given that a one-standard-deviation increase in stock market concentration increased the expected returns of small firms by 9.4 percentage points per year, a one-half standard deviation decrease in concentration would cause the size premium to vanish.
- Smaller firms are less likely to complete a seasoned equity offering during periods of higher stock market concentration.
- The increase of the size premium during these periods took place predominantly among firms with a greater demand for equity financing—the effect was concentrated among growth firms (but not value firms) and firms in industries with a greater dependence on external equity financing.
- Higher stock market concentration was associated with smaller firms receiving less investor attention as measured by turnover, analyst coverage, and downloads of firm financial information.
Their findings led Emery and Koëter to conclude: “These results suggest there is less demand for the equity of smaller firms during periods of higher stock market concentration, which makes it more difficult for these firms to raise equity financing and increases their expected returns.”
Interestingly, Emery and Koëter found a countereffect caused by concentration. They calculated the value-weighted idiosyncratic shocks to the 10 largest firms as a shock to the granularity (unique/idiosyncratic risk) of the stock market. They found:
“Positive shocks further tilt the market portfolio toward these largest firms such that investors required additional compensation for the increased exposure to the idiosyncratic risk of these firms. Moreover, investors become willing to pay a premium for other firms to diversify this increased idiosyncratic risk. Taken together, these effects create a discount in the value of large firms and a premium in the value of small firms, which result in lower and higher expected returns going forward, respectively. ... The expected size premium [using the cap HHI] decreases by 0.77 percentage points per quarter following a one standard deviation increase in idiosyncratic shocks to the ten largest firms. ... This result supports the conclusion that the capital allocation and granular diversification effects are simultaneously present.”
However, they concluded that there was evidence of the granular diversification effect “but find it is dominated by the capital allocation effect overall.”
Their findings led Emery and Koëter to conclude: “It is important to account for stock market concentration when evaluating the size premium over different sample periods.”
Investor Takeaways
The empirical evidence demonstrates that as the stock market concentration level increases, the expected return to small stocks relative to large stocks (the size premium) increases. Investors should note that, as shown above, today’s concentration levels are historically high, implying a high expected size premium. Research also shows that the spread in valuations is the best predictor we have of equity premiums. According to Figure 8 in Edward Yardeni’s recent report, the current valuation spread between small and large stocks is at historically wide levels. Also note how wide the spread is between the MegaCap-8 stocks and small stocks.
The empirical research shows that retail investors base their investment decisions on recency bias. Thus, to their detriment, they tend to ignore the long-term historical evidence such as presented by Emery and Koëter. Forewarned is forearmed.
The views expressed here are the author’s. Larry Swedroe is head of financial and economic research for Buckingham Wealth Partners, collectively Buckingham Strategic Wealth, LLC and Buckingham Strategic Partners, LLC.
For informational and educational purposes only and should not be construed as specific investment, accounting, legal, or tax advice. Certain information is based on third party data and may become outdated or otherwise superseded without notice. Third party information is deemed to be reliable, but its accuracy and completeness cannot be guaranteed. Neither the Securities and Exchange Commission (SEC) nor any other federal or state agency have approved, determined the accuracy, or confirmed the adequacy of this article. LSR-23-585
Larry Swedroe is a freelance writer. The opinions expressed here are the author’s. Morningstar values diversity of thought and publishes a broad range of viewpoints.
The author or authors do not own shares in any securities mentioned in this article. Find out about Morningstar’s editorial policies.
/cloudfront-us-east-1.images.arcpublishing.com/morningstar/HKIFRWSPJZGZRNDNXEELOFFMVM.png)
/cloudfront-us-east-1.images.arcpublishing.com/morningstar/LDGHWJAL2NFZJBVDHSFFNEULHE.jpg)
/cloudfront-us-east-1.images.arcpublishing.com/morningstar/MCOHMFJ2MVEVPAJNB73ASRA4EA.jpg)
:quality(80)/s3.amazonaws.com/arc-authors/morningstar/8c5d95ea-6364-418e-82fc-473134024ece.jpg)