
PIPE Dreams: Investors Roll Dice With Private Investments
PIPEs help finance public firms, but as investments, their returns are lotterylike.
/s3.amazonaws.com/arc-authors/morningstar/8c5d95ea-6364-418e-82fc-473134024ece.jpg)

Private investment in public equities, or PIPEs, are an important source of financing for many public corporations. They are often used by most special-purpose acquisition companies, or SPACs, to finance their mergers with target companies. According to PrivateRaise, a leading database on PIPE transactions, between 2001 and 2015, there were 11,296 private placements of common stock by U.S.-listed firms that raised $243.9 billion. Firms raising funds through PIPEs tend to be small, with 93% of common stock PIPE issuers having market capitalization below $1 billion.
In order to study the performance of PIPEs, the research team at global asset manager Verdad compiled a dataset of all 29,282 PIPE transactions in the United States and Japan between January 2000 and August 2023 using Compustat’s transaction database. The dataset included over-the-counter PIPE deals, a significant portion of the U.S. dataset. Some of the previous studies only looked at NYSE- and Nasdaq-listed PIPE deals. To avoid including extremely illiquid penny-stock deals, they excluded any transactions where the market capitalization of the issuer one day before announcement was less than $1 million.
PIPE Transactions
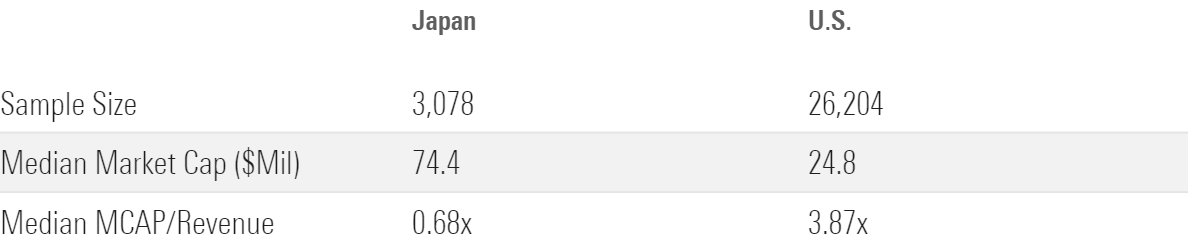
As seen in the table, PIPE transactions usually involved very small stocks with market caps below $100 million in each country. In terms of valuations, the typical PIPE issuer in Japan traded at 0.68 times revenue before the announcement (versus about 0.9 times for the Tokyo Stock Price Index over the period). On the other hand, in the U.S., PIPEs were expensive, as they traded at 3.87 times revenue before the announcement (versus about 2 times for the S&P 500 index over the period). As Verdad noted: “PIPE deals (at least in the US) have looked about as much like small growth (or venture) on steroids as they did like small value on steroids.”
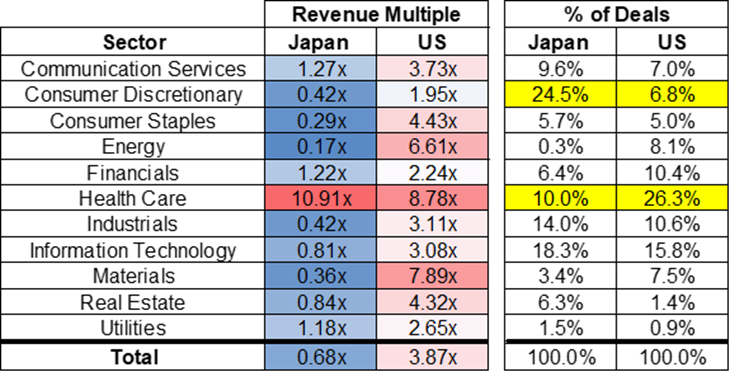
Median Multiple and Deal Count Concentration by Sector
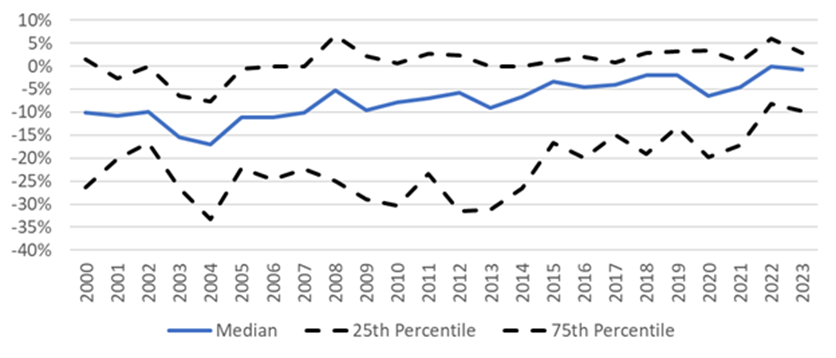
The following chart shows the discount on PIPEs relative to the public market equivalent the day before the announcement. It shows that the discount has tended to narrow over time, though widening during periods of financial distress.
Discount on PIPEs Relative to Public Market Equivalent Day Before Announcement
How have PIPES performed for investors? Verdad found that the median PIPE deal lost money, especially in the U.S., where the median PIPE returned negative 17% over the next year. However, while the median PIPE deal was a loser, PIPEs exhibited extremely skewed returns with a lotterylike distribution—most failed, but a small number of big winners made up for the high failure rate. The average returns (even after cutting out the 1% of extremes) were 14.7% for U.S. PIPEs and 26.7% for Japanese PIPEs.
Verdad concluded that the “average US PIPE return of 14.7% looks a lot like the return an investor got for buying an equally weighted mix of tenth-decile US microcap deep-value and microcap growth stocks at an 8% theoretical discount to public markets (equal to the average PIPE discount over these 23 years).”
Japanese returns were stronger as a result of much cheaper overall prices and less adverse delisting compared with the U.S. dataset that was roughly half OTC financing and included 26% healthcare and biotech deals. Verdad also noted the strong relationship between discounts to the underlying issuer and returns to investors.
Verdad noted: “The best PIPE returns were actually in far worse performing stocks where the discounts the private investor got at the onset were much bigger. The worst PIPE investments were in high performing issuer stocks where the PIPE investor simply overpaid.”
PIPEs Are Expensive Capital
An interesting question is why so many firms raise capital through PIPEs when they are considered to be expensive because the placements involve selling stock at significant discounts to the market price. Jongha Lim, Michael Schwert, and Michael Weisbach sought to answer the question with their study “The Economics of PIPEs,” published in the January 2021 issue of the Journal of Financial Intermediation. Their database consisted of 3,001 common stock PIPE transactions by 1,523 U.S. firms listed on NYSE or Nasdaq between 2001 and 2015. Following is a summary of their findings, which are consistent with those reached by Verdad:
- The median investment was $10 million, with the mean (median) transaction involving the sale of 17.6% (11.4%) of the issuer’s preoffering shares outstanding.
- Unlike most private equity investments, PIPE investments generally were made by passive investors who did not play an active role in the management of the issuing company.
- Hedge funds and private equity funds played a prominent role, participating in roughly two thirds of the PIPEs in the sample and providing an average of 72% of the capital. However, there was a dichotomy, with hedge funds and private equity providing either the bulk of the capital or none of it.
- PIPE investors received warrants in 39% of the transactions in the sample and purchased the package of securities at an 11.2% discount relative to their market value. The discount was much higher for PIPEs with attached warrants than without, averaging 20.1% for PIPEs with warrants and 5.7% for those without. Also, firm size was negatively related to the size of the discount.
- In addition to the equity and warrants, investors in PIPEs received a number of other rights, such as the warrants having antidilution protection—if there was another equity issue at a lower price, the strike price of the warrants would be adjusted downward. Such rights provided further value.
- As a result of the discounted purchase price, PIPE investors earned substantially higher returns than investors who bought and sold stocks of PIPE issuers or comparable firms at market prices. Over the year following the issuance, PIPE investors averaged a 12.1% buy-and-hold abnormal return compared with negative 5.2% for investors who bought and sold the issuers’ stocks at market prices. Including the value of the warrants increased the returns to 17.4% over three months, 13.2% over six months, 12.1% over one year, and 10.1% over two years.
- The returns that PIPE investors earned declined with the time they held the investment because the offering discount accrued to investors immediately when the transaction closed. After that point, the long-run performance of issuing firms tended to be poor. As a result, investors tended to begin to exit as quickly as possible.
- While the average return to PIPE investors was high, there was substantial skewness in the distribution of returns, with the median PIPE investment earning an abnormal return of just 1.7% over the year after issuance. PIPE returns were skewed because the returns of the issuing firms’ stocks were themselves skewed. In addition, warrants amplified the returns of the best-performing deals while having no effect on the poorly performing ones.
- PIPE investing is like venture capital investing in that “home run” investments are the driver of outperformance—they have lotterylike characteristics.
- The stocks PIPE investors purchase are relatively illiquid because they are usually issued by small, poorly performing companies, which typically have high information asymmetry. Therefore, if a PIPE investor wishes to exit their position by selling shares in the secondary market, their ability to do so without depressing the price is limited unless they spread the sales over a long period of time.
Lim, Schwert, and Weisbach explained: “PIPE investors have an incentive to exit their stock positions as quickly as possible to capture the discount and mitigate exposure to the issuer’s downside risk. However, two factors limit the ability of PIPE investors to exit their positions quickly. First, 81% of transactions in our sample involve issuance of unregistered shares that cannot be freely traded until they are registered with the SEC, which happens 100 days after issuance on average. Second, the shares of PIPE issuers are illiquid, so they cannot be sold quickly without putting downward pressure on the stock price. Consistent with the notion that PIPE investors have incentives to exit quickly, we observe increased trading volume and negative abnormal stock returns immediately after the registration date of PIPEs in our sample.”
To estimate the returns to PIPE investors controlling for registration status and the limited ability of investors to exit their positions given the thinness of trading in the underlying stocks, Lim, Schwert, and Weisbach calculated “holding period adjusted returns,” assuming that investors sell a constant fraction of the daily volume each trading day from the effective registration date until they liquidate their position. The returns from this strategy, which presumably could be executed with minimal price impact, led to returns that were still noticeably higher than investments in comparable firms at market prices. Assuming that investors sold 10% of the daily trading volume after registration, PIPE investors averaged a 19.7% abnormal return compared with 3.7% for market investors over an average holding period of 384 days.
Why Do Public Firms Raise Such Expensive Capital?
Their research led Lim, Schwert, and Weisbach to conclude that public firms use expensive PIPEs for the following reasons:
- Even though these firms were publicly traded, they were relatively small, with median book assets of $51 million.
- In the year prior to the PIPE issuance, operating performance tended to be very poor, with a median ratio of EBITDA/book assets of negative 22% (versus about 8% for the average company).
- Public firms likely do not have access to public debt markets and appear to have limited access to bank loans—93% of issuers lacked a public debt rating, and the median firm had a leverage ratio of only 7.2% (versus about 19% for the average company). Only 7.2% of PIPE issuers had a long-term credit rating (versus about 30% of all companies in the Compustat database); and among the rated firms, less than one third had an investment-grade rating.
PIPEs are used because the firms have limited choices as a result of ongoing operating losses and high cash burn rates—the abnormal returns earned by PIPE investors reflect compensation for providing capital to poorly performing firms that find it costly, or even impossible, to obtain financing from alternative sources.
Lim, Schwert, and Weisbach concluded that PIPEs are an important, though expensive, source of financing for relatively small public firms without sufficient internal cash flow to finance investment and without alternative sources of capital. The cost of this financing is the expected return investors receive, which depends on issuing firms’ returns, discounts, and warrants associated with the offering, and investors’ holding periods.
Investor Takeaways
The performance of PIPEs as an asset class is driven largely by “home run” deals with huge returns. This highlights the importance of diversification when undertaking illiquid investments with lotterylike distributions. The other important takeaways are that returns have been strongly correlated with the discount to the public market and that PIPEs should be considered as only very short-term investments because their returns have deteriorated with the length of the holding period (as the discount is amortized over longer horizons).
The views expressed here are the author’s. Larry Swedroe is the chief research officer for Buckingham Strategic Wealth and Buckingham Strategic Partners. For informational and educational purposes only and should not be construed as specific investment, accounting, legal, and tax advice. Certain information may be based on third party data and may become outdated or otherwise superseded without notice. Third party information is deemed to be reliable, but its accuracy and completeness cannot be guaranteed. Neither the Securities and Exchange Commission (SEC) nor any other federal or state agency has approved, determined the accuracy, or confirmed the adequacy of this article. LSR-23-572
Correction: (Dec. 28, 2023) A previous version of this article misspelled Michael Weisbach's first name.
Larry Swedroe is a freelance writer. The opinions expressed here are the author’s. Morningstar values diversity of thought and publishes a broad range of viewpoints.
The author or authors do not own shares in any securities mentioned in this article. Find out about Morningstar’s editorial policies.
/cloudfront-us-east-1.images.arcpublishing.com/morningstar/GJMQNPFPOFHUHHT3UABTAMBTZM.png)
/cloudfront-us-east-1.images.arcpublishing.com/morningstar/ZYJVMA34ANHZZDT5KOPPUVFLPE.png)
/cloudfront-us-east-1.images.arcpublishing.com/morningstar/LDGHWJAL2NFZJBVDHSFFNEULHE.jpg)
:quality(80)/s3.amazonaws.com/arc-authors/morningstar/8c5d95ea-6364-418e-82fc-473134024ece.jpg)