
Why U.S. Equities Have Beaten International Equities Since 2010
Plus, insights from fund managers on whether the trend will continue.
/s3.amazonaws.com/arc-authors/morningstar/96a2625e-83c2-4fdb-9fd7-0efcd07c88bb.jpg)
/s3.amazonaws.com/arc-authors/morningstar/aa946852-e4a7-438e-a67b-ded2358a0f40.jpg)

Since the last bull market emerged following the global financial crisis, no allocation decision has loomed larger than the split between U.S. and non-U.S. equities. A U.S. equity-heavy portfolio likely outperformed one tilted toward non-U.S. stocks by a wide margin regardless of manager talent. Indeed, the best-performing actively managed foreign large-blend fund trailed nearly all active U.S. large-blend funds from the start of 2010 through year-end 2022.
Given the critical role that equities play in many investors’ portfolios, the U.S. stock market’s dramatic outperformance warrants a closer look. A new paper, “Explaining America’s Stock Market Dominance Since 2010,” explores the reasons why U.S. stocks have led for more than a decade, examines whether that trend can continue, and highlights what some fund managers Morningstar covers think will happen and why.
American Exceptionalism
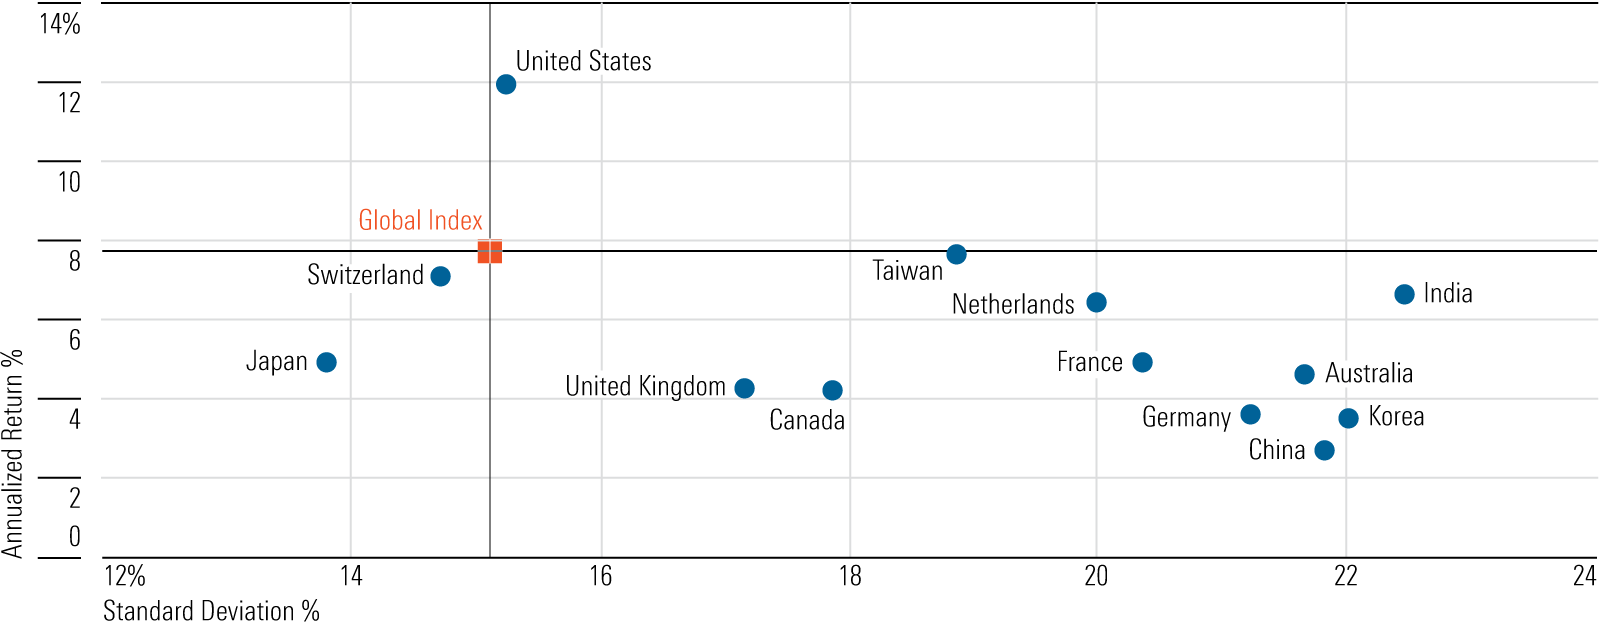
U.S. equities have outperformed non-U.S. equities by a wide margin following the 2007-09 global financial crisis. Since the start of 2010, through December 2022, the Morningstar US Market Index gained 12.0% annualized, trouncing the Morningstar Global ex-U.S. Index’s 4.4%. While emerging markets hurt foreign stock returns the most, developed markets also didn’t impress. The Morningstar Developed ex-U.S. Index gained 4.6% annualized over the same stretch, while the Morningstar Emerging Markets Index rose just 3.0%. Not only did the U.S. market achieve superior absolute returns, but it also did so with far lower volatility (as measured by standard deviation of returns) than those outside the U.S. That defies the textbook, capital asset pricing model logic that more risk should come with higher expected returns.
Annualized Return vs. Risk by Market
Why Have U.S. Equities Stood Out?
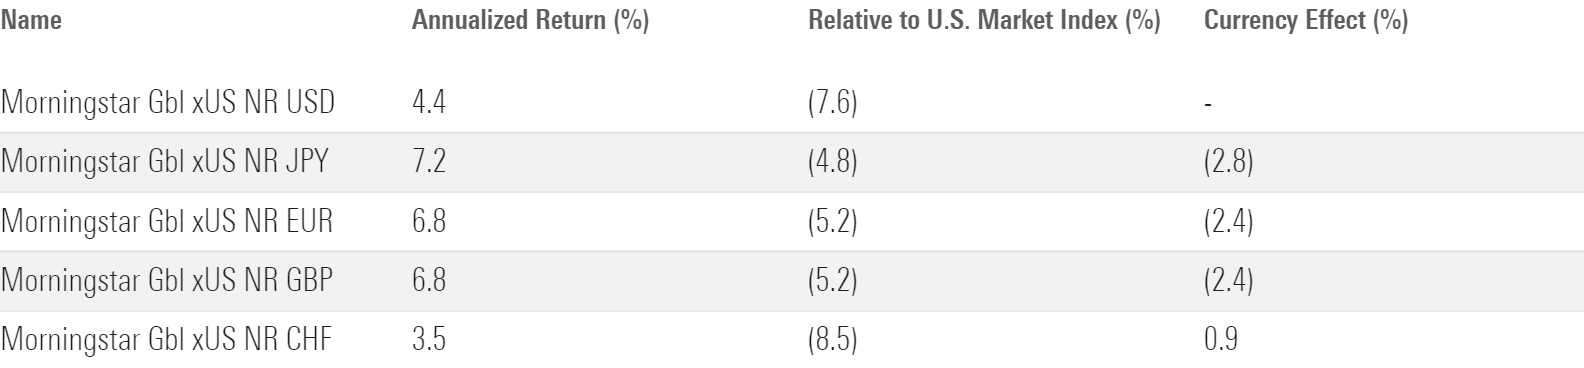
To be fair, currency movements have exacerbated the performance divergence. From 2010 through 2022, the U.S. dollar appreciated a cumulative 33%—or 2.2% annualized—relative to a broad basket of foreign currencies, reducing non-U.S. asset returns denominated in U.S. dollars. But the same story holds for non-U.S. returns in different currencies, including the euro, British pound, Japanese yen, and Swiss franc. Even after accounting for currency movements, U.S. equities have reigned supreme.
Global Ex-U.S. Index Returns in Different Currencies (2010-22)
Moreover, the U.S. does have structural advantages. It possesses most of the world’s top universities, which attract superior talent from within and abroad, and contribute to high levels of innovation and dynamism. It has the world’s deepest capital markets, plus a scale advantage that is hard to beat, considering it’s a single market with 50 states and a common language. This confluence of factors contributes to the Morningstar US Market Index having far more exposure to areas of innovation like technology and communication services, while “old-economy” sectors like financial services, basic materials, and industrials tend to drive the Morningstar Global ex-U.S. Index.
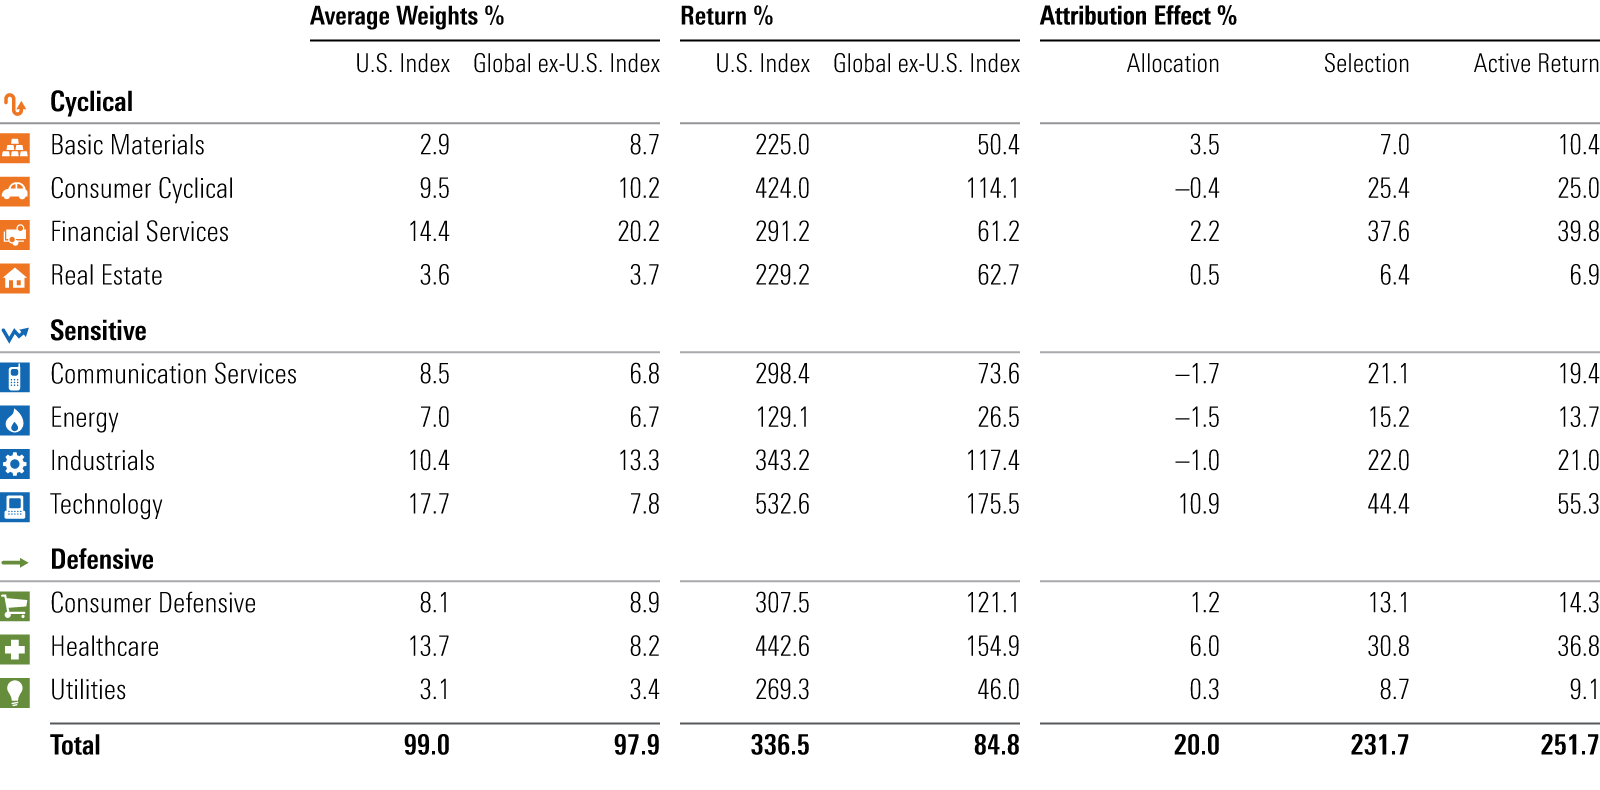
Morningstar attribution data confirms sector composition accounts for some of the performance gap between U.S. and non-U.S. equities, but it’s a small fraction of the story. Exhibit 3 shows the sector allocation effect accounted for less than 10% of the U.S. index’s outperformance relative to the non-U.S. index, while stock-specific factors accounted for more than 90%. Moreover, the U.S. runaway winners—Facebook (now Meta Platforms META), Amazon.com AMZN, Netflix NFLX, Google (now Alphabet GOOGL), Apple AAPL, and Microsoft MSFT—only explained about 22% of the active return for the U.S. index versus the non-U.S. index between 2010 and 2022. That’s not an insignificant amount, but it shows that the U.S. market’s dominance stretches far beyond just a small number of stocks.
Sector Performance Attribution: Morningstar U.S. Market Index vs. Morningstar Global ex-U.S. Index (2010-22)
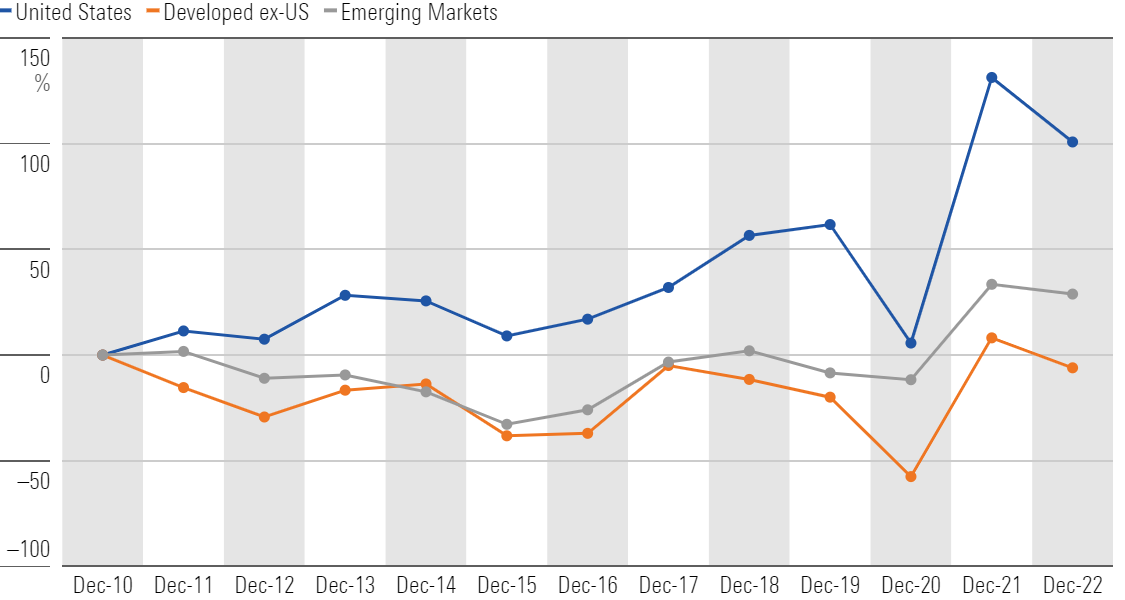
The bottom line is that U.S. companies have had superior fundamentals. Measuring from 2011, which excludes 2010′s outlier results emerging from the 2007-09 global financial crisis, through 2022, U.S. corporate earnings have grown by 6.0% annualized, nearly triple emerging markets’ rate and far ahead of developed ex-U.S. stocks’ roughly flat earnings over the period. U.S. companies have also been more profitable in terms of return on invested capital across most sectors and had better-optimized balance sheets than their international peers.
Cumulative Earnings-Per-Share Growth: 2011-22, Measured Annually in USD
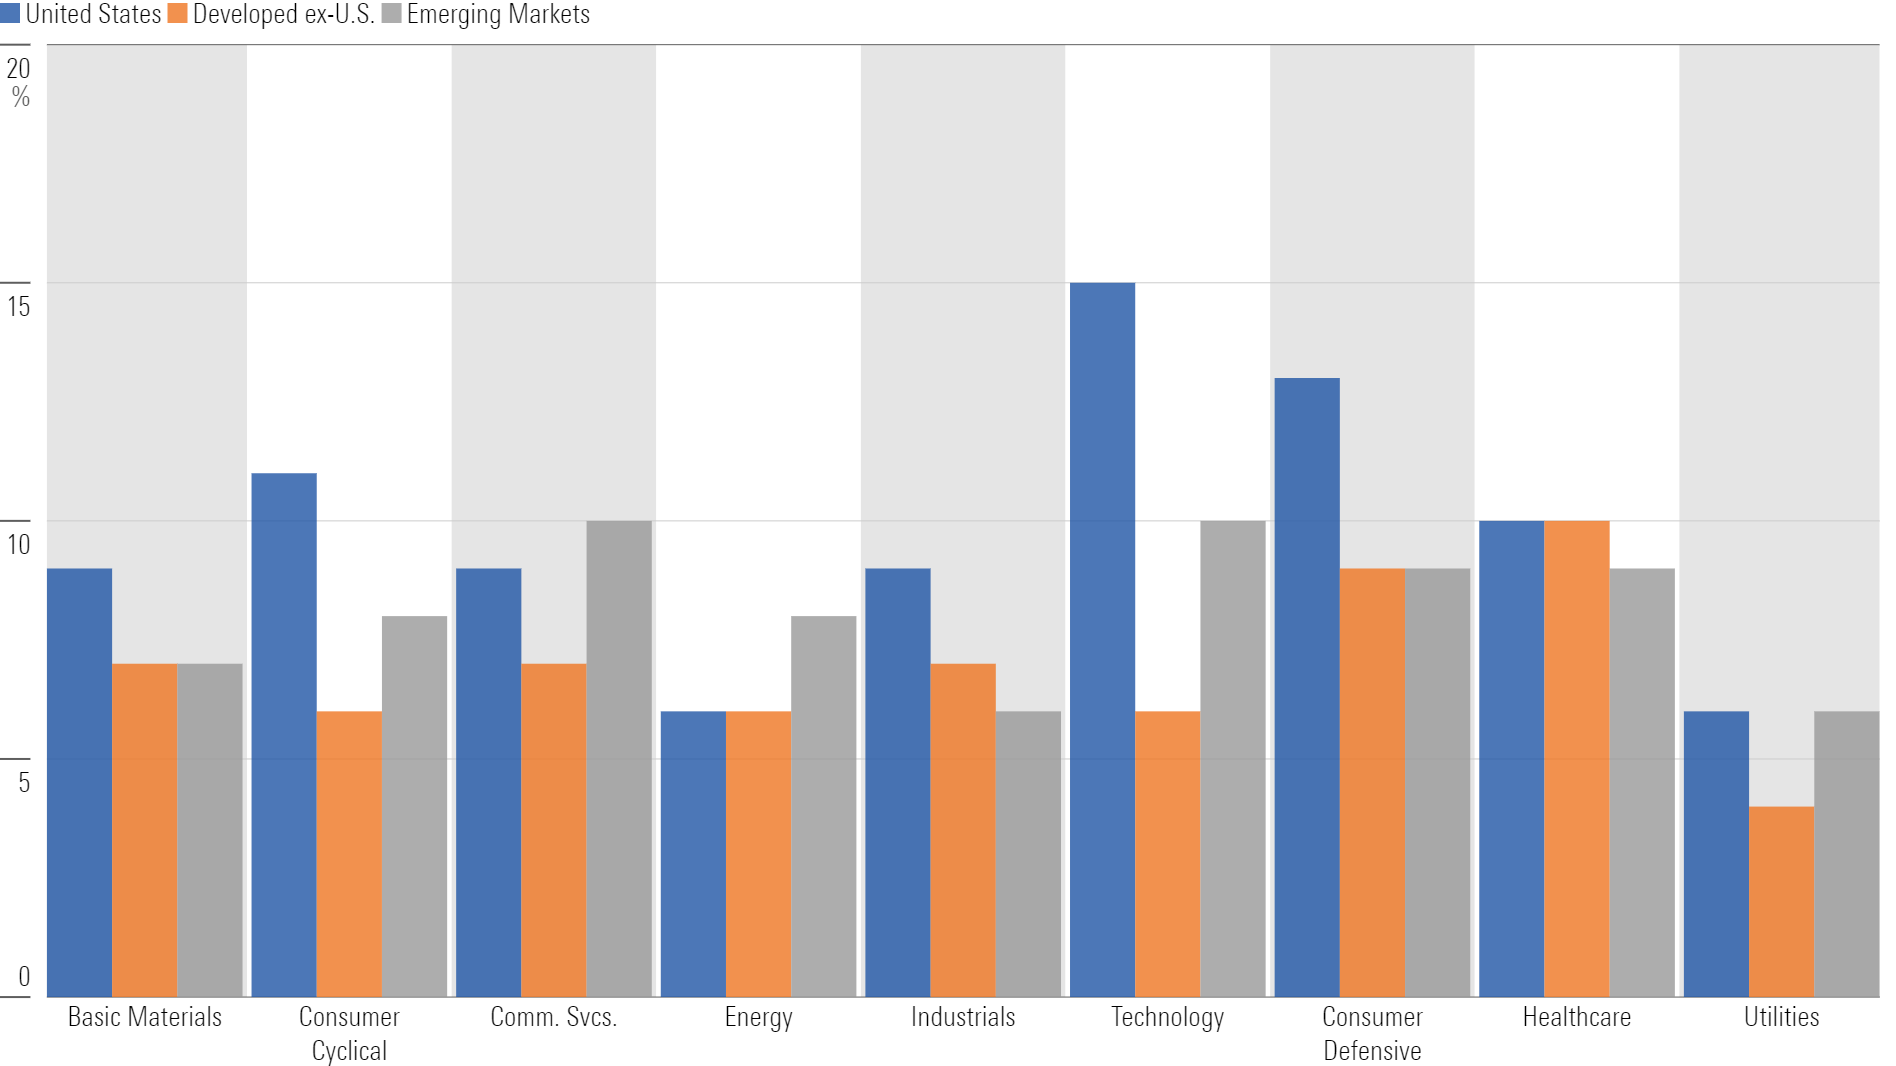
Average Annual ROIC by Sector: 2010-22
U.S. stocks have long tended to trade at higher price multiples than non-U.S. stocks, but the gap has widened since 2010, in part owing to superior fundamentals.
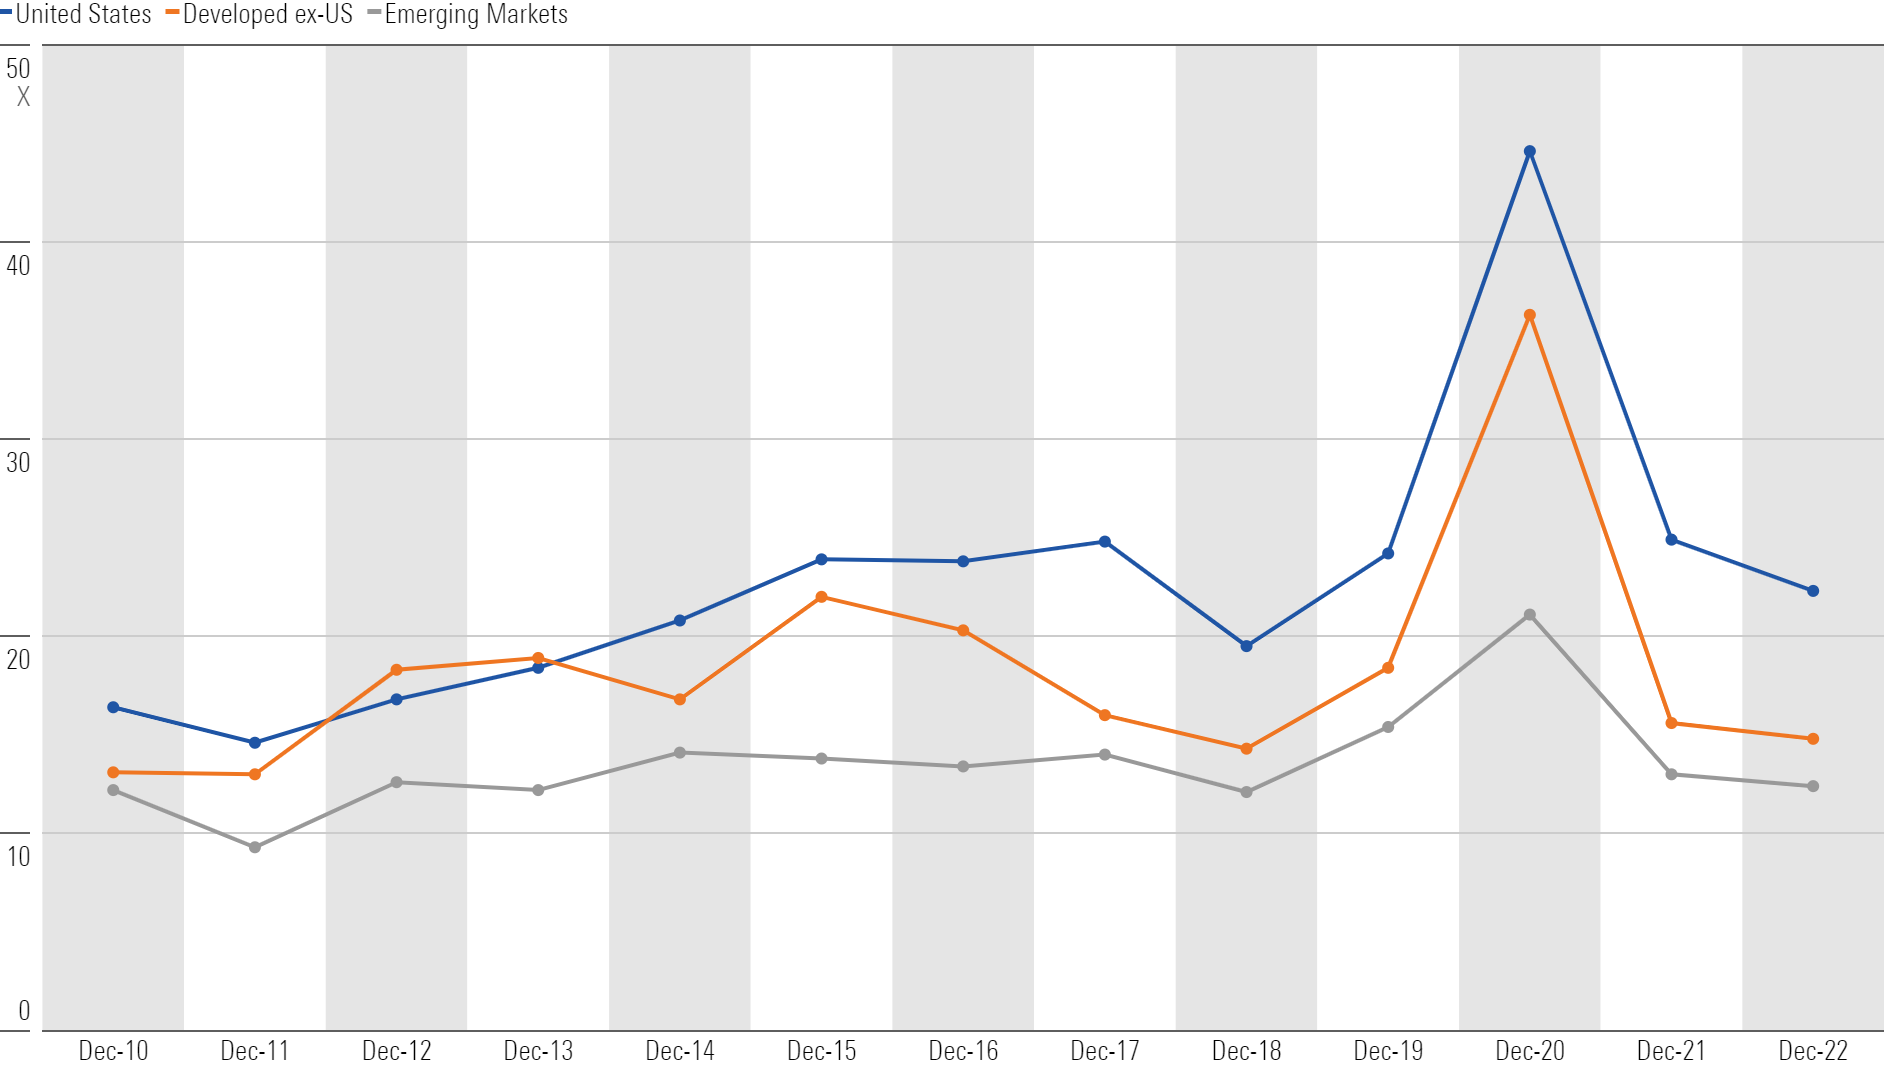
Trailing Price/Earnings Multiple, Measured Annually: 2010-22
Will U.S. Equities Maintain Their Edge Over International Equities?
The case for U.S. outperformance in the future is a continuation of the status quo. After all, it arguably remains the world’s most competitively advantaged market, the center of global innovation, and the corporate governance benchmark. While the U.S. market is more expensive based on price multiples than non-U.S. markets, the premium may be warranted if the U.S. can maintain its competitive advantages and stronger fundamentals.
The case for non-U.S. markets taking the lead is that they appear attractive when factoring in price multiples and currencies. Improving fundamentals and corporate governance could also serve as catalysts. But perhaps the strongest rationale is the market’s most pervasive phenomenon: mean reversion. Market history is defined by cycles, rotations, and changes in leadership. Non-U.S. stocks have outpaced U.S. stocks for extended periods in the past, such as the mid-1980s and from the late 1990s into the mid-2000s. U.S. stocks have led for well over a decade, and could be due for a reversal.
What Global Managers Think of U.S. vs. International Equities in Aggregate
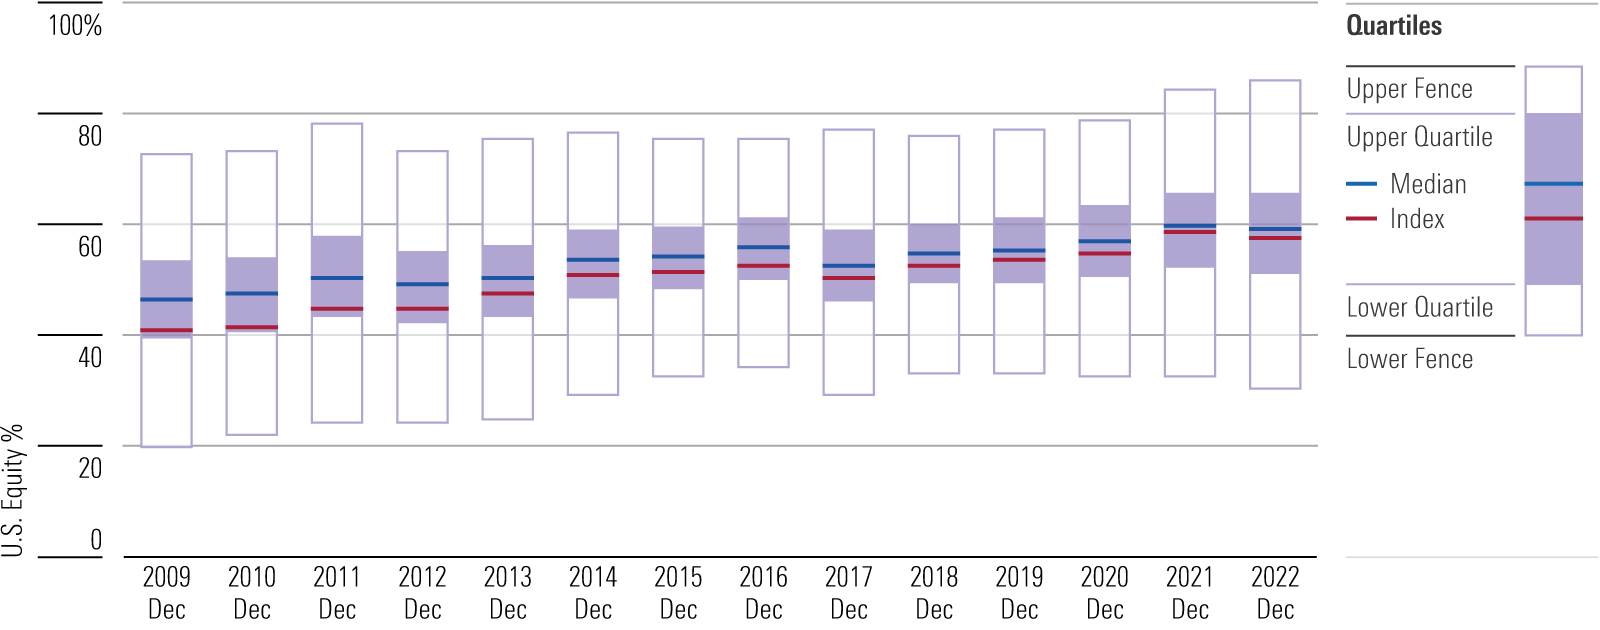
Global equity managers’ absolute allocation to U.S. stocks has increased drastically since 2010. That comes as no surprise: As U.S. stocks rose, so did their weightings in the Morningstar Global Markets Index and actively managed funds. But what is more interesting is how active managers have positioned their portfolios relative to broad indexes that they are paid to beat. By that measure, managers have become, on average, less optimistic about U.S. stocks in recent years. The typical manager was significantly overweight U.S. stocks for most of the 2010s, but enthusiasm waned in 2019-20. Managers added marginally to U.S. stocks as global markets faltered in 2022, but they still ended the year with 59% of assets allocated to U.S. stocks, just above the index’s 57%.
Global Categories' U.S. Equity Exposure
Conclusion
Investors have a lot to consider as they position their portfolios. They could choose to overweight the U.S., tilt toward foreign stocks, or take a passive approach and match a global index’s allocation. Predicting whether a particular region will outperform is notoriously difficult. Few if any managers would have accurately forecast how the market landscape looks today back at the beginning of 2010. Overall, as with any investment decision, it’s important to understand the risks involved.
The author or authors own shares in one or more securities mentioned in this article. Find out about Morningstar’s editorial policies.
/cloudfront-us-east-1.images.arcpublishing.com/morningstar/T2LGZCEHBZBJJPPKHO7Y4EEKSM.png)
/d10o6nnig0wrdw.cloudfront.net/07-25-2024/t_56eea4e8bb7d4b4fab9986001d5da1b6_name_file_960x540_1600_v4_.jpg)
/cloudfront-us-east-1.images.arcpublishing.com/morningstar/BU6RVFENPMQF4EOJ6ONIPW5W5Q.png)
:quality(80)/s3.amazonaws.com/arc-authors/morningstar/96a2625e-83c2-4fdb-9fd7-0efcd07c88bb.jpg)
:quality(80)/s3.amazonaws.com/arc-authors/morningstar/aa946852-e4a7-438e-a67b-ded2358a0f40.jpg)