
ETF Flows: The Dam Bursts in November
A banner month in the markets ignites $110 billion of inflows for U.S. ETFs.
/s3.amazonaws.com/arc-authors/morningstar/30e2fda6-bf21-4e54-9e50-831a2bcccd80.jpg)

Here are some key takeaways from the month in ETF flows.
- The Morningstar Global 60/40 Index shot up 7.51% in November as stocks and bonds rallied worldwide.
- Promising economic data propelled the Morningstar U.S. Core Bond Index to a 4.42% November return—its best on record dating back to 2000.
- The Morningstar Global Markets Index, a broad gauge of global equities, snapped a three-month losing streak to the tune of a 9.21% gain.
- Investors poured a whopping $110 billion into U.S. exchange-traded funds.
- Stock ETFs reeled in $77 billion of that money, followed by bond ETFs with $31 billion.
- Active ETFs continued their dominant 2023 campaign with $21 billion of inflows.
- High-yield bond ETFs reversed their year of outflows with a record-setting $11 billion haul.
- The ETF market’s “Big Three,” iShares, Vanguard, and State Street, led all providers in November inflows.
Bonds Break Through
Exhibit 1 shows November returns for a sample of ETFs that represent major asset classes. A blended portfolio climbed an even 7% in November. Behind flourishing equity and fixed-income returns, the Morningstar Global 60/40 Index posted its best month since November 2020.
Exhibit 1: November Market Performance Through the Lens of Analyst-Rated ETFs
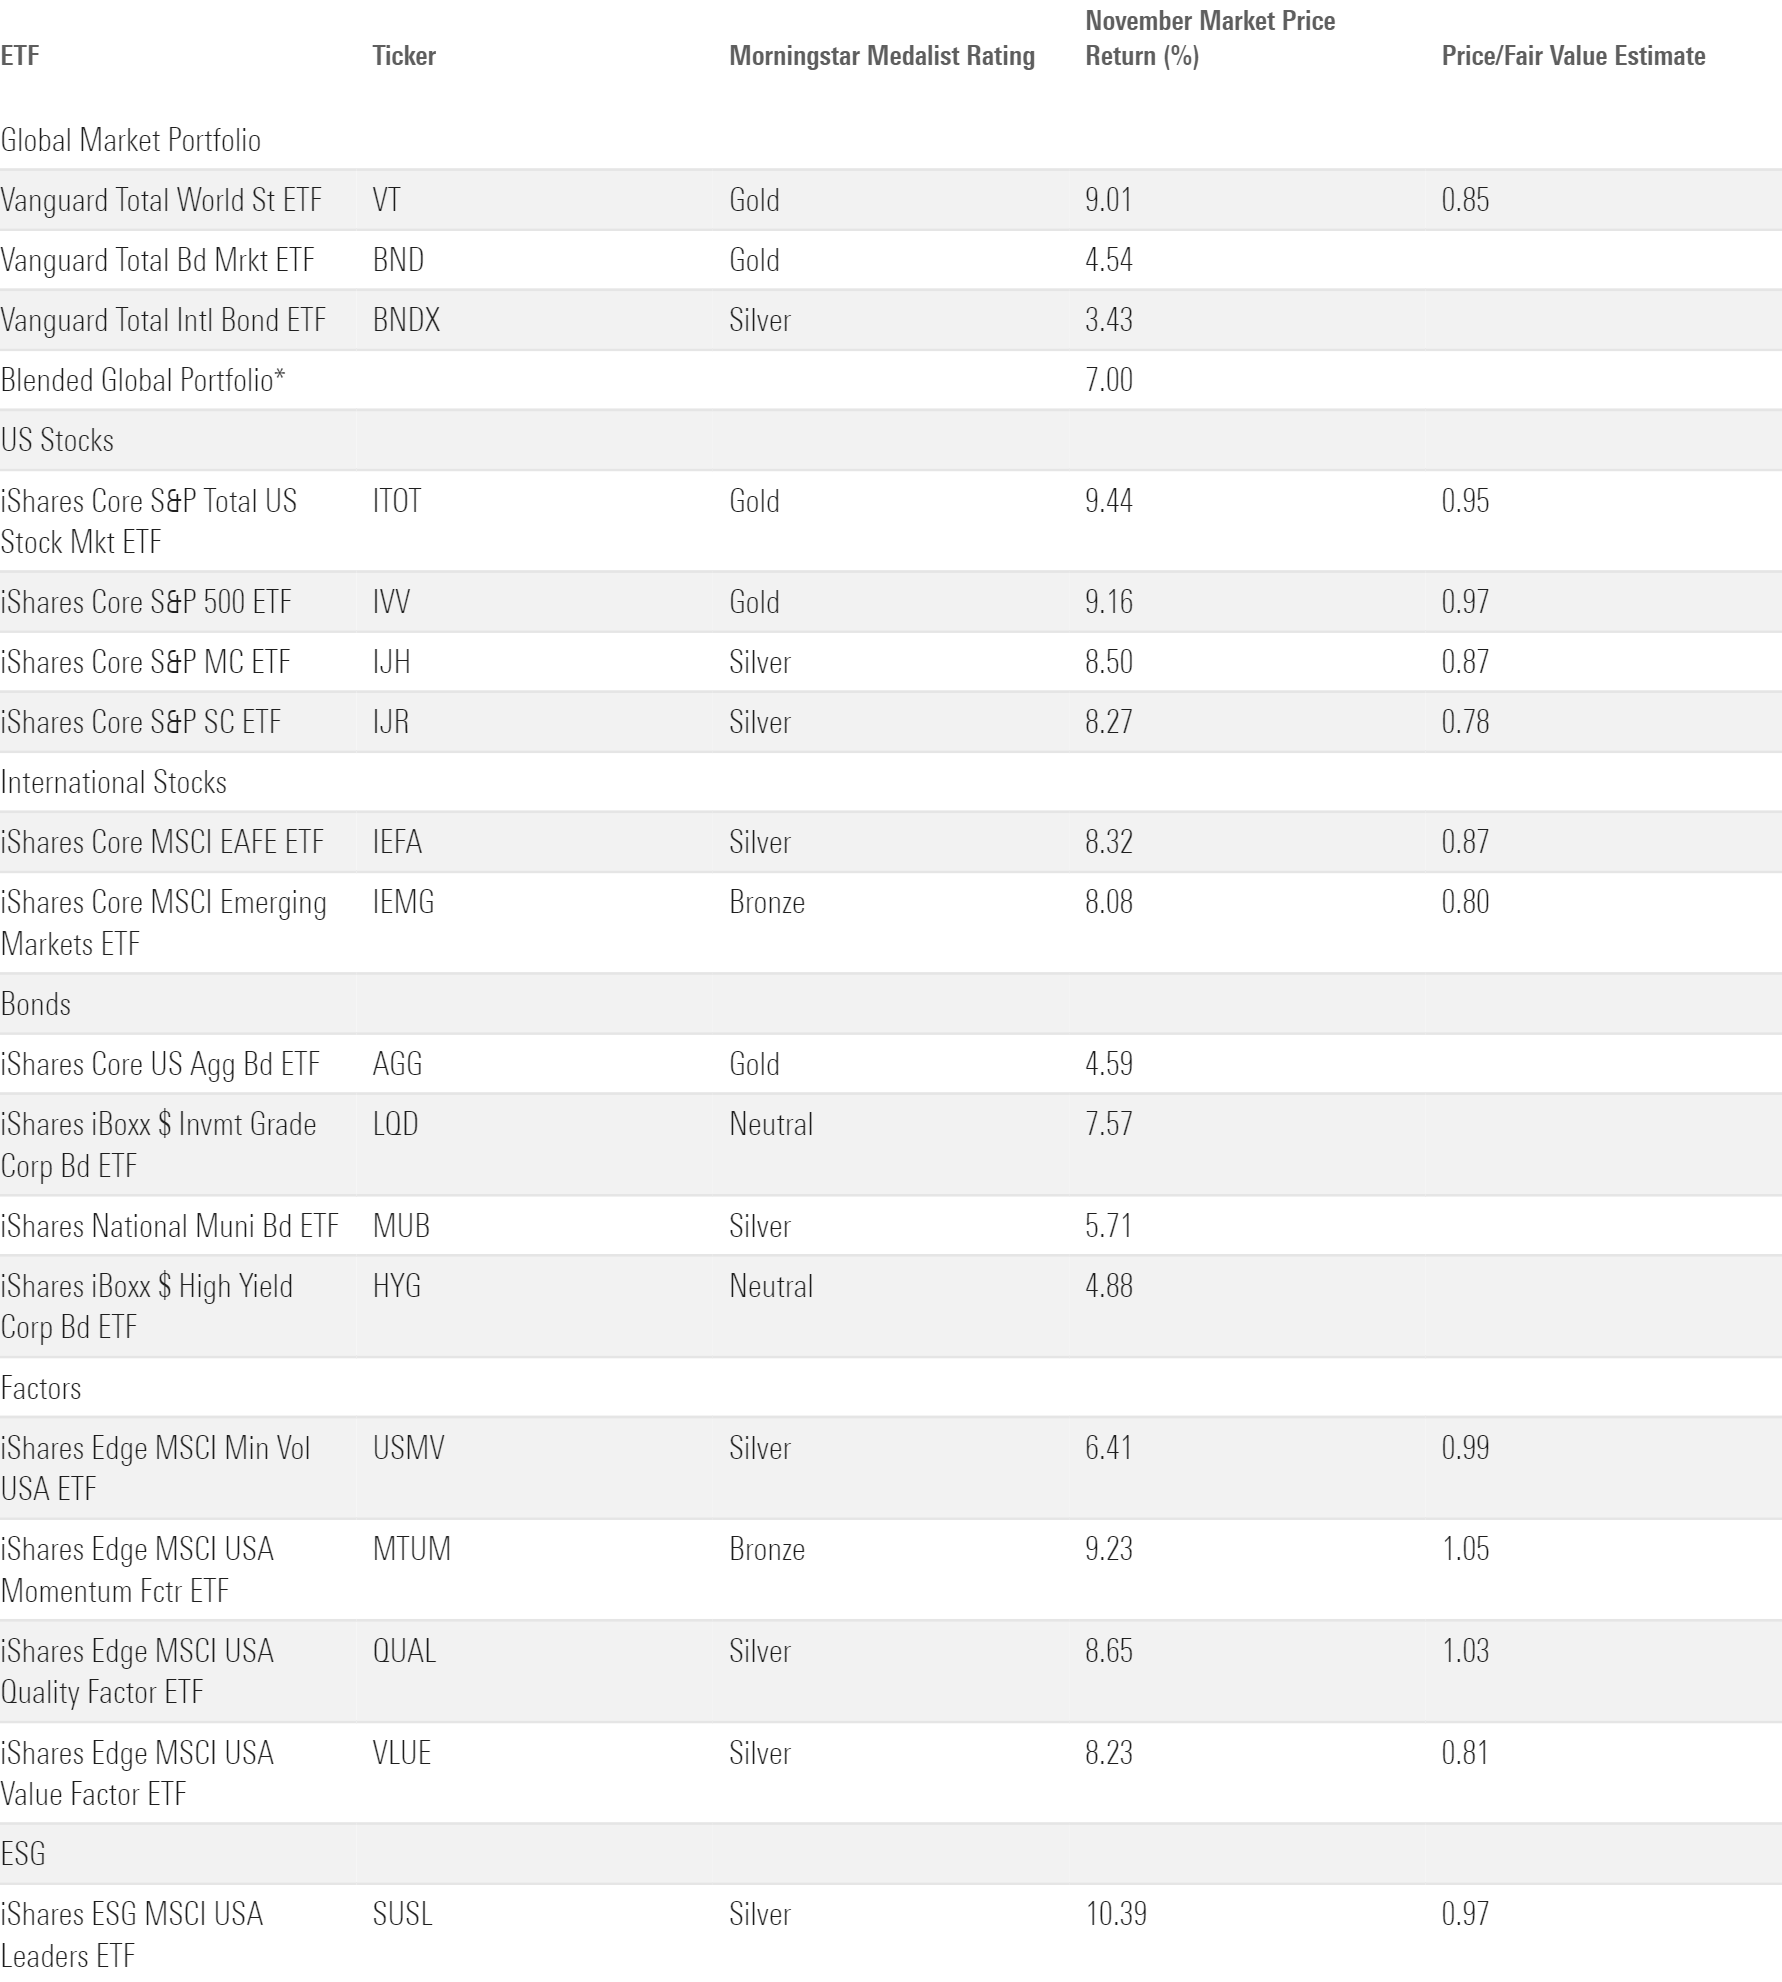
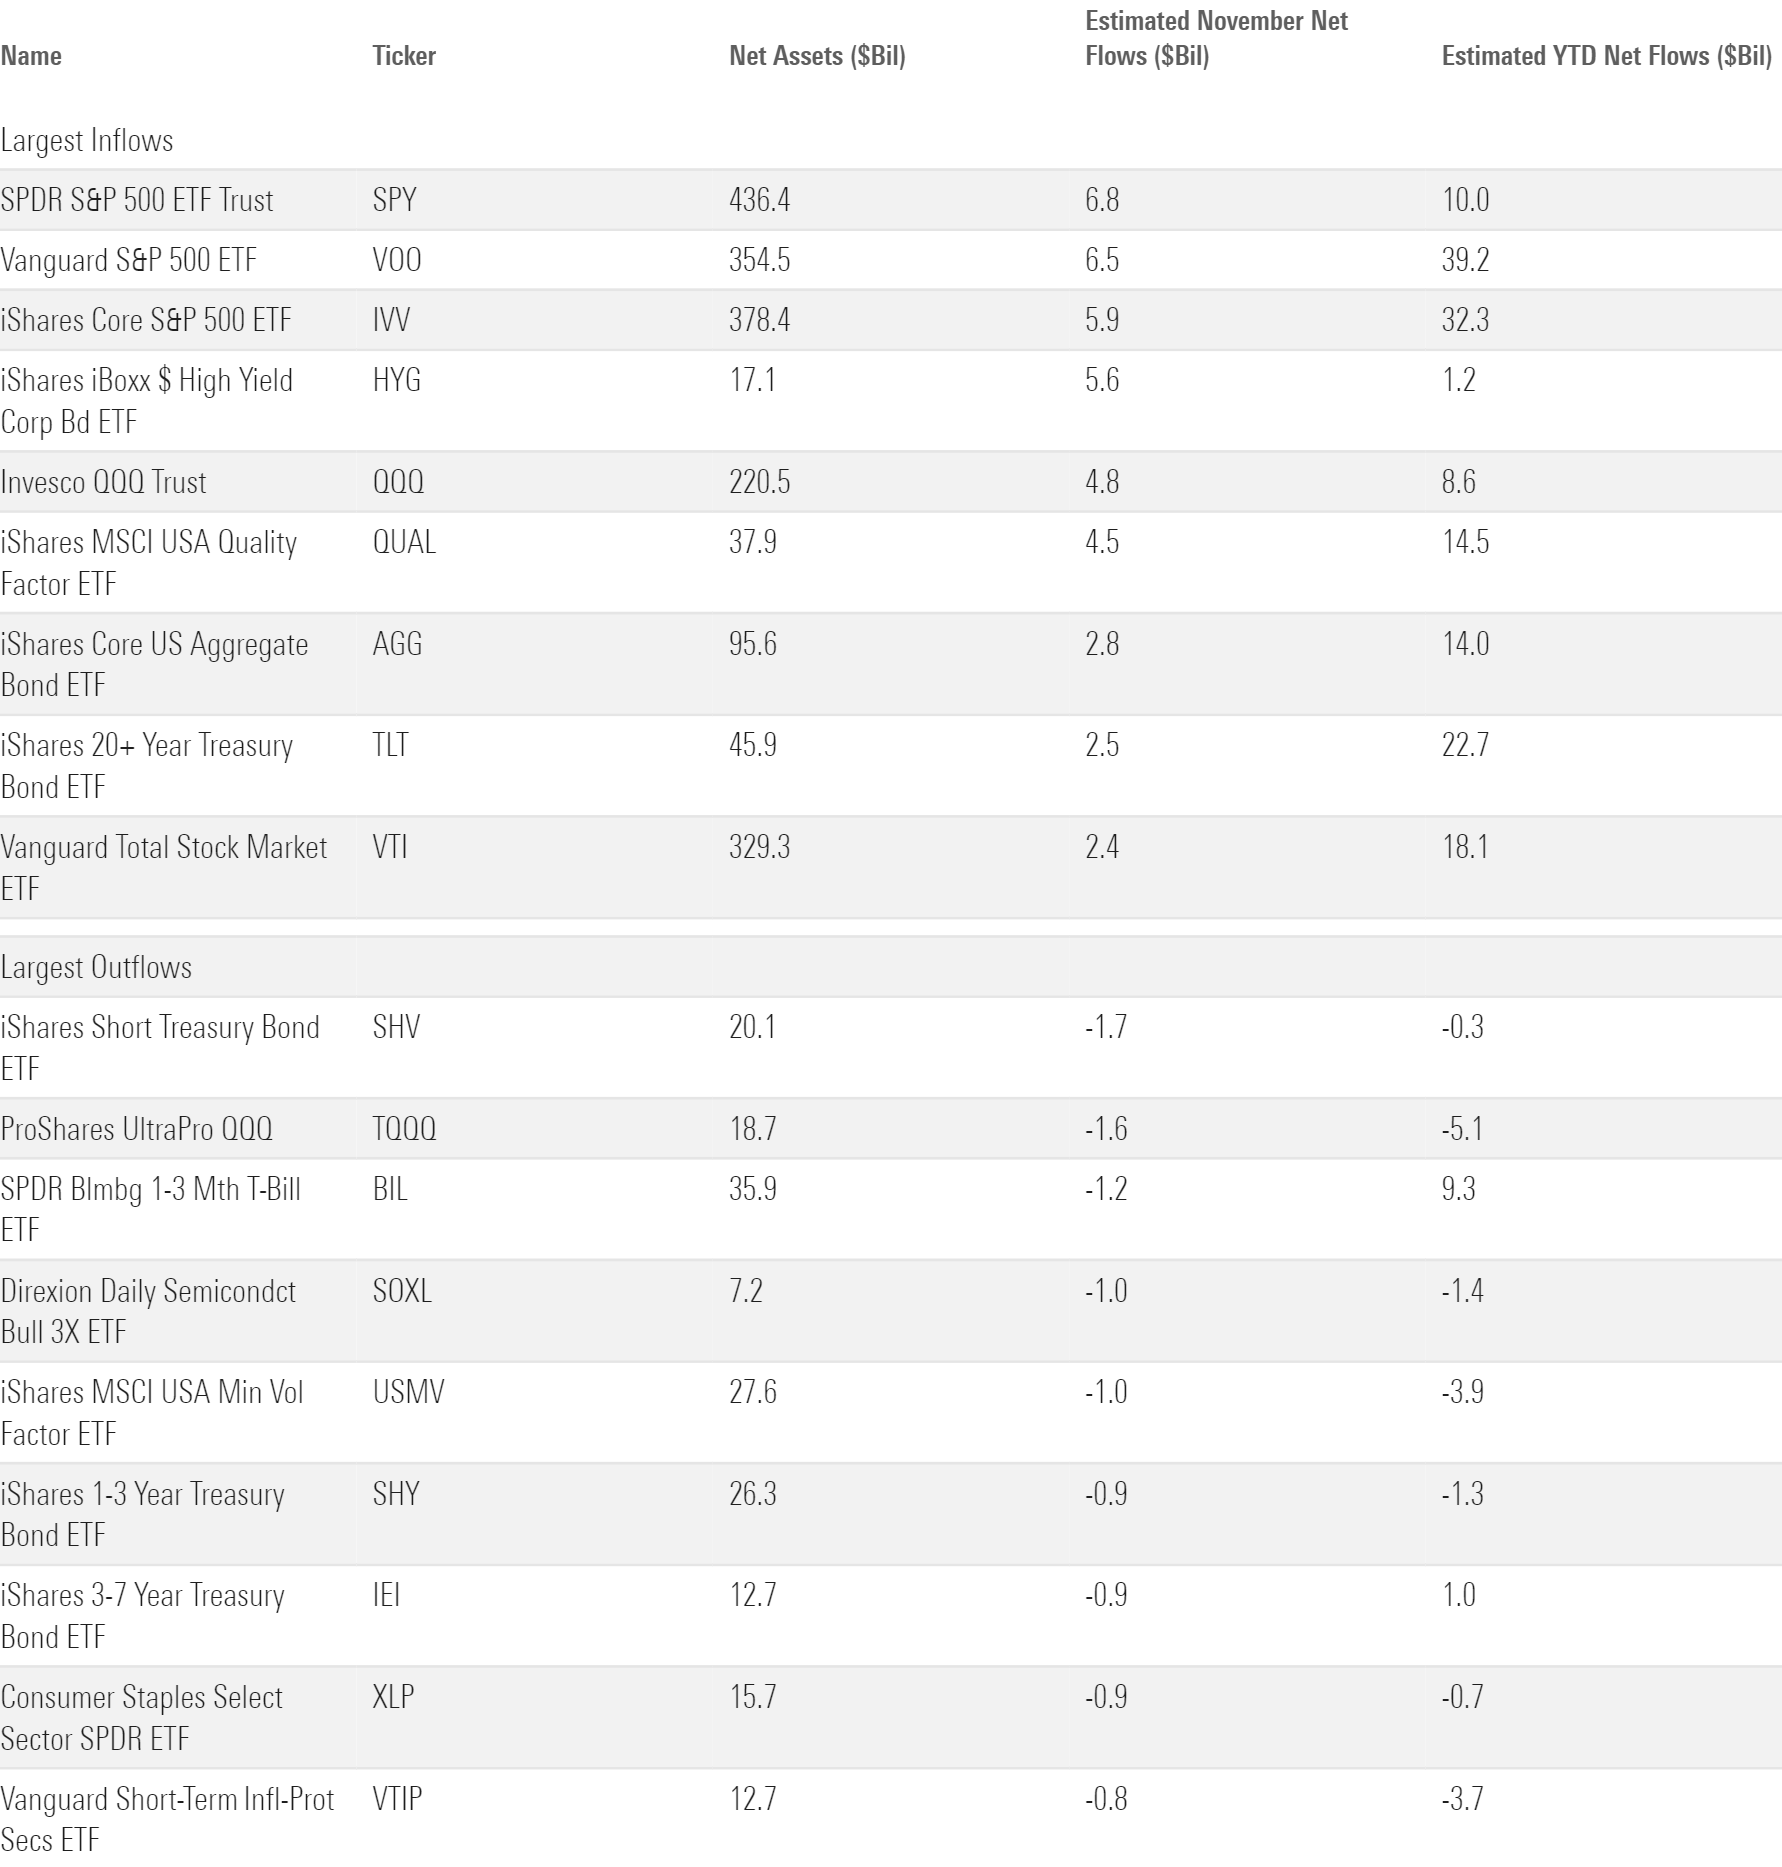
After over a year of dreadful performance, bonds finally broke through in November. Vanguard Total Bond Market ETF BND advanced 4.5% in its best month since November 2008, when investors flocked to safety in the throes of the global financial crisis. Positive sentiment about the trajectory of interest rates primarily drove the rally. Long-term bond portfolios saw the starkest turnaround because they tend to be most sensitive to interest rates. IShares 20+ Treasury Bond ETF TLT shot up 9.9% in November after sliding 13.7% over the first 10 months of the year. Short-term bond strategies posted milder gains—iShares Short Treasury Bond SHV gained just 0.5%—but they had far less ground to make up.
A flurry of positive economic news powered the bond resurgence. Inflation cooled and came in lower than or equal to expectations, depending on the measure. That didn’t come at the expense of the economy’s health, as third-quarter gross domestic product data showed solid economic growth from last year. This combination of news convinced the market that higher interest rates might not sustain for as long as feared and that the fabled “soft landing” scenario is well within reach. Furthermore, the Treasury Department cut back on long-term bond issuances in favor of shorter-term debt, providing another jolt to long-term fixed-income securities.
Stocks Ride the Wave
The economic factors that ignited bond performance did the same for equities. Vanguard Total Stock Market ETF VTI snapped a three-month losing streak with a 9.4% gain, its healthiest since November 2020. A broad range of stocks pushed the market ahead, an encouraging change from early 2023 when a handful of mega-cap tech stocks shouldered the load. IShares Core S&P 500 ETF IVV and Invesco S&P 500 Equal Weight ETF RSP posted nearly identical gains of 9.16% and 9.18%, respectively. Mid- and small-cap stocks couldn’t quite keep up with their large-cap peers, but they hewed closer to them than earlier this year.
Returns weren’t quite as balanced along sector lines. As in the bond market, the sectors most responsive to interest rates fared best: Technology Select Sector SPDR ETF XLK led the State Street suite of sector strategies with a 12.9% November gain, just ahead of Real Estate Select Sector SPDR ETF’s XLRE 12.5% return. XLK has soared 49.8% for the year to date through November—quite the turnaround after losing 27.7% of its value in 2022. Energy Select Sector SPDR ETF XLE slid 0.7% in November, making it the lone SPDR sector ETF finishing the month in the red. Energy stocks have zigged while the broad market zagged for much of the past three years. Over that span, XLE’s returns showed far lower correlation to the market than any of its peers—a reminder that oil prices can drive energy-stock valuations more acutely than the tides of the broad market.
Foreign stocks trailed the U.S. in November, but Vanguard Total International Stock ETF’s VXUS 8.2% gain is nothing to sneeze at. It drew on strong performance from companies in eurozone countries like the Netherlands and Germany. Morningstar Indexes tracking those markets advanced 14.3% and 13.1% in November, respectively, helping iShares MSCI Eurozone ETF EZU to an 11.1% November return. Korean and Taiwanese equities posted excellent gains last month, too, though milder China-stock returns weighed on most Asia-Pacific and emerging-markets portfolios.
ETF Flows Take Off in November
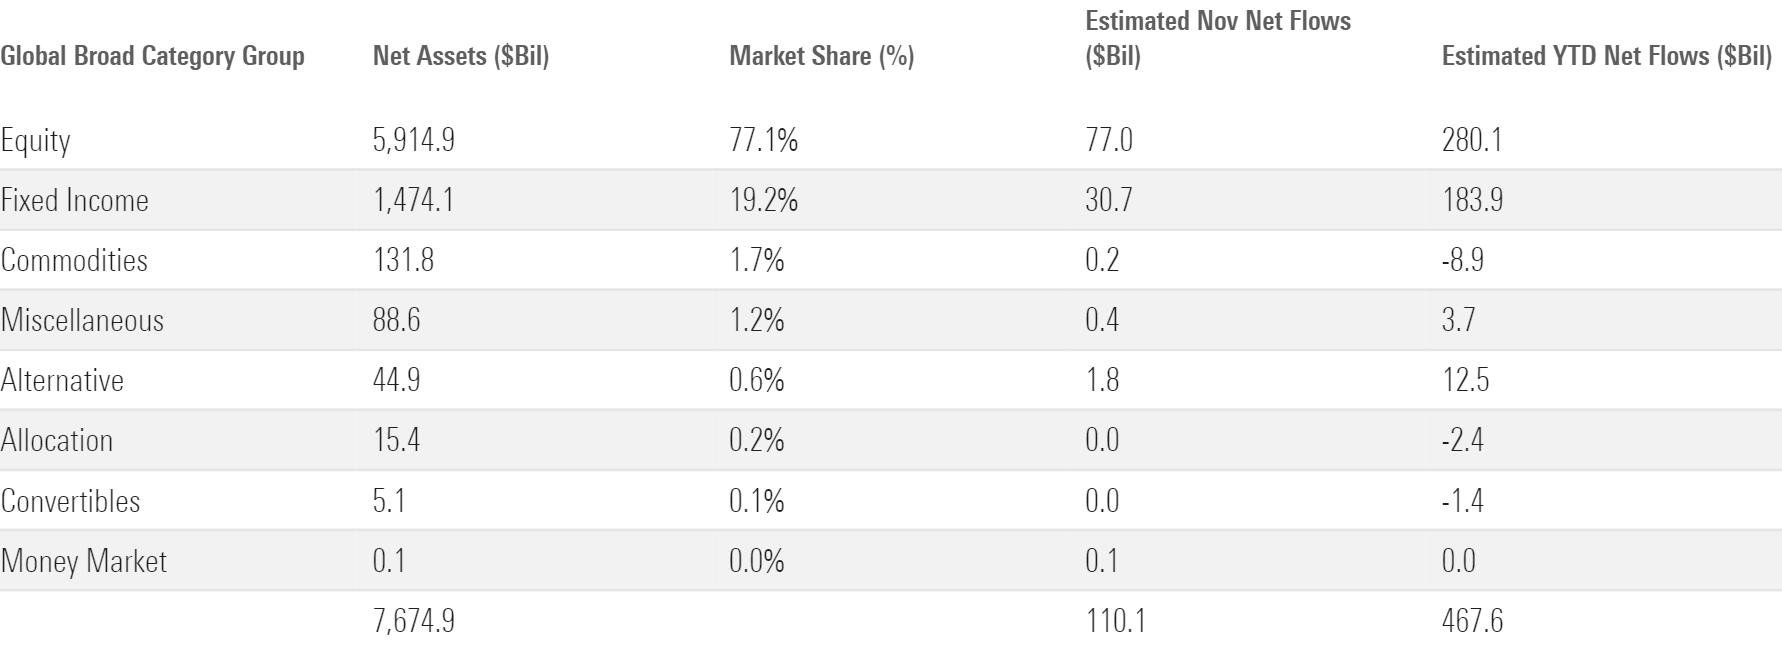
Investors piled a whopping $110 billion of new money into ETFs last month. Scaling for size, that translates into a 1.57% organic growth rate—their best since March 2021. After a year of touch-and-go flows, ETFs are suddenly poised to blow past the $500 billion annual inflow threshold that looked well out of reach just a month ago. They have raked in $477 billion so far this year.
Exhibit 2: November Flows Across Morningstar Broad Category Groups
Stock ETF Flows Shine
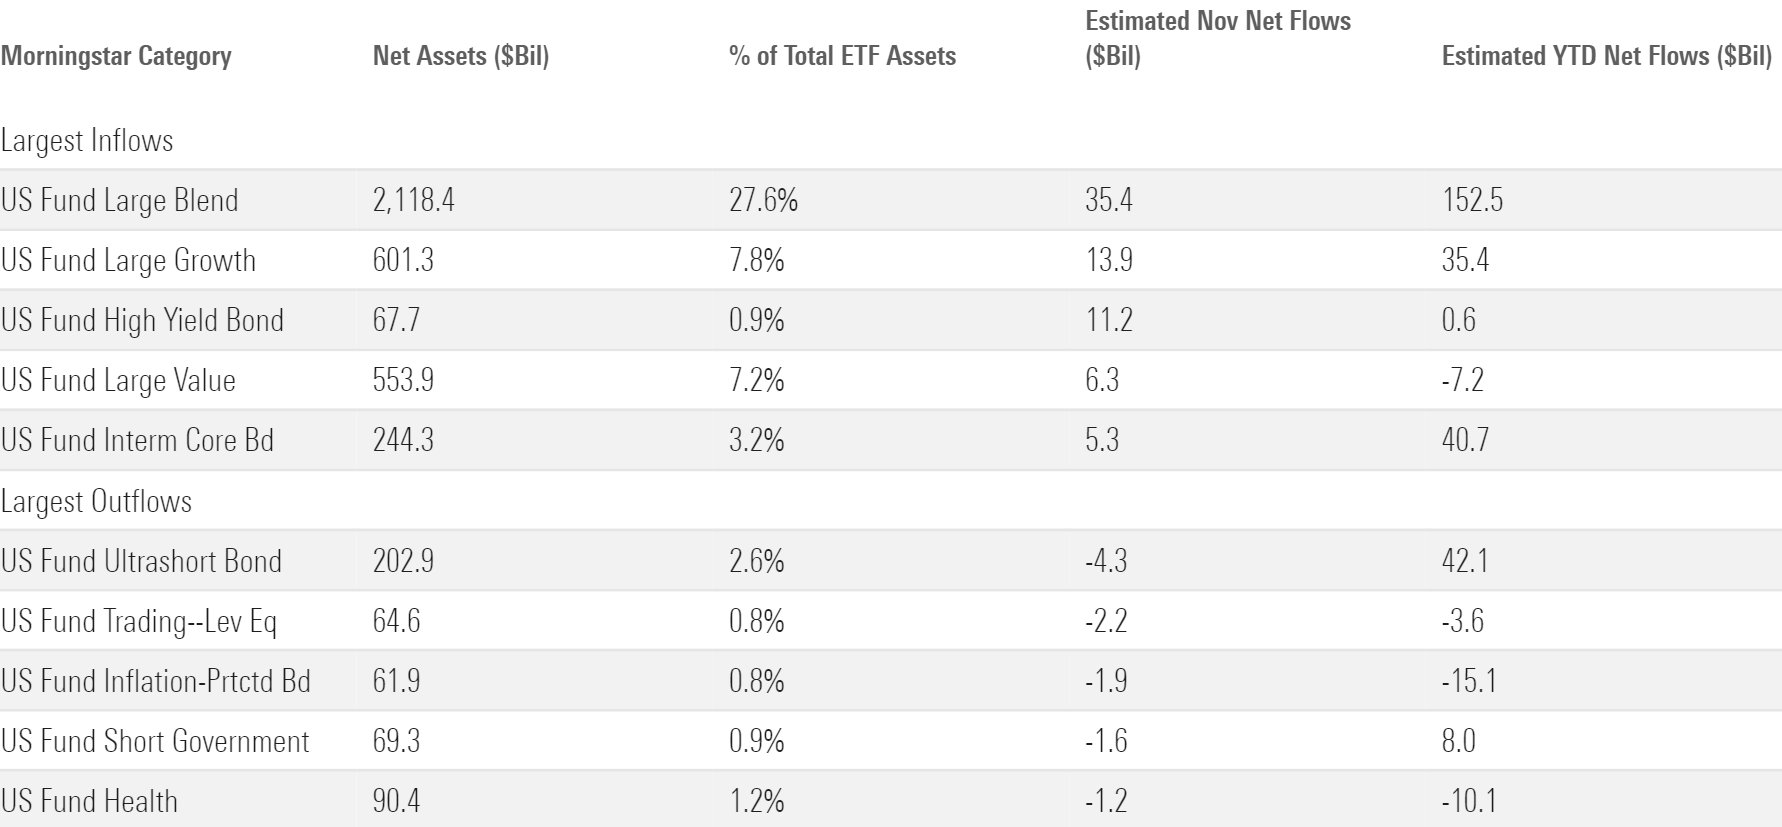
A strong month in the markets was all investors needed to reload on stock ETFs. U.S. equity funds led the charge, where all nine Morningstar Categories in that cohort finished November with inflows. Predictably, large-blend funds set the pace, with $35 billion of new money. But inflows into the large-growth category were even more noteworthy. Led by the irrepressible Invesco QQQ Trust QQQ, the category hauled in $14 billion—its second-largest monthly intake ever. Large-value funds have navigated a difficult year, but even they joined the action with a $6 billion haul, their best month since last December.
Exhibit 3: Morningstar Categories With the Largest November Flows
Investors weren’t as enthused about funds that target foreign stocks. The international-equity segment pulled in $6 billion—a respectable sum, but a far cry from their domestic counterparts, even when scaled for assets. China-region funds had a standout month, however. Their $476 million November haul doesn’t jump off the page, but it marked the category’s first month of inflows since January. The Morningstar China Index has pulled back 8.7% over the first 11 months of 2023—about 18 percentage points behind the Morningstar Global Markets Index.
Sector-equity funds righted the ship with $5 billion of November inflows after bleeding a total $16 billion over the three months prior. Consistent with the month’s bullish theme, investors favored cyclical sectors to defensive ones. Technology funds reeled in $5 billion to carry the day, while healthcare and consumer defensive strategies shed about $1 billion apiece. That all said, unless the sector-equity group can build on this month with more than $4 billion of December inflows, 2023 will mark its worst month of outflows on record (breaking the record set last year).
Exhibit 4: ETFs With the Largest November Flows
Bond ETF Flows Quietly Pile Up
Bond ETFs played second fiddle to stocks in terms of absolute inflows last month, but their 2.2% organic growth rate handily outpaced their equity counterparts. So far in 2023, bond ETFs’ $184 billion haul translated into a stellar 14.3% organic growth rate, well ahead of stock ETFs’ 5.6% clip.*
Low-risk, conservative bond portfolios have supercharged the broader fixed-income cohort for much of 2023, but in November, it was the riskier categories that took the reins. Entering November, high-yield bond funds had shed $10.4 billion on the year. They pulled in $11.2 billion in November—their best month of absolute flows on record. Corporate bond funds collected more last month ($4.5 billion) than they did over the 10 months prior ($2.2 billion).
Meanwhile, uber-safe ultrashort bond funds bled $4.3 billion in November, the most among all Morningstar Categories. It led all fixed-income categories with nearly $47 billion in year-to-date flows entering the month. Government-bond ETFs collected $3 billion in November—a fine sum, but not much compared with the rest of the group and a far cry from the ransoms they pulled in earlier this year. Clearly, the risk-on sentiment that drove investors into stock ETFs played a role in shaping fixed-income flows as well.
Quick Hits From Around the Market
- Sustainable funds barely joined in on the fun. After pulling in a modest $1.2 billion on the month, the cohort has shed $5.6 billion for the year to date through November.
- Ditto for thematic funds. They bled over $500 million as outflows from energy transition funds like iShares Global Clean Energy ETF ICLN battled outflows. Perhaps investors are growing weary of timing their thematic fund purchases poorly.
- Active ETFs continued their dominant 2023 campaign in November. Investors dumped about $21 billion into them, pushing their year-to-date inflows to over $116 billion. That helped build active ETFs’ cushion on their record-setting year, as they collected $90 billion in 2022.
- Momentum for nontraditional-stock and, more specifically, covered-call ETFs seems to be dissipating. The derivative income category, which houses all covered-call funds, collected about $1.1 billion in November—still a decent sum, but not up to snuff with the monthly $2 billion-plus inflows they routinely collected in late 2022 and early 2023. JPMorgan Equity Premium Income ETF JEPI posted its mildest month of inflows since January 2021, when it was just eight months old.
- On the other hand, momentum seems to be building for alternatives ETFs. They absorbed about $1.8 billion in November, their best month since October 2021. That’s five consecutive months of inflows north of $1.5 billion for the cohort that has seized the rise of buffer ETFs, which use options to ensure investors have a floor or cap on their fund performance. Read more about the nuances of buffer ETFs here.
- Some contrarians faded the overwhelming bullish sentiment last month. Inverse-equity funds collected $1.8 billion, while their leveraged-long counterparts bled nearly $2.2 billion. For their sake, let’s hope investors who “sold the rip” didn’t move too early in the month.
Fund Families
The “Big Three″ ETF providers affirmed their place atop the market in November. Their ranking for November inflows matched their ranking by total assets: iShares led the way with $32 billion, followed by Vanguard with $23 billion and State Street with $18 billion.
Exhibit 5: November Flows for the 10 Largest ETF Providers
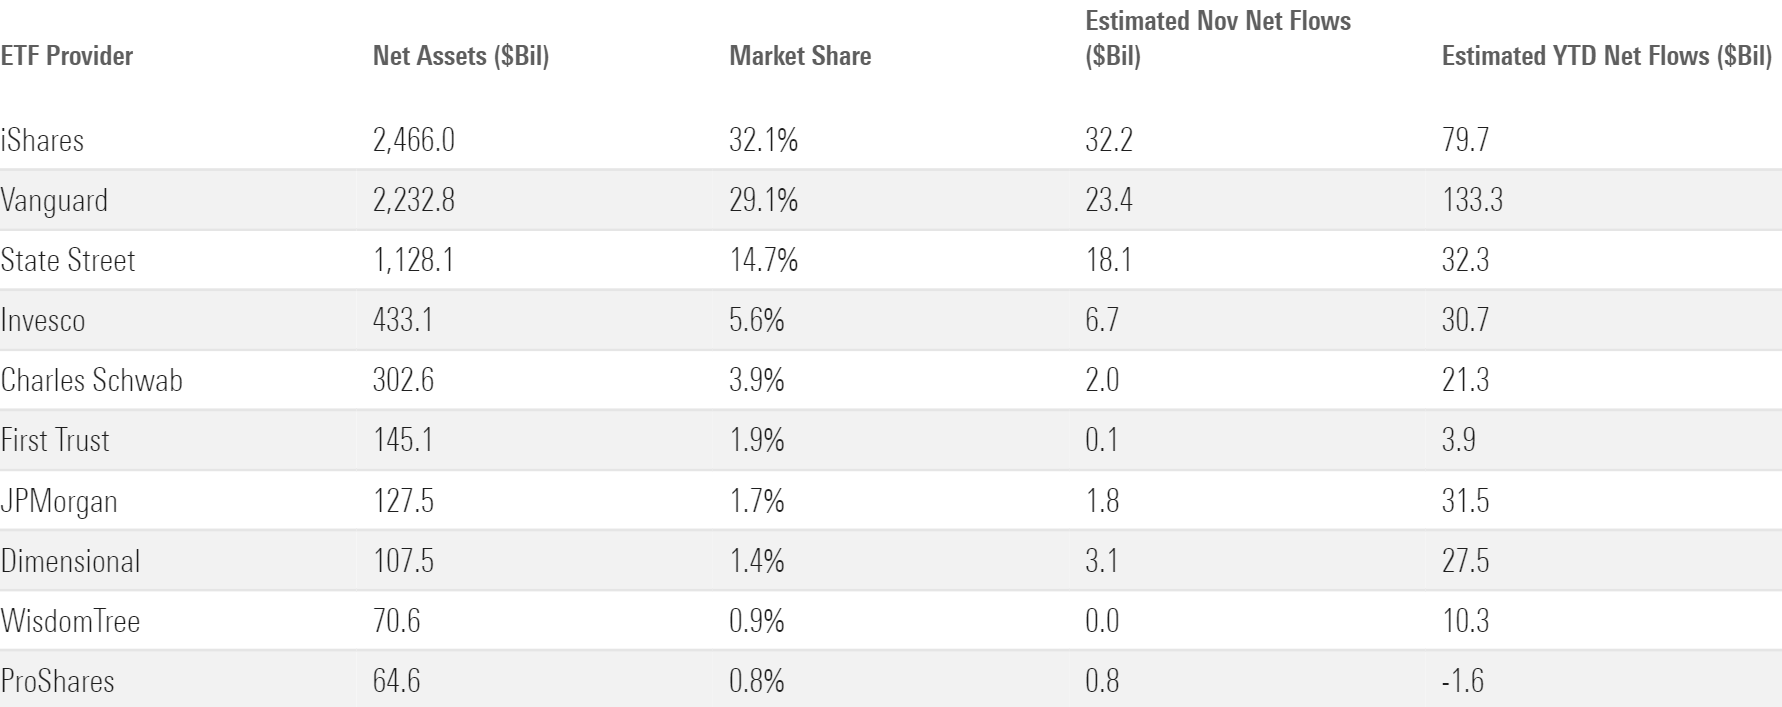
IShares enjoyed its most lucrative month since last May because its equity offerings finally returned to favor. Those funds collected $17 billion on the month after toiling in outflows all year, a welcome breakthrough for the indexing giant. Vanguard has had no such troubles. Like it has all year, it leaned on stock and bond inflows at nearly a three-to-one rate—a recipe that has propelled it well ahead of the ETF-provider pack in 2023 flows. State Street’s solid month owes partly to its suite of sector ETFs. While the $1.9 billion they absorbed doesn’t jump off the page, it’s an improvement from the three consecutive months that preceded November, over which those funds bled more than $7 billion in total.
Fidelity is no newbie to the world of ETFs, but November was its coming-out party. It entered the month with roughly $36 billion in ETF assets and finished with nearly $49 billion. That’s the product of both excellent market returns and a slew of mutual fund-to-ETF conversions—almost $9 billion worth of them, to be exact. Fidelity is the second-largest mutual fund provider in the United States. It could climb quickly up the ranks of the largest ETF providers should it move more of its behemoth mutual funds into the ETF vehicle.
Real Estate ETFs Look Undervalued Despite Stellar November
The fair value estimate for ETFs rolls up our equity analysts’ fair value estimates for individual stocks and our quantitative fair value estimates for stocks not covered by Morningstar analysts into an aggregate fair value estimate for stock ETF portfolios. Dividing an ETF’s market price by this value yields its price/fair value ratio. This ratio can point to potential bargains and areas of the market where valuations are stretched.
Exhibit 6: The 10 Most Under- and Overvalued Analyst-Rated ETFs
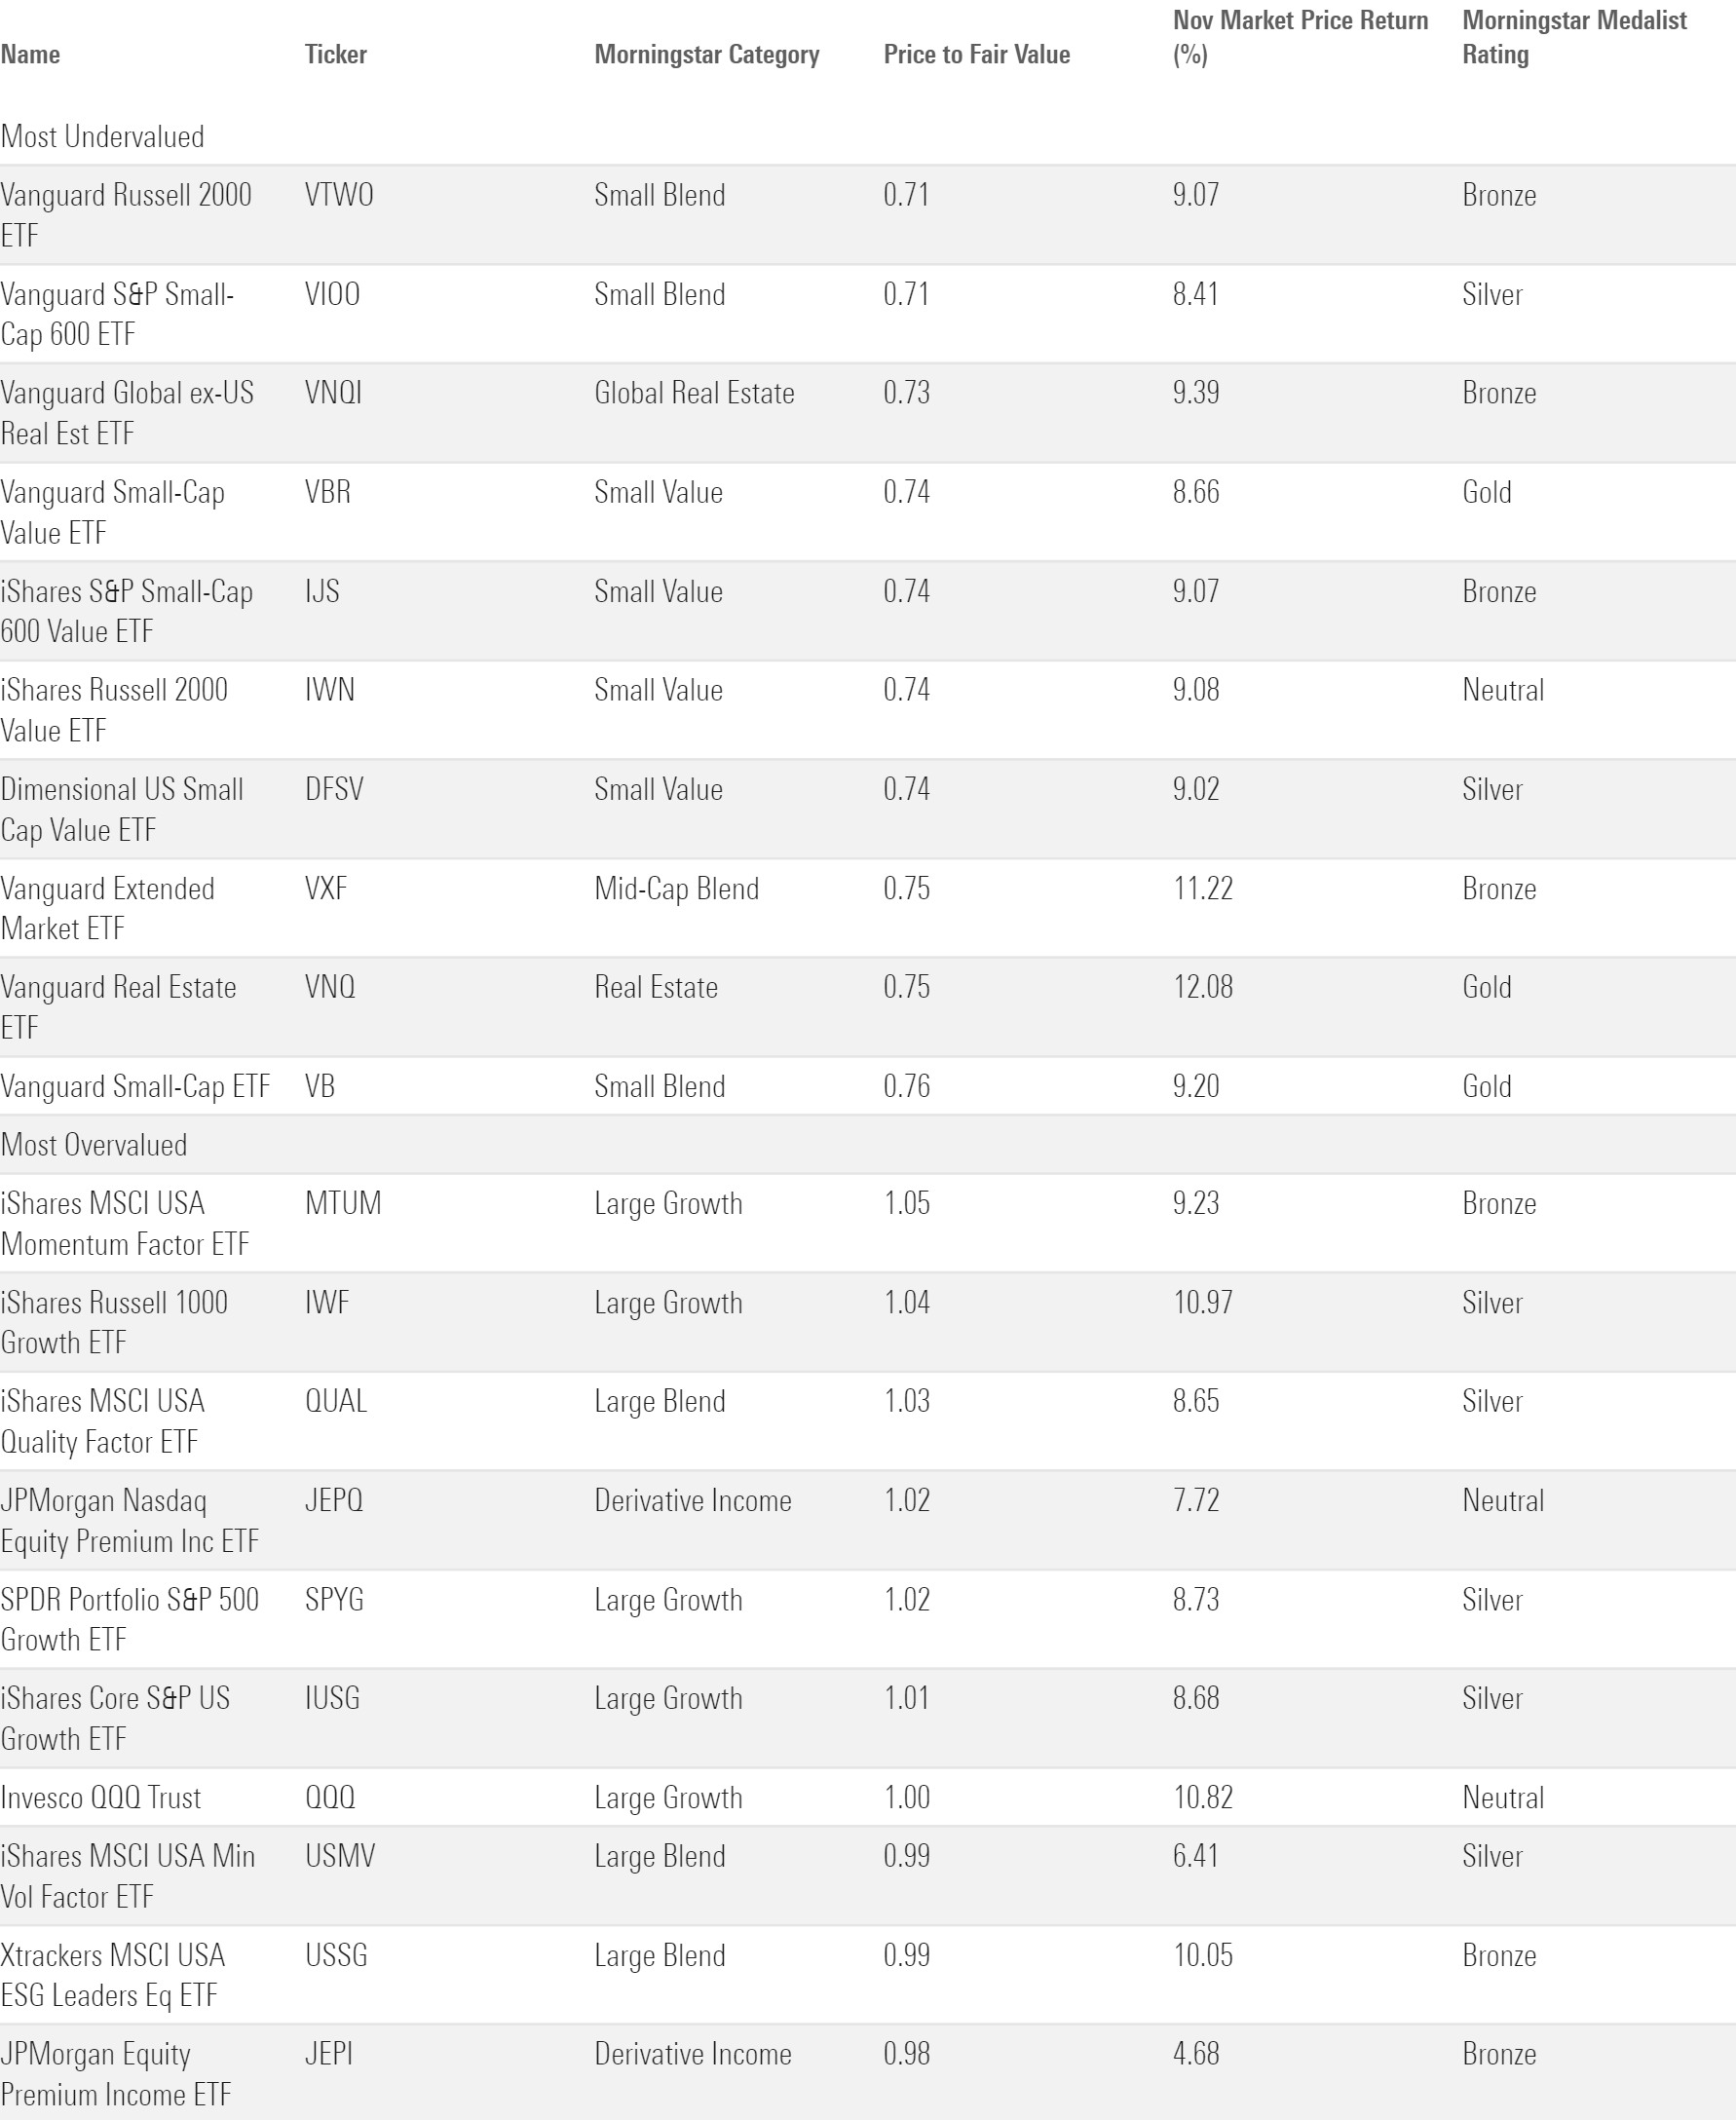
The widespread November rally pumped up price/fair value ratios all over the board. IShares MSCI ACWI ETF ACWI, which touches much of the global stock market, saw its ratio climb from 0.81 to 0.93 after it gained 8.9% in November. That sub-one ratio indicates that global stocks may still be undervalued, however, and certain pockets of the market still sport discounts fit for Black Friday.
U.S. small-value funds head up that list. The six analyst-rated small-value funds traded 25% below their fair value as of November 2023—most among all broad-based Morningstar Categories. Subpar performance explains most of the discount: iShares S&P Small-Cap 600 Value ETF IJS scratched out a 1.2% gain for the year to date through November—about 19.5 percentage points behind IVV. Small-value funds have tested investors’ patience, but they were neck-and-neck with their larger peers last month and have plenty of room to run moving forward.
For more concentrated investors, no sector looked as cheap as real estate when November concluded. Vanguard Real Estate ETF VNQ traded at a paltry 0.75 price/fair value ratio—after it notched a 12.1% return in November. The REITs this strategy favors tend to be quite sensitive to interest-rate fluctuations. The fund may continue to climb should the market continue to price in a lower-rate regime.
*This OGR calculation excludes trading instruments in the Miscellaneous U.S. Category Group.
The author or authors do not own shares in any securities mentioned in this article. Find out about Morningstar’s editorial policies.
/cloudfront-us-east-1.images.arcpublishing.com/morningstar/T2LGZCEHBZBJJPPKHO7Y4EEKSM.png)
/d10o6nnig0wrdw.cloudfront.net/07-25-2024/t_56eea4e8bb7d4b4fab9986001d5da1b6_name_file_960x540_1600_v4_.jpg)
/cloudfront-us-east-1.images.arcpublishing.com/morningstar/BU6RVFENPMQF4EOJ6ONIPW5W5Q.png)
:quality(80)/s3.amazonaws.com/arc-authors/morningstar/30e2fda6-bf21-4e54-9e50-831a2bcccd80.jpg)