
With Yields Above 4.6%, Intermediate Bonds Have Passed a Tipping Point
Intermediate-term government-bond funds have reached escape velocity, providing a cushion against potential price declines.
/s3.amazonaws.com/arc-authors/morningstar/eda620e2-f7a7-4aef-bb6c-3fb7f1ac7a38.jpg)
Back in September, I wrote about “escape velocity,” which bonds can achieve when their yields are high enough to offset potential future principal losses if interest rates rise.
I initially wrote about this concept because short-term U.S. Treasury bonds of one to three years had reached escape velocity and stayed there. At long last, bonds once again mattered.
Escape Velocity, iShares 1-3 Year Treasury Bond ETF SHY
If they mattered then, they matter even more now! Yields across the curve, but especially at the long end, have soared as investors priced in the likelihood of interest rates remaining elevated for longer than previously anticipated. The yield on the U.S. 10-Year Treasury Bond rose by 0.8 percentage points from the end of August to the end of October 2023.
U.S. Treasury Yield Curve, August vs. October
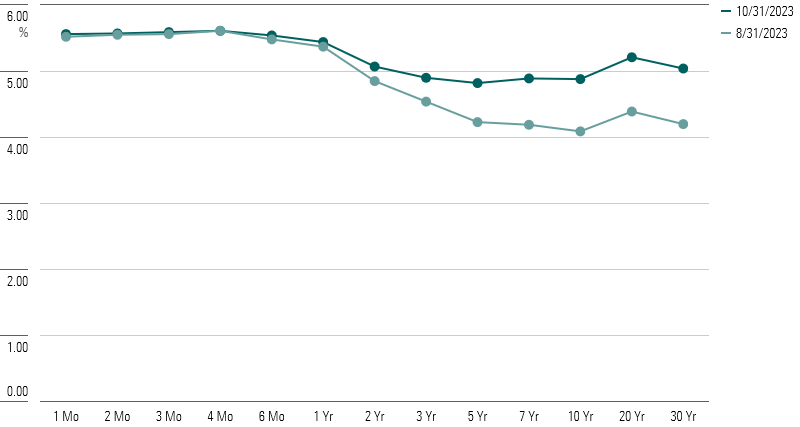
While that’s been painful for bondholders, the good news is that it means that even more segments of the yield curve have reached escape velocity. Short-term bonds look even more attractive now than they did just two months ago. A one-to-three-year bond fund could theoretically shoulder a 2.7% rise in interest rates in a given year and still produce a positive return for that year. Now, even some intermediate-term government-bond funds pay enough in income to offset up to a 1% rise in interest rates, as shown below.
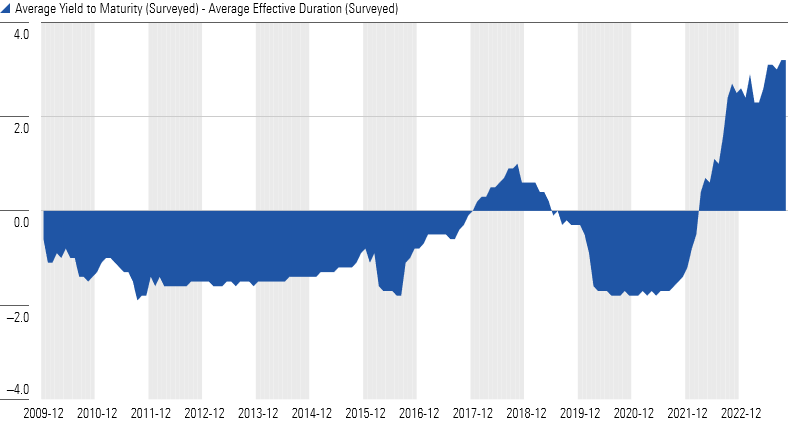
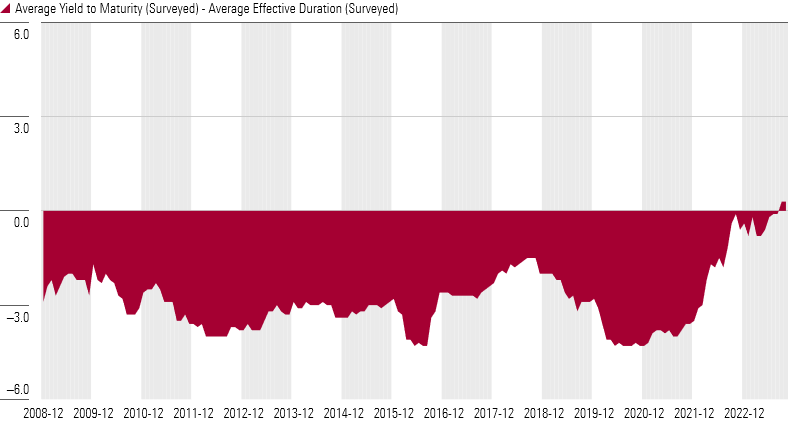
Intermediate-Term Bonds Have Reached Escape Velocity
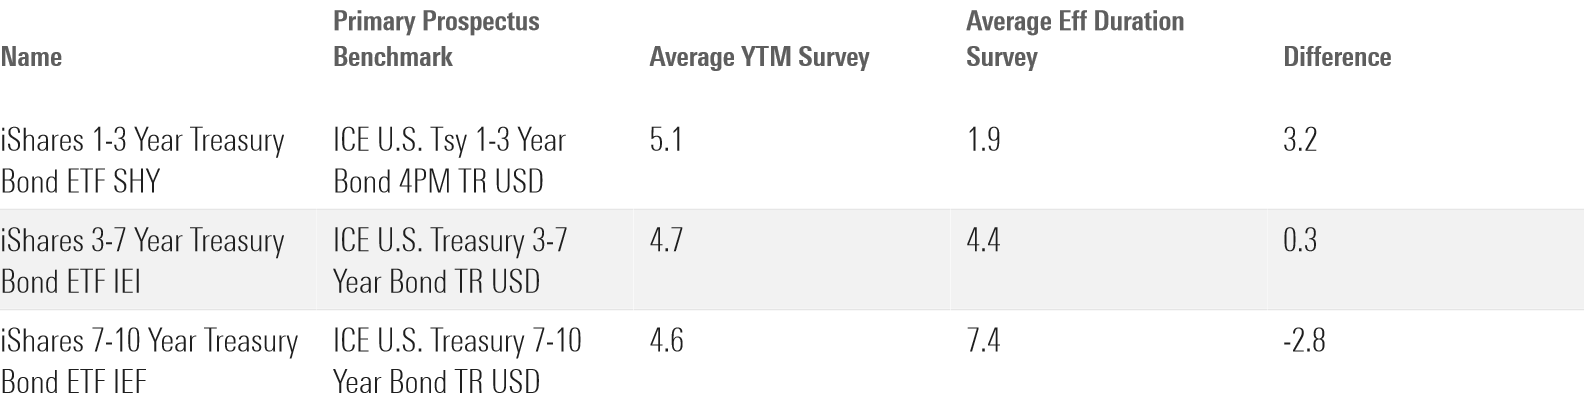
The margin is wafer-thin, to be sure. The yield on bonds maturing in three to seven years exceeds duration by a mere 0.3 percentage points, after all. But it’s the first time a positive gap has opened since the global financial crisis.
Escape Velocity, iShares 3-7 Year Treasury Bond ETF IEI
That said, all of these figures are nominal, and returns may be positive on a nominal basis but negative in real terms. Even just in nominal terms, it’s entirely possible for bond funds to lose money in the short run—interest-rate moves can be swift, while coupons are steady. Finally, unlike stocks, bonds expire. Escape velocity lasts only as long as the bonds in your portfolio do.
Why Not Long-Term Government Bonds?
Despite the spike in yields, investors continue to pour money into intermediate- and long-term bond funds, as shown below.
Net Flows of U.S. Short-, Intermediate-, and Long-Term Government Bonds as of September 2023
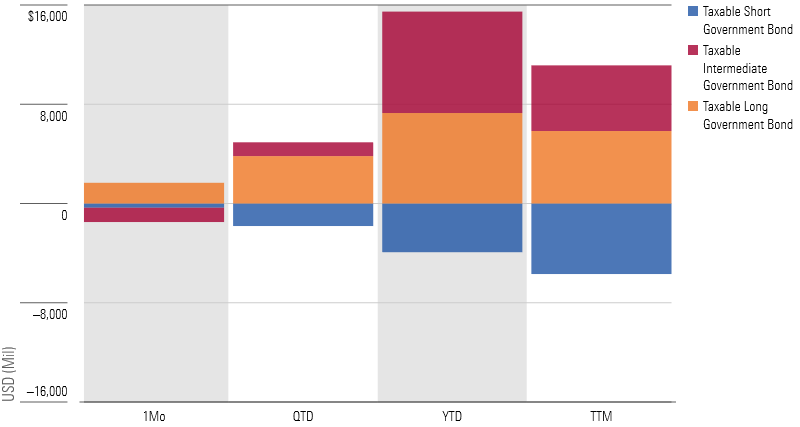
This may be puzzling at first. Flows tend to follow performance, and owing to their interest-rate sensitivity, long-term bonds have performed poorly. (The long government Morningstar Category average lost 9.1% over the past year through October 2023, while the short government Morningstar Category was up 2.2%.) And yet, investors indicated they are willing to accept these conditions and have spurned higher yields on the shorter end of the curve.
Why? Right now, the yield curve is inverted. (That just means that, for U.S. Treasuries, short-term bonds are trading at yields that are higher than those of long-term bonds.) When investors flock to long-term bonds during this type of environment, it implies that they expect that relationship to change.
Typically, that relationship changes because the Federal Reserve cuts rates, causing yields on short-term bonds to fall and the yield curve to un-invert. Cue the punch bowl!
Spread Between the U.S. 10-Year and U.S. Two-Year Government Bonds vs. Effective Federal-Funds Rate, 1976-2023
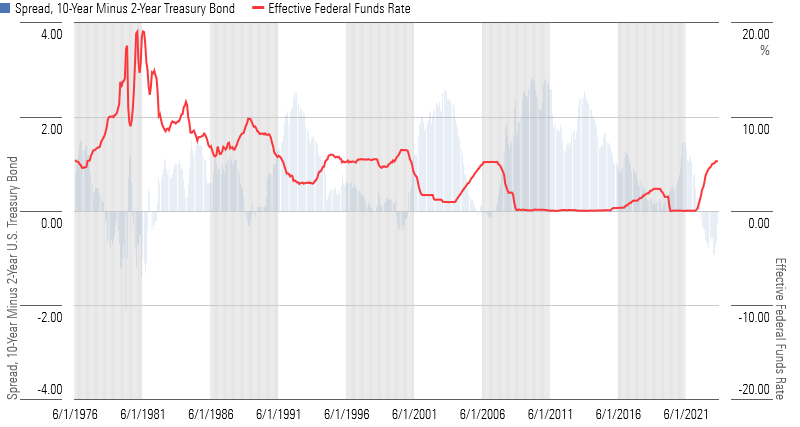
Except that’s not what’s happened so far. (Although if history is any guide, it very well still could.) True, the inversion is weakening—investors correctly called that part. Problem is, the end of the curve that’s moving is the wrong end. What’s happened in the past few months is that the yields on longer-term bonds have actually continued to rise, while short-term bonds effectively have not budged.
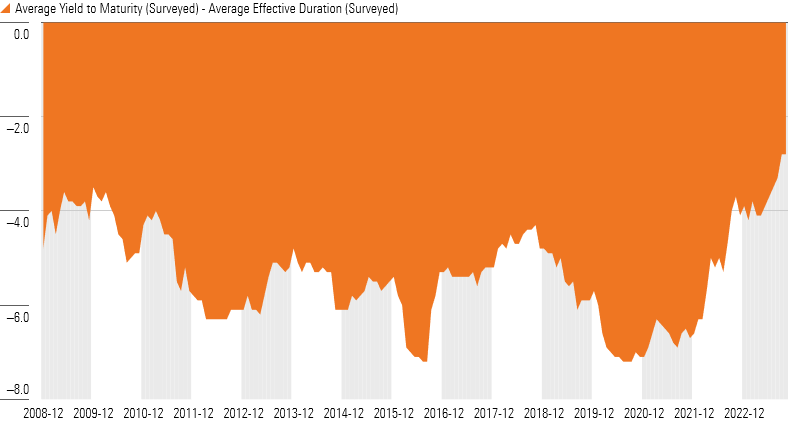
That’s not great news for the investors who flocked to long-term government-bond funds over the past year or so, but it also means that long-term bonds are inching closer to escape velocity. Duration is still a heavy hammer, greater than these funds’ average yield to maturity. But with 10-year bonds now yielding more than 5%, the gap between the two is the narrowest it has been in almost 15 years—since Morningstar started collecting surveyed yields to maturity from these exchange-traded funds.
Escape Velocity, iShares 7-10 Year Treasury Bond ETF IEF
Whether this gap will continue to close, or where yields go from here, is anyone’s guess. There are plenty of other risks to be mindful of, too, including the impact of inflation on nominal instruments. When considering an allocation to government bonds, the most important thing to think about is the role it is meant to serve in your portfolio. But as these tipping points illustrate, bonds have not had this much momentum in a long time.
The views expressed here are the author’s.
What to Do With Your Stock and Bond Investments Now
The author or authors do not own shares in any securities mentioned in this article. Find out about Morningstar’s editorial policies.
/cloudfront-us-east-1.images.arcpublishing.com/morningstar/EC7LK4HAG4BRKAYRRDWZ2NF3TY.jpg)
/cloudfront-us-east-1.images.arcpublishing.com/morningstar/6ZMXY4RCRNEADPDWYQVTTWALWM.jpg)
/cloudfront-us-east-1.images.arcpublishing.com/morningstar/URSWZ2VN4JCXXALUUYEFYMOBIE.png)
:quality(80)/s3.amazonaws.com/arc-authors/morningstar/eda620e2-f7a7-4aef-bb6c-3fb7f1ac7a38.jpg)