
The Ultimate Buy and Hold Portfolio
Would stashing away 1986′s stock-market leaders have been a sound investment strategy?
/s3.amazonaws.com/arc-authors/morningstar/1aafbfcc-e9cb-40cc-afaa-43cada43a932.jpg)

Old School
Recently I obtained a table of the 10 largest U.S.-listed companies, as measured by market capitalization, in December 1986. One was a Dutch oil company, which I discarded, preferring to track only American firms. Here is the list.
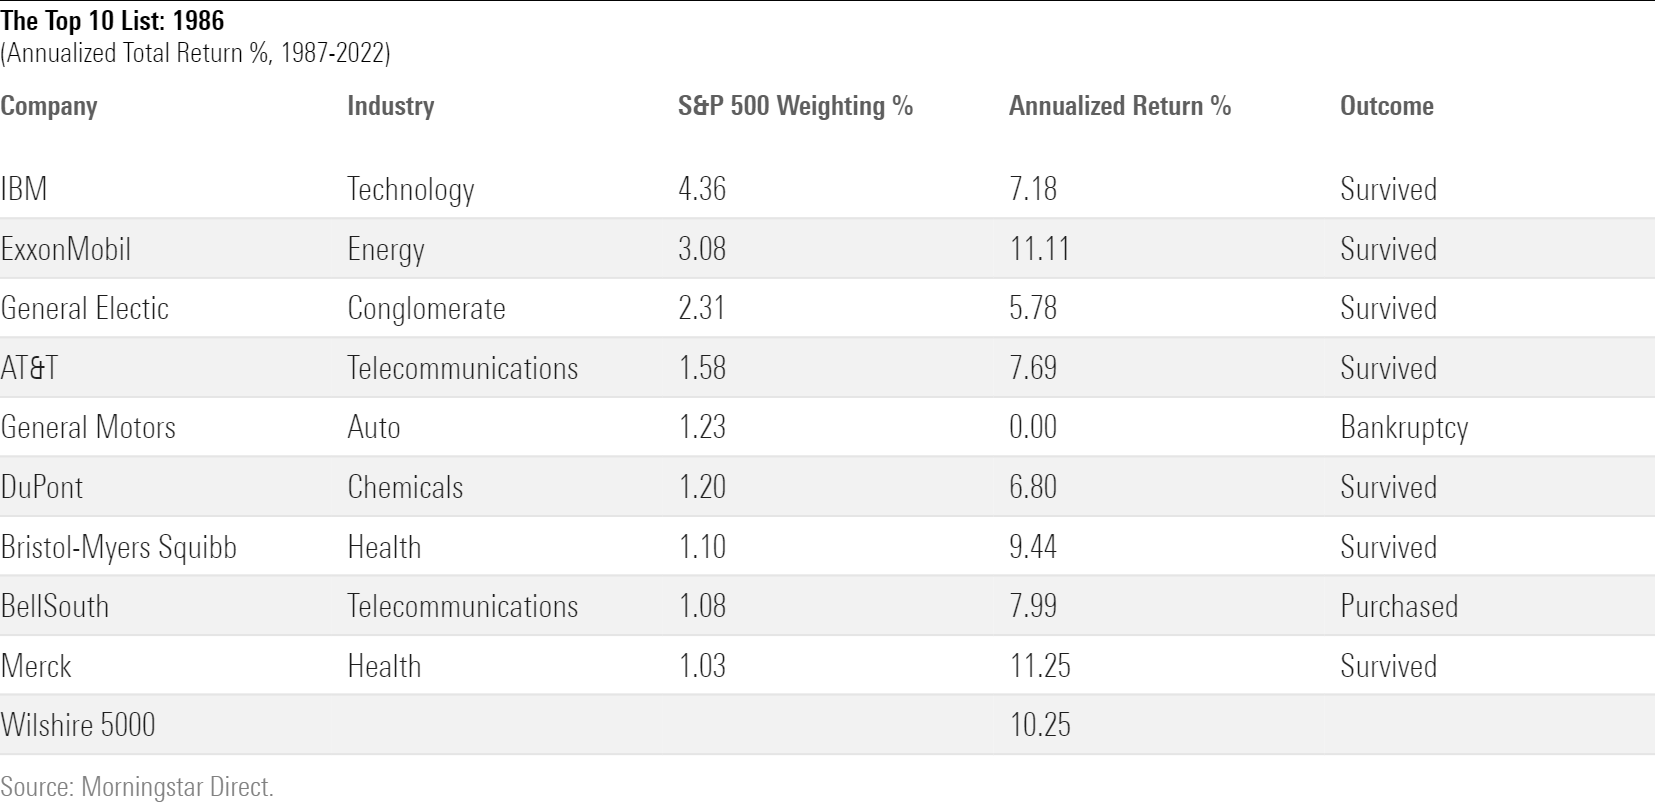
The stock market leaders during President Reagan’s second term were diversified: two telecommunications firms, two pharmaceutical providers, and members of five additional industries. All nine businesses remain operational, although only seven retain their original shares. BellSouth disappeared in 2007, following its purchase by AT&T T, and General Motors GM went bankrupt in 2009. The latter has since reorganized, but its previous shares were rendered worthless.
The largest position, by a comfortable margin, was IBM IBM. Although young people these days have heard of the company, most know relatively little about it. IBM has little retail presence and no longer ranks among the 50 biggest U.S. firms. In 1986, though, Big Blue was omnipresent. It was worth more than 3 times as much any other American business, save for ExxonMobil XOM, General Electric GE, and AT&T. The company was the Apple AAPL of its time.
(The irony of that amuses me, since my first job out of college was at IBM, where my shirts were white and my lunch drinks were nonalcoholic. We held Apple in polite contempt. It viewed itself as a legitimate IBM competitor, David against our Goliath, but we knew better. Apple would never be a serious rival.)
Future Performance
Despite shedding more than 90% of its S&P 500 weight—IBM currently accounts for just 0.33% of the index—the stock has nevertheless gained an annualized 7.18% over the ensuing 36 years, making for a cumulative nominal profit of 1115%. Its after-inflation gain was 416%. Such has been the strength of the equity markets: The index’s single biggest loser, as represented by market-cap weighting, has nevertheless quadrupled its purchasing power.
That said, five of the remaining eight stocks outgained IBM, as did the overall stock market. That the company’s shares were winners in absolute terms owes to the stock market’s rising tide rather than to the quality of the boat. The next—admittedly busy—chart tracks the growth of $10,000 for each stock over those 36 years, along with the performance of the Wilshire 5000.
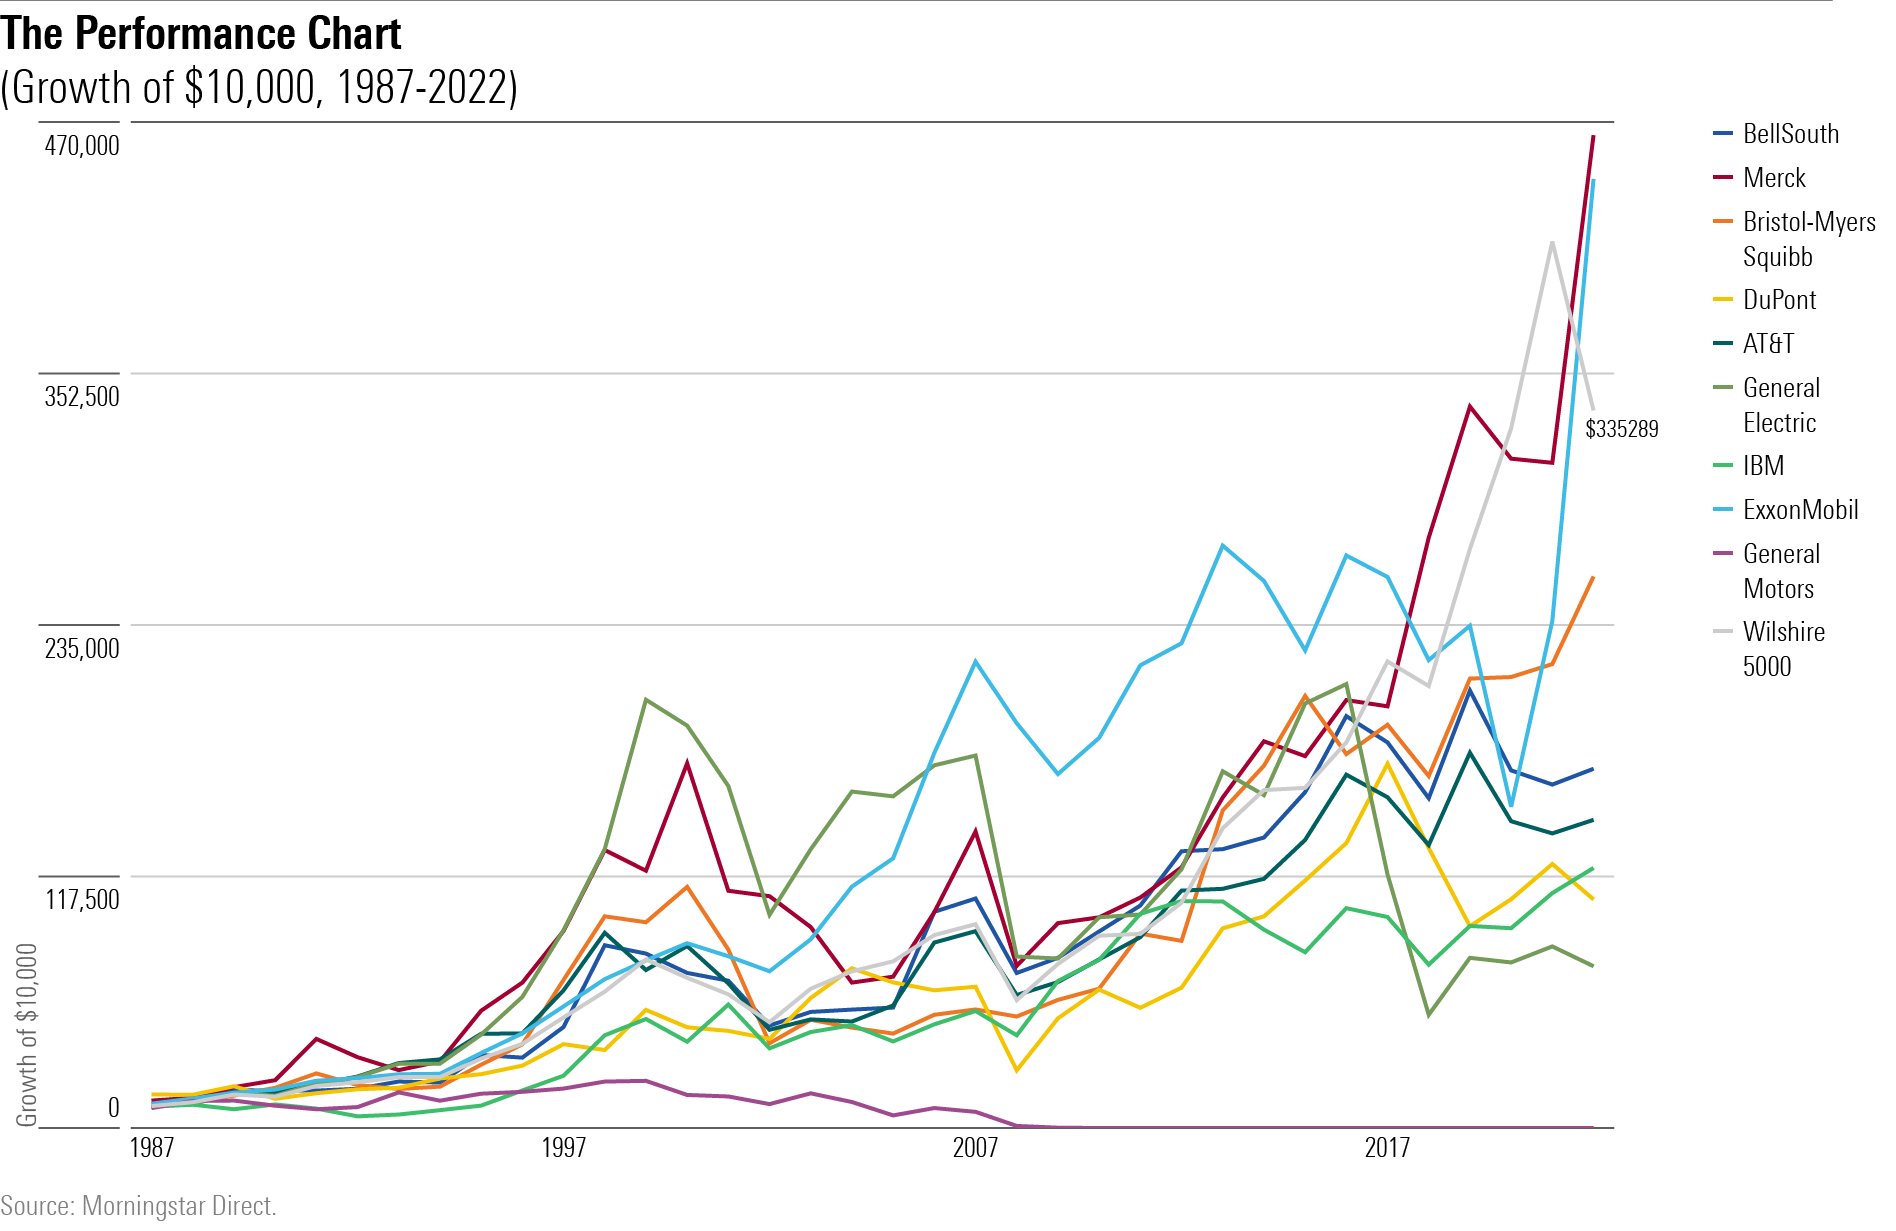
(For BellSouth, I used the return of its shares through December 2006, then switched to AT&T’s performance thereafter.)
Most Stocks Stink
In all, a disappointing showing. The problem is not that seven of the nine stocks trailed the overall market. That is par for the course. Over the long term, most stocks in a portfolio inevitably trail the overall rate of return. This occurs because, thanks to the power of compounding, the best-performing issues post huge cumulative profits. They carry the portfolio; the rest come along for the ride.
However, none of 1986′s market leaders were sufficiently spectacular. The strongest performer, Merck MRK, beat the Wilshire 5000 only by an annualized percentage point. That margin was too small to compensate for the portfolio’s losers. If, on the other hand, the 1986 leaders’ list had held a stock that averaged 18% per year, that position alone would have sufficed. The portfolio would have outgained the market index even if the other eight companies had all vanished.
(Although rare, 18% annualized returns from 1987 through 2022 did occur. Sixteen American firms exceeded that mark. One, I blushingly confess, was Apple.)
As seen in the chart, although the results for Merck and ExxonMobil land above the Wilshire 5000′s gray line, they clearly occupy less excess space than do the seven lines below them. The picture confirms that since December 1986, a portfolio consisting of that date’s nine largest U.S. equities has trailed the overall marketplace as represented by the Wilshire 5000.
The Numbers
Two questions arise. One, how large was the performance gap? Two, would changing the portfolio-weighting schemes meaningfully affect the results?
A further test addressed both issues. I created three hypothetical portfolios.
1) Original Weighting
This investment bought each stock in proportion to its December 1986 capitalization. Thus, IBM received a 25.7% weight, because its 1986 capitalization represented that amount of the group’s total, while Merck was allotted the smallest portion of the portfolio at 6.1%. Once those initial positions were established, the portfolio held its ground, making no trades whatsoever.
This tactic, it must be confessed, is not historically realistic. It assumes that each company’s dividends were used to purchase new shares, which was not common practice back then. However, it is a reasonable shortcut for my calculation, and it’s a plan that investors can easily employ today, thanks to modern dividend reinvestment programs.
2) Equal Weighting
This tactic resembled its predecessor, except that each position received the same initial stake, amounting to 1/9th of portfolio assets. From there, the process was identical. No further trades, with dividends reinvested.
(Note: With each of these methods, the General Motors holding vaporized. True, the company paid dividends for the first 20 years of the exercise. But because those dividends were used to purchase additional company shares, rather than being spent elsewhere, the investor lost it all when GM filed for bankruptcy.)
3) Annual Rebalancing
The final approach begins in the same fashion as the second tactic, by allocating equally to each company, but then diverges by rebalancing annually. The other two portfolios let their stocks ride; this one does not.
Here are the results.
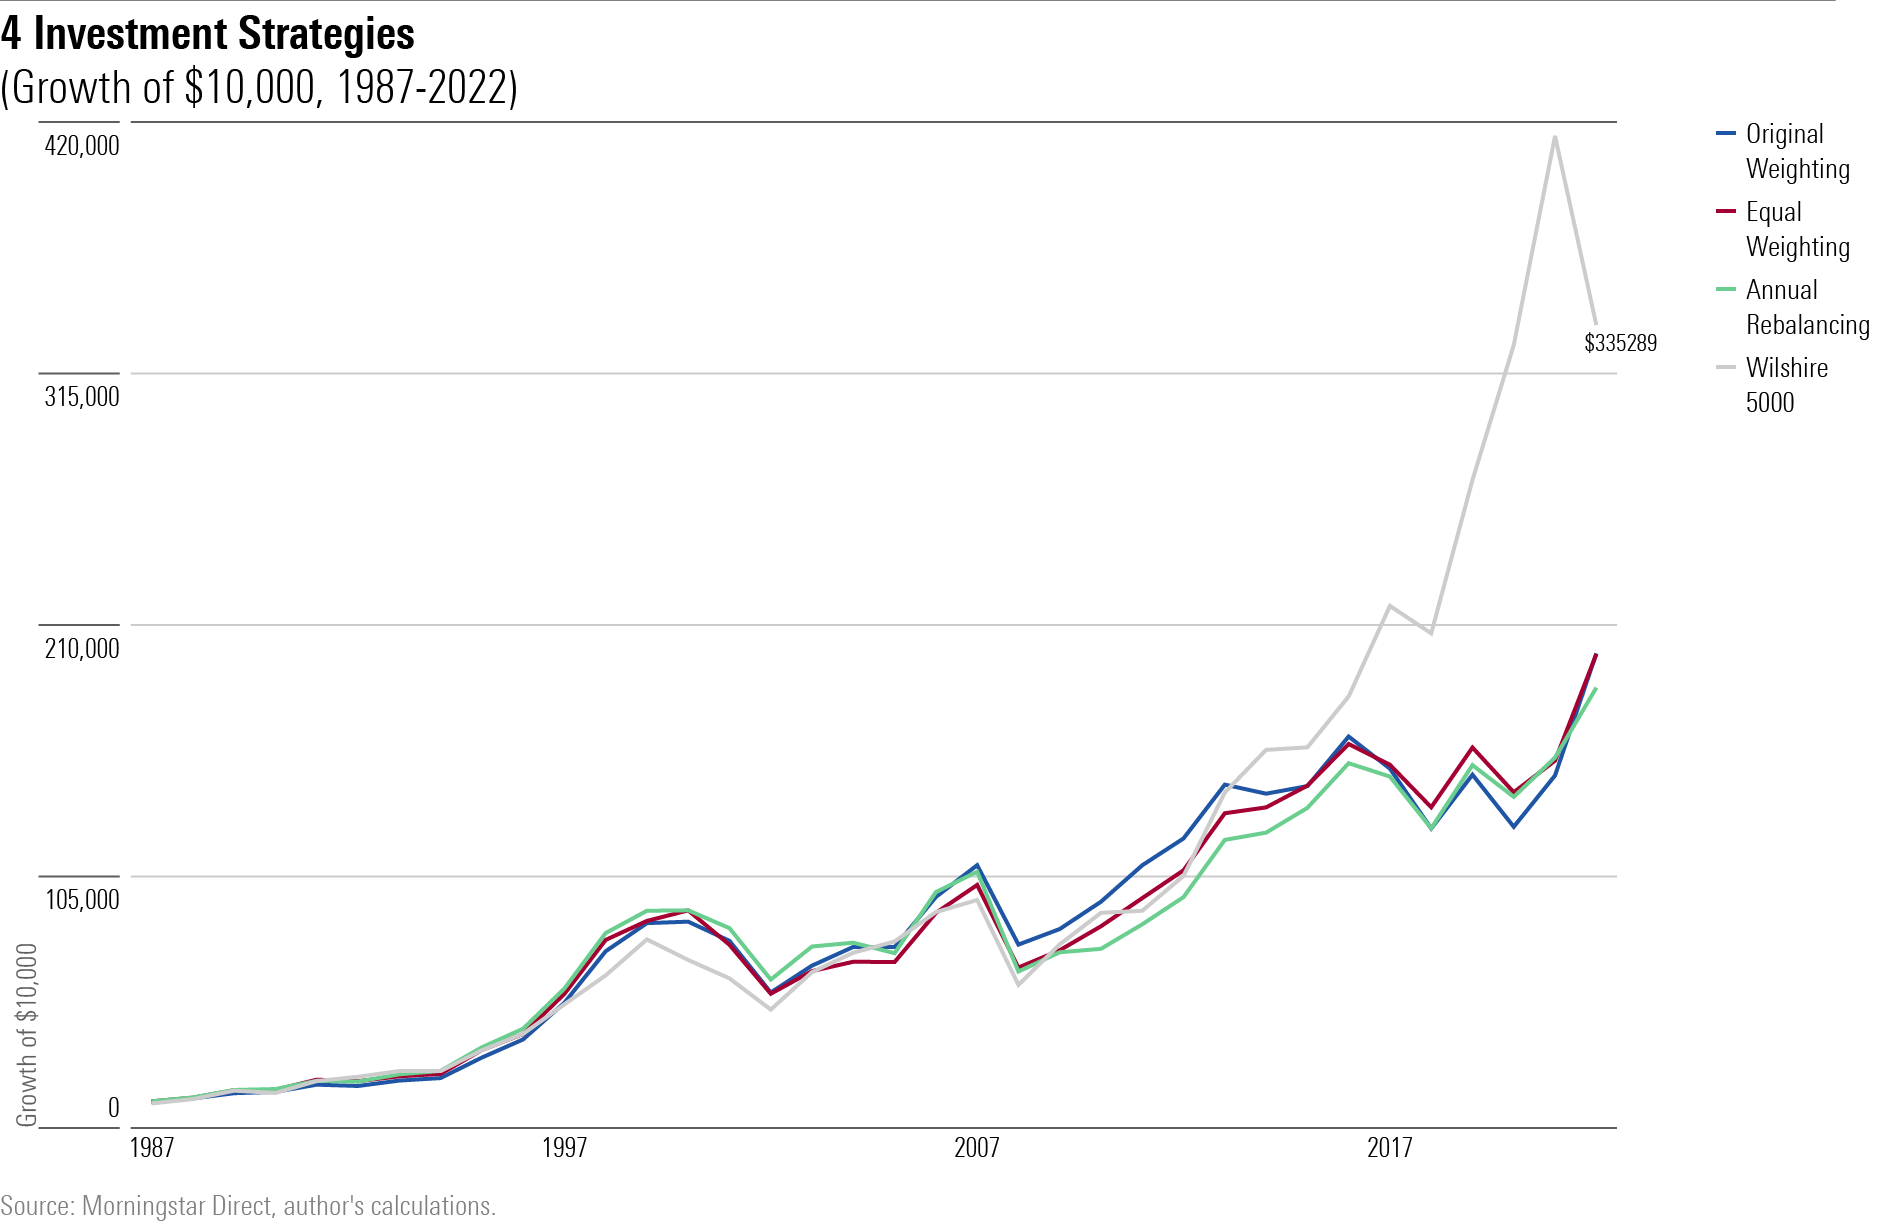
The lesson could not be simpler. Investing in last generation’s winners was a losing strategy. While the chart does not show the final values for the three portfolios, due to crowding in the presentation, they each badly lagged the index. The rebalanced portfolio fared worst, growing to $184,000, and the original weighted portfolio was best, at $198,000, but in the grand scheme of things those differences were but rounding errors. The index thrashed them all.
Conclusion
Doing nothing can pay. Morningstar’s Jeff Ptak showed that S&P 500 portfolios that go untouched for a decade, without accepting new companies into the fold, are fully competitive with the updated version of the index. And in my sequel to his article, I surfaced the real-life example of the Voya Corporate Leaders LEXCX, a mutual fund that has thrived for 90 years by standing still.
As demonstrated by this result, though, change can also be positive—particularly when the starting point consists of an era’s most popular investments. It is not strictly accurate to say that such securities have nowhere to go but down. They do, however, risk becoming outdated, as occurred with several members of the 1986 portfolio. It’s something to consider when pondering today’s leaders’ list.
The opinions expressed here are the author’s. Morningstar values diversity of thought and publishes a broad range of viewpoints.
The author or authors do not own shares in any securities mentioned in this article. Find out about Morningstar’s editorial policies.
/cloudfront-us-east-1.images.arcpublishing.com/morningstar/6ZMXY4RCRNEADPDWYQVTTWALWM.jpg)
/cloudfront-us-east-1.images.arcpublishing.com/morningstar/URSWZ2VN4JCXXALUUYEFYMOBIE.png)
/cloudfront-us-east-1.images.arcpublishing.com/morningstar/CGEMAKSOGVCKBCSH32YM7X5FWI.png)
:quality(80)/s3.amazonaws.com/arc-authors/morningstar/1aafbfcc-e9cb-40cc-afaa-43cada43a932.jpg)