
More Market Turmoil Doesn't Deter ETF Investors in February
Exchange-traded funds hauled in $69.5 billion in a turbulent February.
/s3.amazonaws.com/arc-authors/morningstar/30e2fda6-bf21-4e54-9e50-831a2bcccd80.jpg)
/s3.amazonaws.com/arc-authors/morningstar/a90ba90e-1da2-48a4-98bf-a476620dbff0.jpg)

Geopolitical conflict and inflation concerns made February another turbulent month in the markets. The Morningstar Global Markets Index--a broad gauge of global equities--finished February 2.24% lower than it started and has now shed 7.33% on the year. Bonds were not immune from the volatility. The Morningstar US Core Bond Index retreated 1.28% last month, pushing its slide to 3.35% for the year to date.
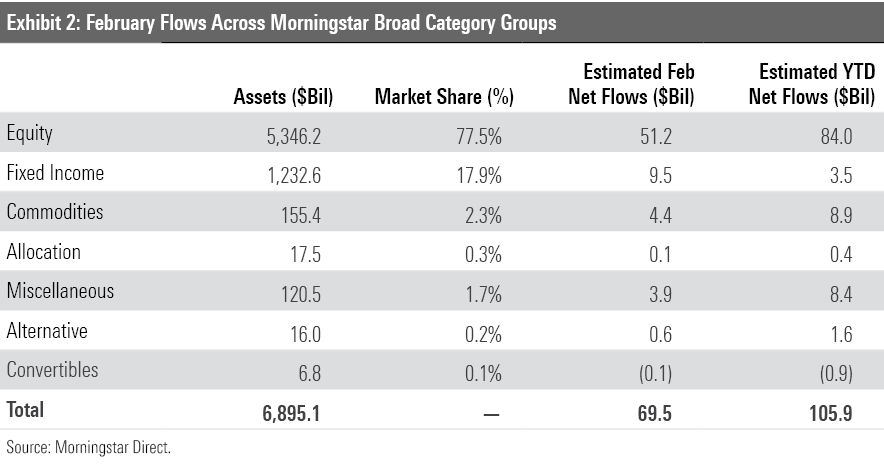
Rocky markets did not scare off investors, who poured $69.5 billion into exchange-traded funds in February--more than double the $35.2 billion they invested in ETFs in January. Stock ETFs continued to lead the way, fixed-income funds returned to positive flows territory, and commodities portfolios built on their momentum from January.
Here, we’ll take a closer look at how the major asset classes performed last month, where investors put their money, and which corners of the market look rich and undervalued at month’s end--all through the lens of ETFs.
Another Step Back
Exhibit 1 shows February returns for a sample of Morningstar Analyst-rated ETFs that serve as proxies for major asset classes. A blended global portfolio lost 2.14% in February, its second consecutive month in the red. Vanguard Total World Stock ETF VT, which comprises the portfolio’s stock sleeve, was the primary culprit. After a 2.77% decline in February, the fund has now lost 7.28% for the year to date in its first back-to-back monthly declines since September and October 2020.
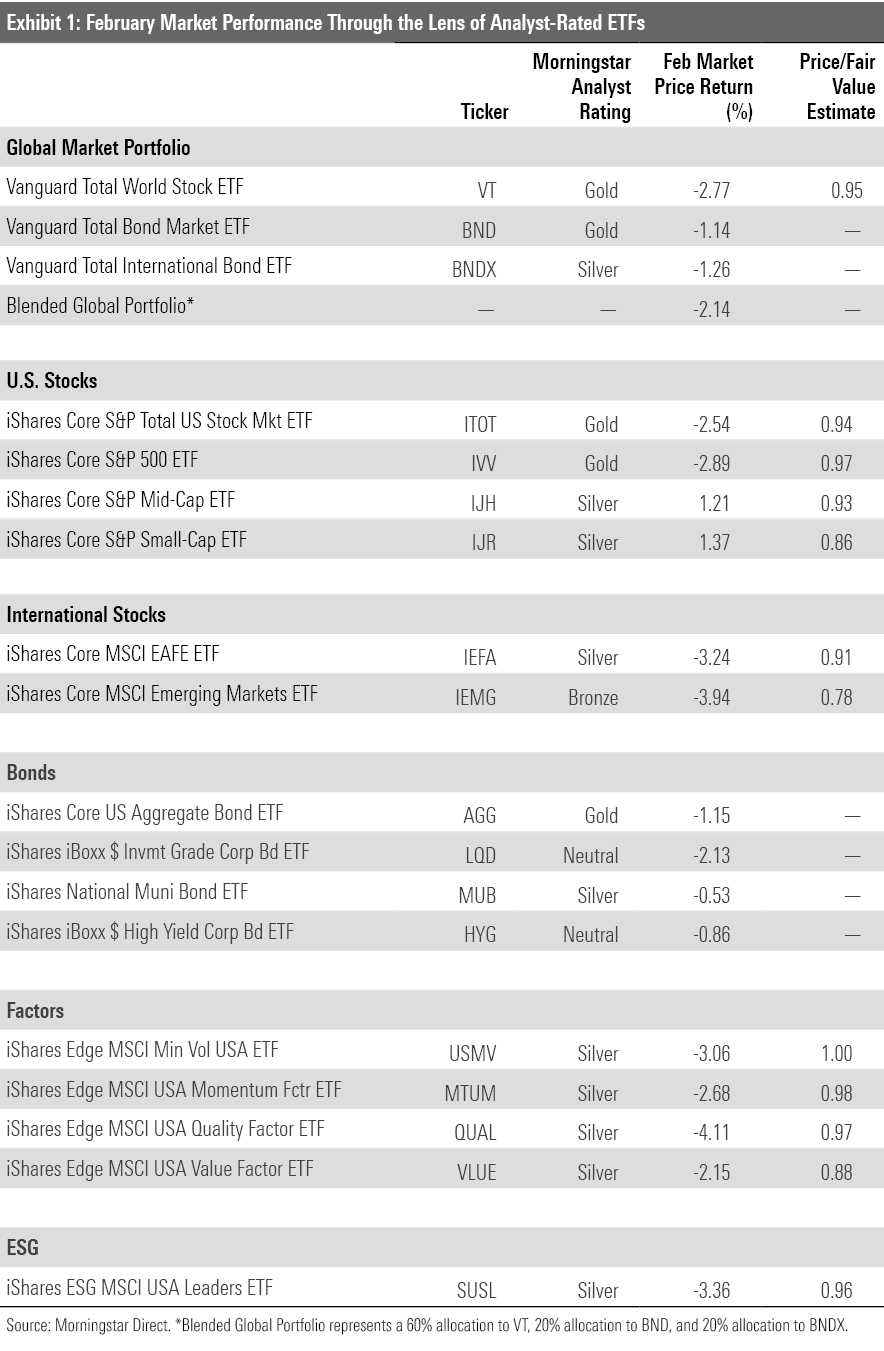
The portfolio’s bond sleeve did little to help its cause. Vanguard Total Bond Market ETF BND and Vanguard Total International Bond ETF BNDX dipped 1.14% and 1.26% in February, respectively. While these funds’ returns have not historically correlated with stocks’, they have not flexed their diversification benefits of late. Both BND and BNDX have lost money in each of the past three months, turning in respective declines of 3.18% and 2.62% for the year to date.
International stocks slid a touch further than their U.S. peers in February. Vanguard Total International Stock ETF VXUS lost 2.85% last month, compared with a 2.49% decline for Vanguard Total Stock Market ETF VTI. Russia’s invasion of Ukraine--and the economic fallout that has followed--affected VXUS more directly. The fund entered February with a lean 0.75% stake in Russian stocks, but the severe drop they suffered because of economic sanctions sapped returns. German, French, and Swedish stocks’ poor performance weighed as well.
U.S. stocks have faced economic uncertainty of their own. Investors have braced for the Federal Reserve to raise interest rates in March--a would-be headwind for stocks--but they now must sort out how the Russia-Ukraine conflict might affect the Fed’s stance.
Larger stocks tend to hold up better during volatile markets, but it was small-cap stocks that led the way in February. IShares Core S&P Small-Cap ETF IJR climbed 1.37%, while iShares Core S&P 500 ETF IVV dove 2.89% last month. Apple AAPL and Microsoft MSFT--the S&P 500’s two largest holdings--both finished February in the red. Their lackluster showing last month reduced the stocks’ respective year-to-date returns to negative 6.89% and negative 10.97%. No single stock hurt IVV in February more than Meta Platforms FB, which has tumbled nearly 35% since it announced earnings early in the month. Meanwhile, IJR saw stellar contributions from its technology positions. Insight Enterprises NSIT and Axcelis Technologies ACLS propelled the fund forward with February returns in excess of 10% each.
IJR also received a boost from its relatively large stake in energy stocks, far-and-away the market’s best-performing sector for the second consecutive month. Energy Select Sector SPDR ETF XLE climbed 7.07% in February. With a 27.17% year-to-date return, XLE not only leads the SPDR suite of sector ETFs this year, it’s the only one that boasts a positive return. As the Russia-Ukraine conflict has curbed oil supply from Russia, oil prices have soared to their highest levels since 2014. The black sheep of the SPDR sector ETF family in 2020, XLE has had a monumental turnaround.
Given energy stocks’ popularity in value-oriented portfolios, it’s no surprise to see that value stocks broadly outstripped their growth peers in February. Vanguard Value ETF VTV dipped 1.15% last month, while counterpart Vanguard Growth ETF VUG retreated 4.59%. The portfolios have posted declines of 2.22% and 13.57% so far this year, respectively. VTV’s status as a beneficiary of the turnaround in energy stocks explains some of this chasm, but this fund has carved out an advantage in the financial-services sector as well. Stalwarts like Berkshire Hathaway BRK.B, Wells Fargo WFC, and Bank of America BAC have weathered market volatility better than more-modern financial-services firms like PayPal PYPL.
A troublesome trend continued in the iShares suite of single-factor strategic-beta funds. The last six months that the Morningstar US Market Index has finished in the red, iShares MSCI USA Minimum Volatility ETF USMV has fallen further than the broad U.S. stock benchmark. USMV has captured 78% of that index’s upside and 102% of its downside since the start of 2020. The low-volatility fund has been hurt recently because it tends to eschew energy stocks for their riskier profiles. This serves as an important reminder for investors looking to dial back risk: low-volatility stocks are still stocks, and there is no substitute for curbing risk with a more-conservative asset allocation.
Back to Basics
There was plenty to worry about in February, but ETF investors did not appear fazed. They sunk $69.5 billion into ETFs last month, more than double the $32.8 billion they deposited in January. Stock ETFs spearheaded the flows. They inhaled $51.2 billion in February, which represented nearly three fourths of all ETF inflows.
Investors seemed to focus on plain-vanilla, broad index funds rather than tactical bets in the stock realm last month. Following a January of collective net outflows, U.S. large-blend funds comfortably led all Morningstar Categories with a $27.2 billion February haul. A pair of S&P 500 trackers--Vanguard S&P 500 ETF VOO and IVV--led the way with $16.3 billion and $9 billion inflows, respectively. Meanwhile, total flows in and out of U.S. sector equity funds decreased to $20.9 billion from $32.9 billion in January. The lone sector category to clock in flows over $1 billion was energy, which comes as little surprise after the sector’s torrid start to the year.
Investors have also taken note of value stocks’ recent advantage over growth stocks. After adding $12.7 billion in new assets in February, U.S. large-, mid-, and small-cap value funds have collectively absorbed $30 billion for the year to date. Growth funds have bled $10.8 billion, even after adding $1.8 billion of inflows last month. Time will tell whether value stocks’ early outperformance is a harbinger for a tenable value comeback--and perhaps the flows that follow--but investors have seemed to bet on it in 2022.
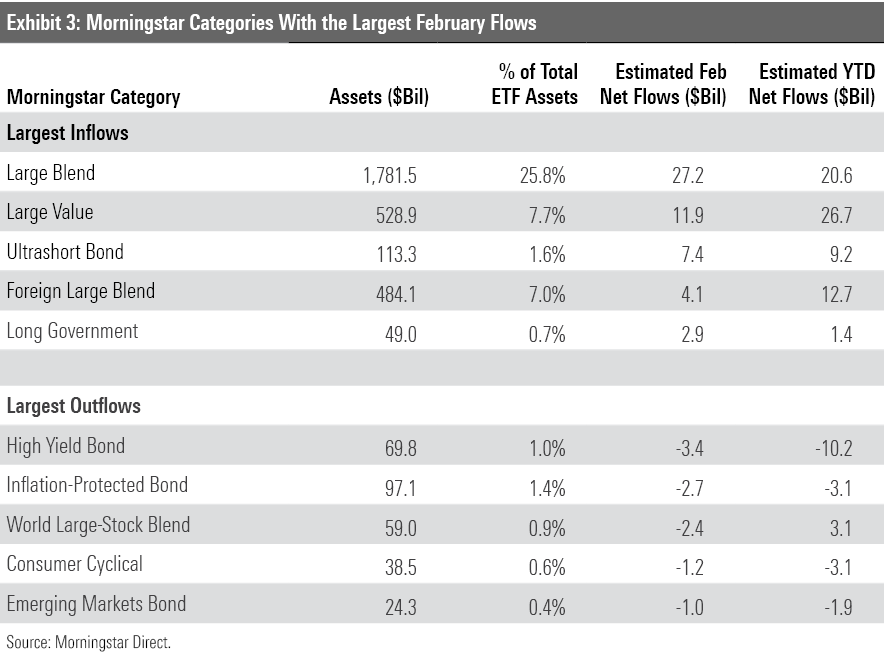
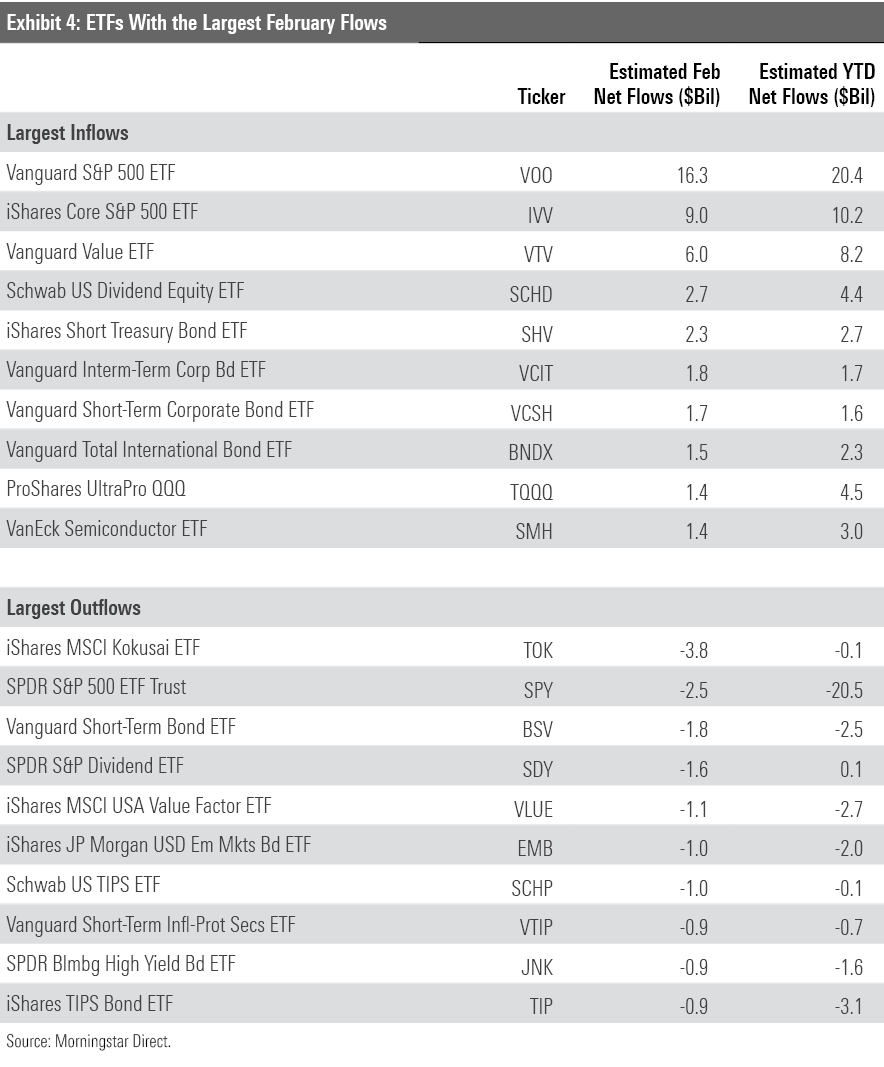
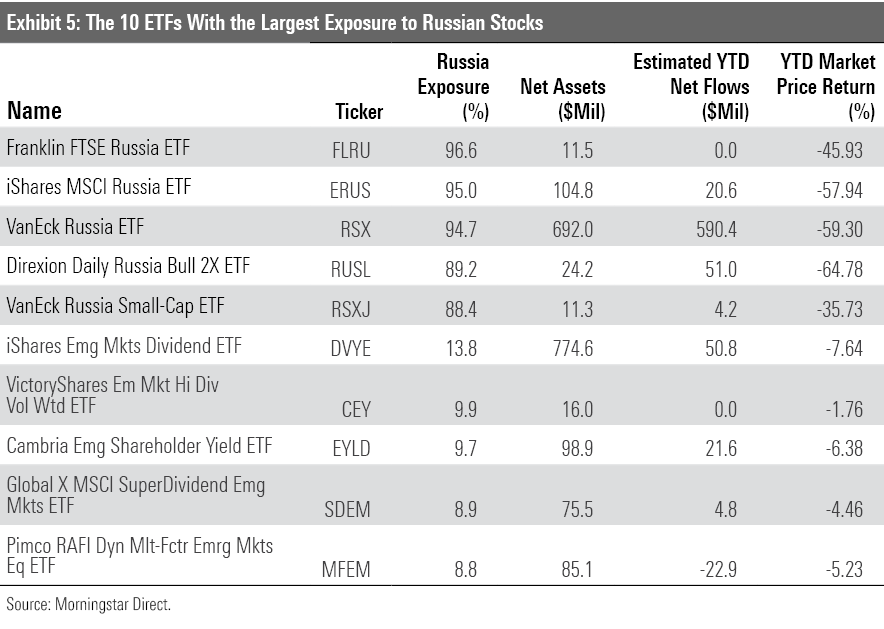
Exhibit 5 showcases the 10 ETFs with the heftiest exposure to Russian stocks. While emerging-markets mandates sweep the bottom five funds onto the list, the top five focus solely on the Russian market. These funds’ recent volatility has been accompanied by record trading volumes, as they’ve become one of the only means by which market participants can speculate on Russian stocks.
Fixed-income ETFs bounced back from a January of outflows with $9.5 billion of inflows in February. That resembled their 2021 flows form, but the composition of fixed-income funds’ February inflows looked quite different from last year. For example, corporate bond ETFs--whose $4.9 billion 2021 outflow ranked second-worst among all categories--collected $2.5 billion in February. Long-term government bond funds led all fixed-income categories last month. While these funds finished 2021 well within positive flows territory, long-term offerings did not attract the same magnitude of investment as short- and intermediate-term options that are better-suited to absorb the negative impact of rising interest rates.
In a similar vein, inflation-protected bond funds have not recaptured the flows magic of their record-shattering 2021. These funds surrendered $2.7 billion in February, second-worst among all categories and marking their second consecutive month of outflows, leaving them with $3.1 billion of net outflows for the year to date. Bank-loan funds, a common tool used to curb interest-rate risk, pulled in a tepid $326 million last month.
Commodity funds carried their January flow momentum into February, raking in a fresh $4.4 billion last month. They have now hauled in $8.9 billion for the year after bleeding $5.2 billion in 2021. Investors may be expanding their options as stock and bond markets have scuffled to start the year. Last month, they would have been rewarded. SPDR Gold Shares GLD, which led all commodities funds with a $711 million inflow in January, notched a 6.12% February gain. Broader commodities portfolios have made out well, too. ETFs belonging to the commodities broad basket category took in $2.3 billion in February, led by Invesco Optimum Yield Diversified Commodity Strategy No K-1 ETF PDBC, which climbed 6.73%.
Smooth Sailing for Vanguard
February was another lucrative month for Vanguard, which led all ETF providers with a $34.4 billion intake. It has pulled in $56.4 billion over the first two months of the year, more than 7 times the amount of the runner-up, Schwab ETFs. VOO paced all ETFs in flows last month, and VTV benefited from investors’ taste for value funds with a $6 billion inflow of its own. After a fairly ho-hum 2021, VTV has collected the third-most money among all ETFs for the year to date.
Vanguard has steadily increased its market share in recent years, as its monthly inflows have led all ETF providers in 18 of the past 24 months. At the end of February 2017, iShares held 38.3% of ETF investors’ money. Vanguard claimed 24.2%. Five years later, the firms’ market shares rested at 33.7% and 29%, respectively. IShares remains atop the ETF provider pile, but Vanguard has made a big dent in its lead.
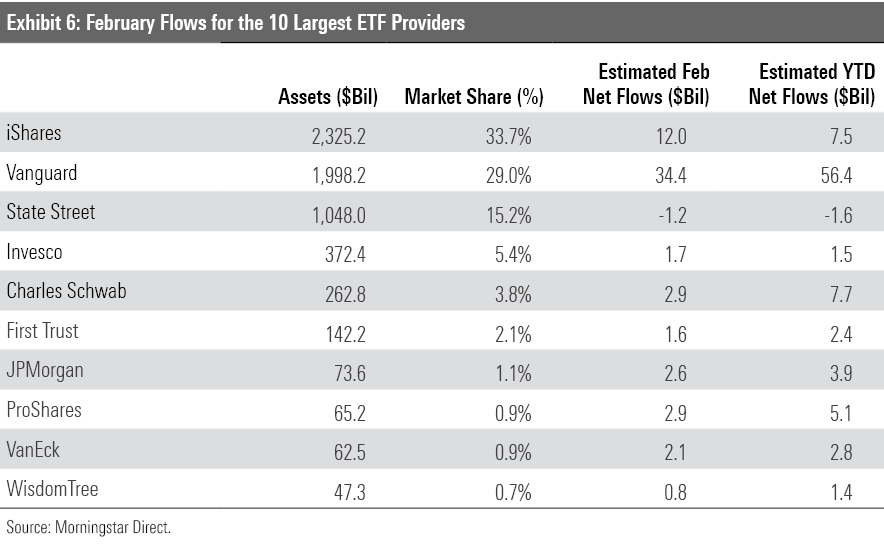
Charles Schwab’s ETF flows clock in at second place for the year to date. After raking in $2.9 billion last month, their haul over the past two months stands at $7.7 billion. Schwab U.S. Dividend Equity ETF SCHD has led the way. Its $4.4 billion in year-to-date inflows ranked sixth-highest among all ETFs. Much of SCHD’s popularity likely owes to its rock-bottom fee, a common trait among Schwab ETFs. At the end of February, its 27-ETF lineup boasted an asset-weighted average expense ratio of 0.08%.
Paying Up for Active ETFs
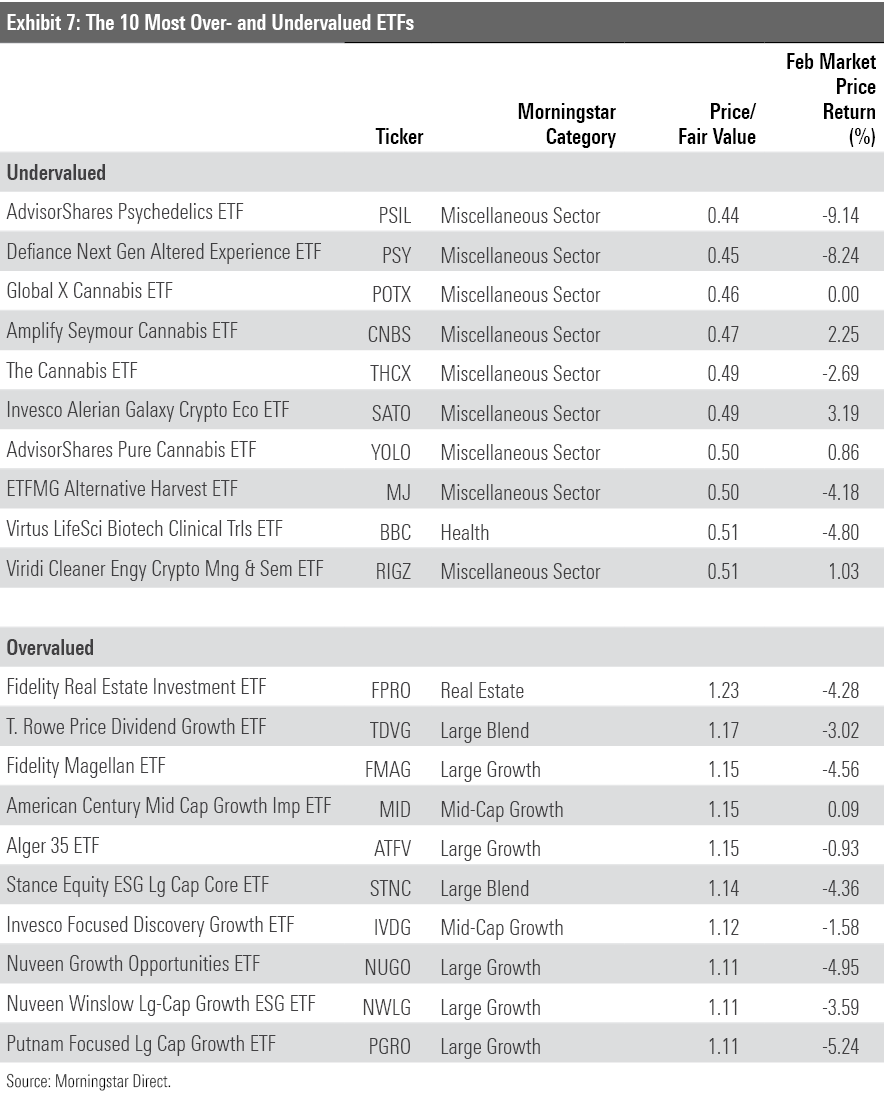
The fair value estimate for ETFs rolls up our equity analysts’ fair value estimates for individual stocks and our quantitative fair value estimates for stocks not covered by Morningstar analysts into an aggregate fair value estimate for stock ETF portfolios. Dividing an ETF’s market price by this value yields its price/fair value ratio. This ratio can point to potential bargains and areas of the market where valuations are stretched.
ETFs that aim to leverage the legalization of cannabis or other drugs continued to dominate the cheaper half of Exhibit 6, which features funds that traded at the lowest prices relative to their fair value at February’s end. It’s been a difficult run for these funds. Perhaps none has felt the pain as acutely as Global X Cannabis ETF POTX, which lost nearly 70% of its value over the 12 months through February. However, as Morningstar’s Kris Inton explains, better days may be ahead for beaten-down cannabis companies.
About one year removed from the meme-stock craze of early 2021, the fervor that surrounded many Reddit rocketships has died down. Roundhill MEME ETF’s MEME spot on the cheaper half of Exhibit 7 is a testament. This equally weighted portfolio of retail darlings like GameStop GME and BlackBerry BB has shed nearly 36% of its value since it launched in December 2021. MEME’s inauspicious start illustrates the risks that come with chasing trendy, flavor-of-the-day ETFs.
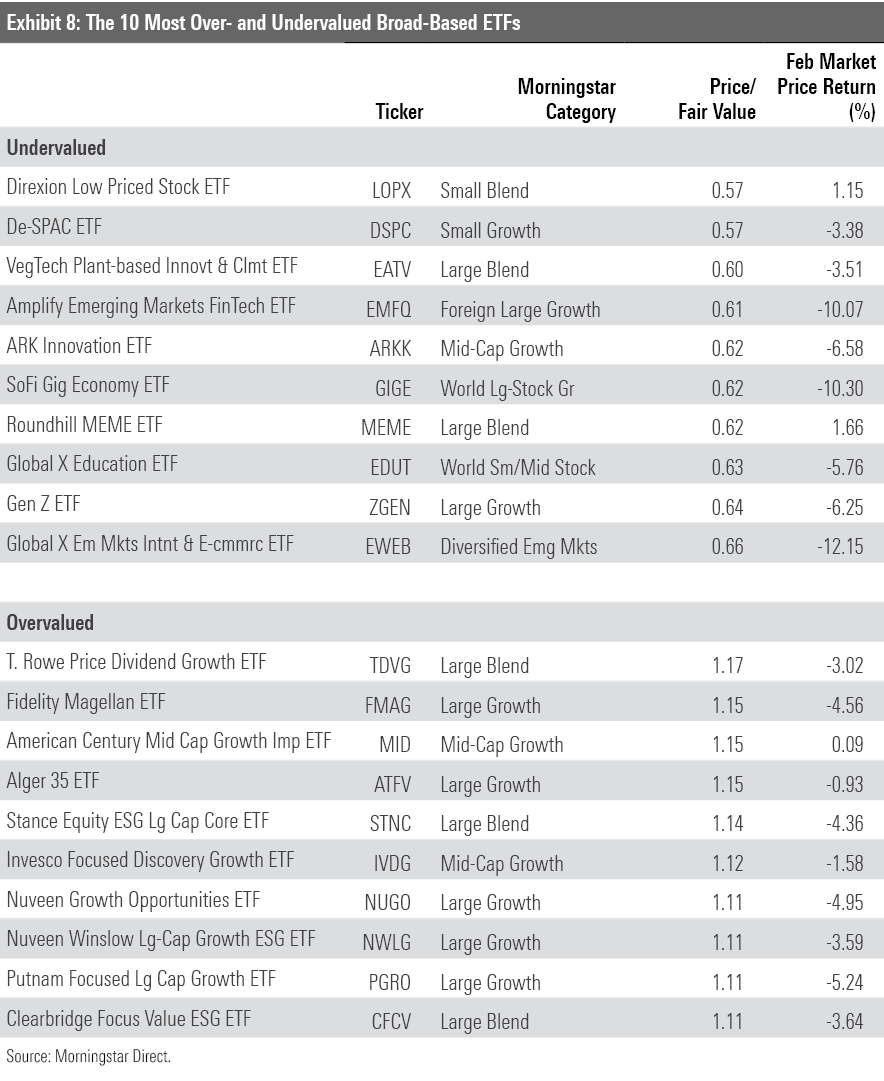
The richly valued side of Exhibit 8 comprised 10 active ETFs at the end of February. Two headliners, T. Rowe Price Dividend Growth ETF TDVG and Fidelity Magellan ETF FMAG, are tried-and-true strategies that may be worth their lofty multiples. Manager Tom Huber has led TDVG’s open-end fund predecessor to stellar results in his 20-plus years on the fund, which helps net this ETF a Morningstar Analyst Rating of Silver. FMAG plies the same approach as its venerable open-end parent, which sports a Bronze rating for its accomplished manager and formidable equity research group.
/cloudfront-us-east-1.images.arcpublishing.com/morningstar/6ZMXY4RCRNEADPDWYQVTTWALWM.jpg)
/cloudfront-us-east-1.images.arcpublishing.com/morningstar/URSWZ2VN4JCXXALUUYEFYMOBIE.png)
/cloudfront-us-east-1.images.arcpublishing.com/morningstar/CGEMAKSOGVCKBCSH32YM7X5FWI.png)
:quality(80)/s3.amazonaws.com/arc-authors/morningstar/30e2fda6-bf21-4e54-9e50-831a2bcccd80.jpg)
:quality(80)/s3.amazonaws.com/arc-authors/morningstar/a90ba90e-1da2-48a4-98bf-a476620dbff0.jpg)