
Active ETFs Dominate the US Fund Landscape in 2024
Plus, seven other charts of key findings from the fourth quarter.


Active exchange-traded funds are disrupting the fund industry landscape. Asset managers continue to launch active mutual funds, but they are shifting resources toward active ETFs, with a record number of launches in 2024.
That’s one of the many takeaways in the Morningstar Markets Observer, a quarterly publication that draws on research and market insights from Morningstar’s Research and Investments team. In this edition, Preston Caldwell, Morningstar’s senior US economist, also digs into historical US trade policy and the economic impact of President Donald Trump’s possible tariffs.
Morningstar Direct and Morningstar Office clients can also access the report on Direct Compass. A summary of key findings is available below.
The ‘Magnificent Seven’ Continued to Ride High in 2024
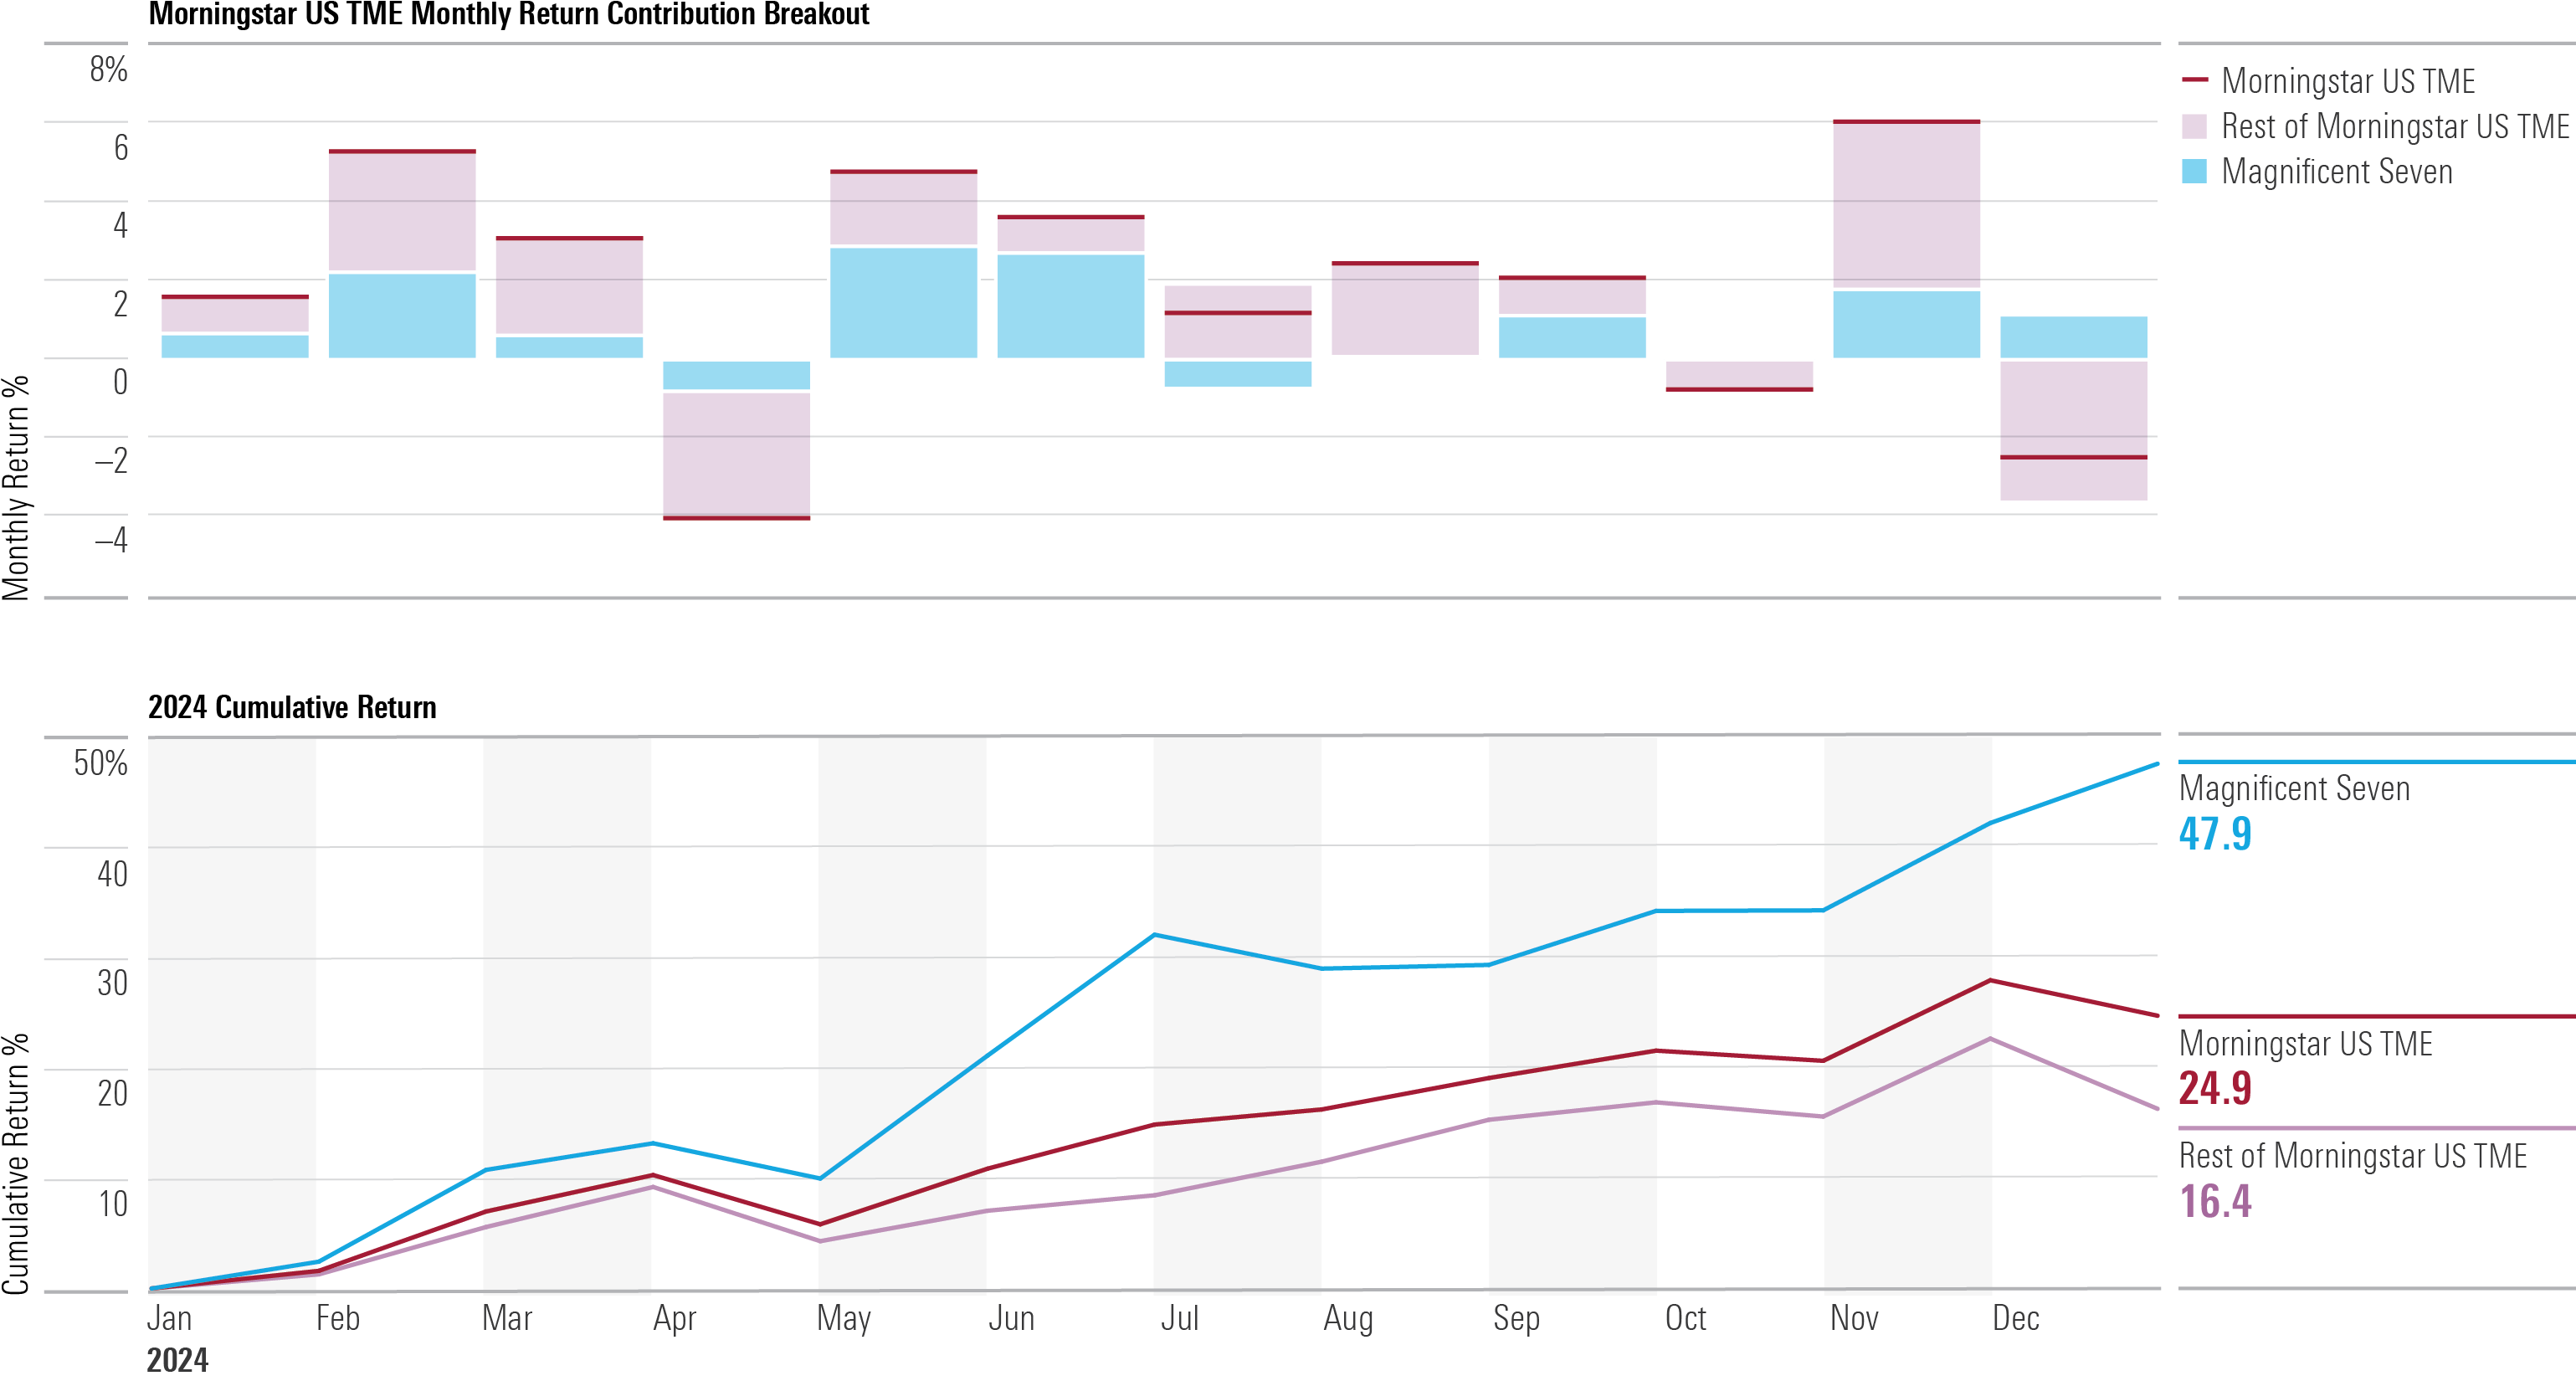
We separated the so-called Magnificent Seven stocks (Alphabet GOOGL, Amazon.com AMZN, Apple AAPL, Meta Platforms META, Microsoft MSFT, Nvidia NVDA, and Tesla TSLA) from the rest of the Morningstar US Target Market Exposure Index and formulated an implied monthly return for both components. The 2024 return of the Magnificent Seven nearly doubled that of the broad index, with the second and fourth quarters of the year as key separators. They also outperformed in months when markers declined, such as December.
Morningstar US Target Market Exposure Index and 'Magnificent Seven' Returns
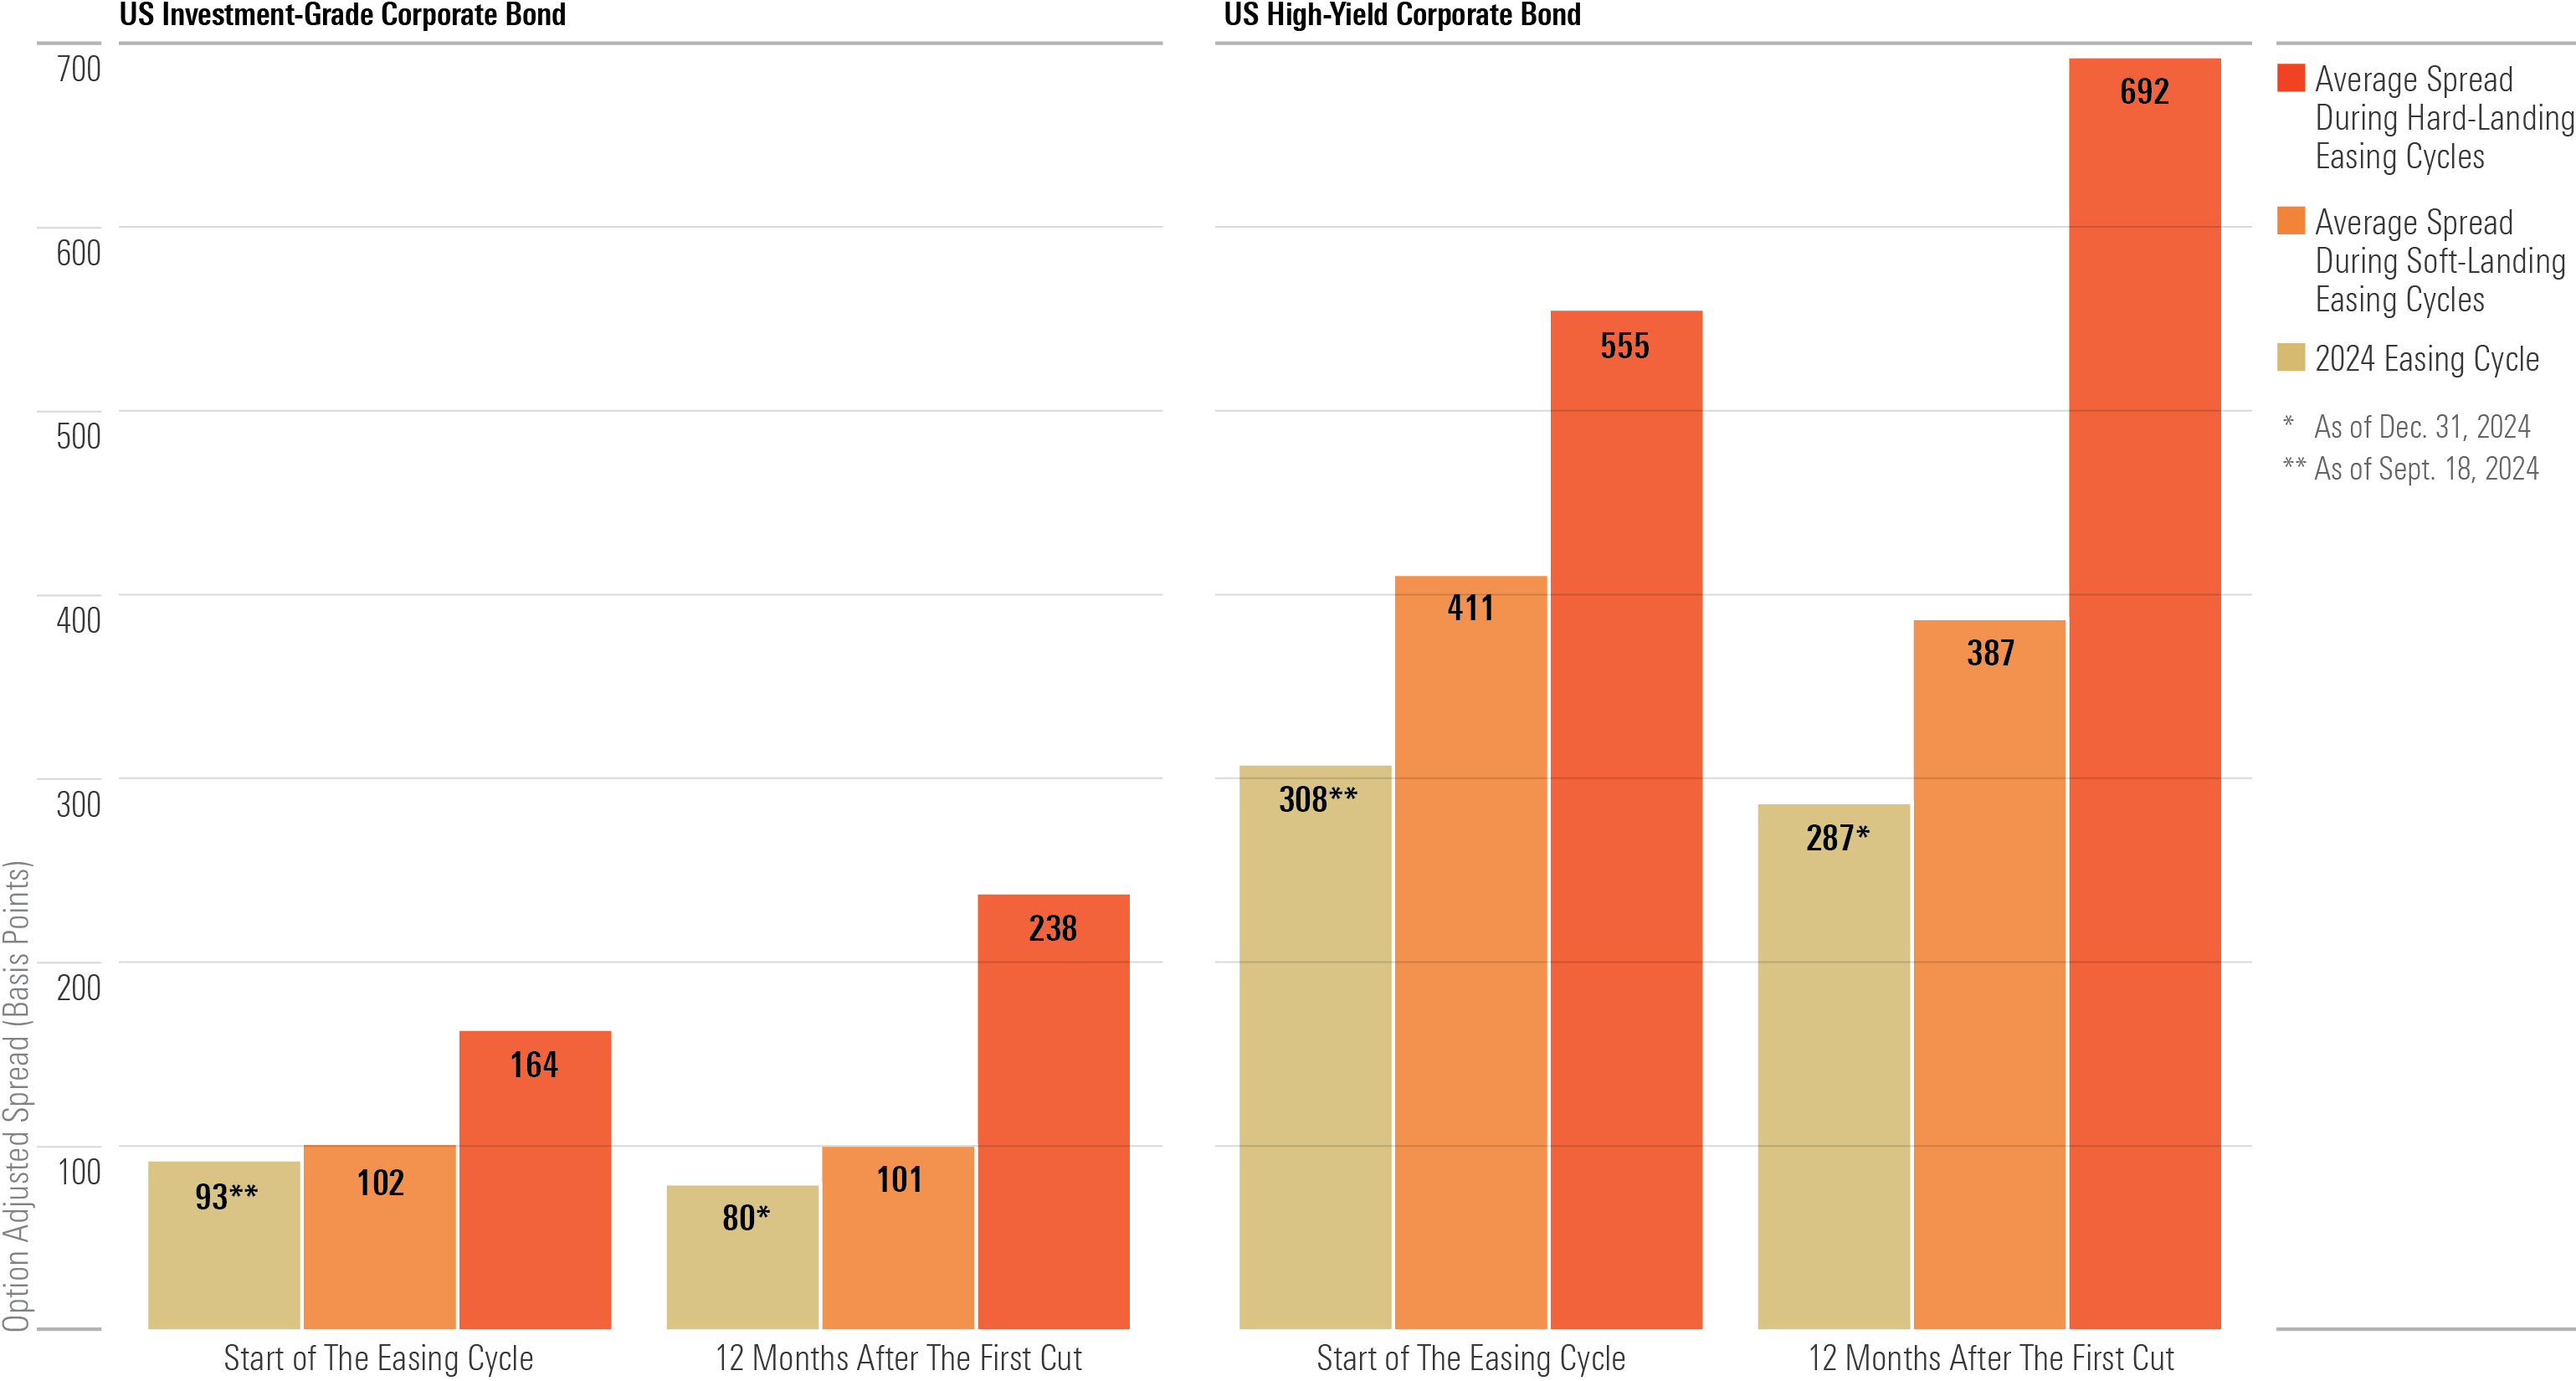
Credit Spreads Appear Tight Compared With Past Soft-Landing Episodes
Credit spreads are narrow, even compared with average levels of past easing cycles that coincided with a soft landing. Spreads historically don’t contract much during easing cycles when markets price in a soft landing, but they could widen significantly in the event of a hard landing. As a result, today’s tight spreads highlight the asymmetric range of potential outcomes.
Option Adjusted Spreads for US Investment-Grade and High-Yield Corporate Bonds
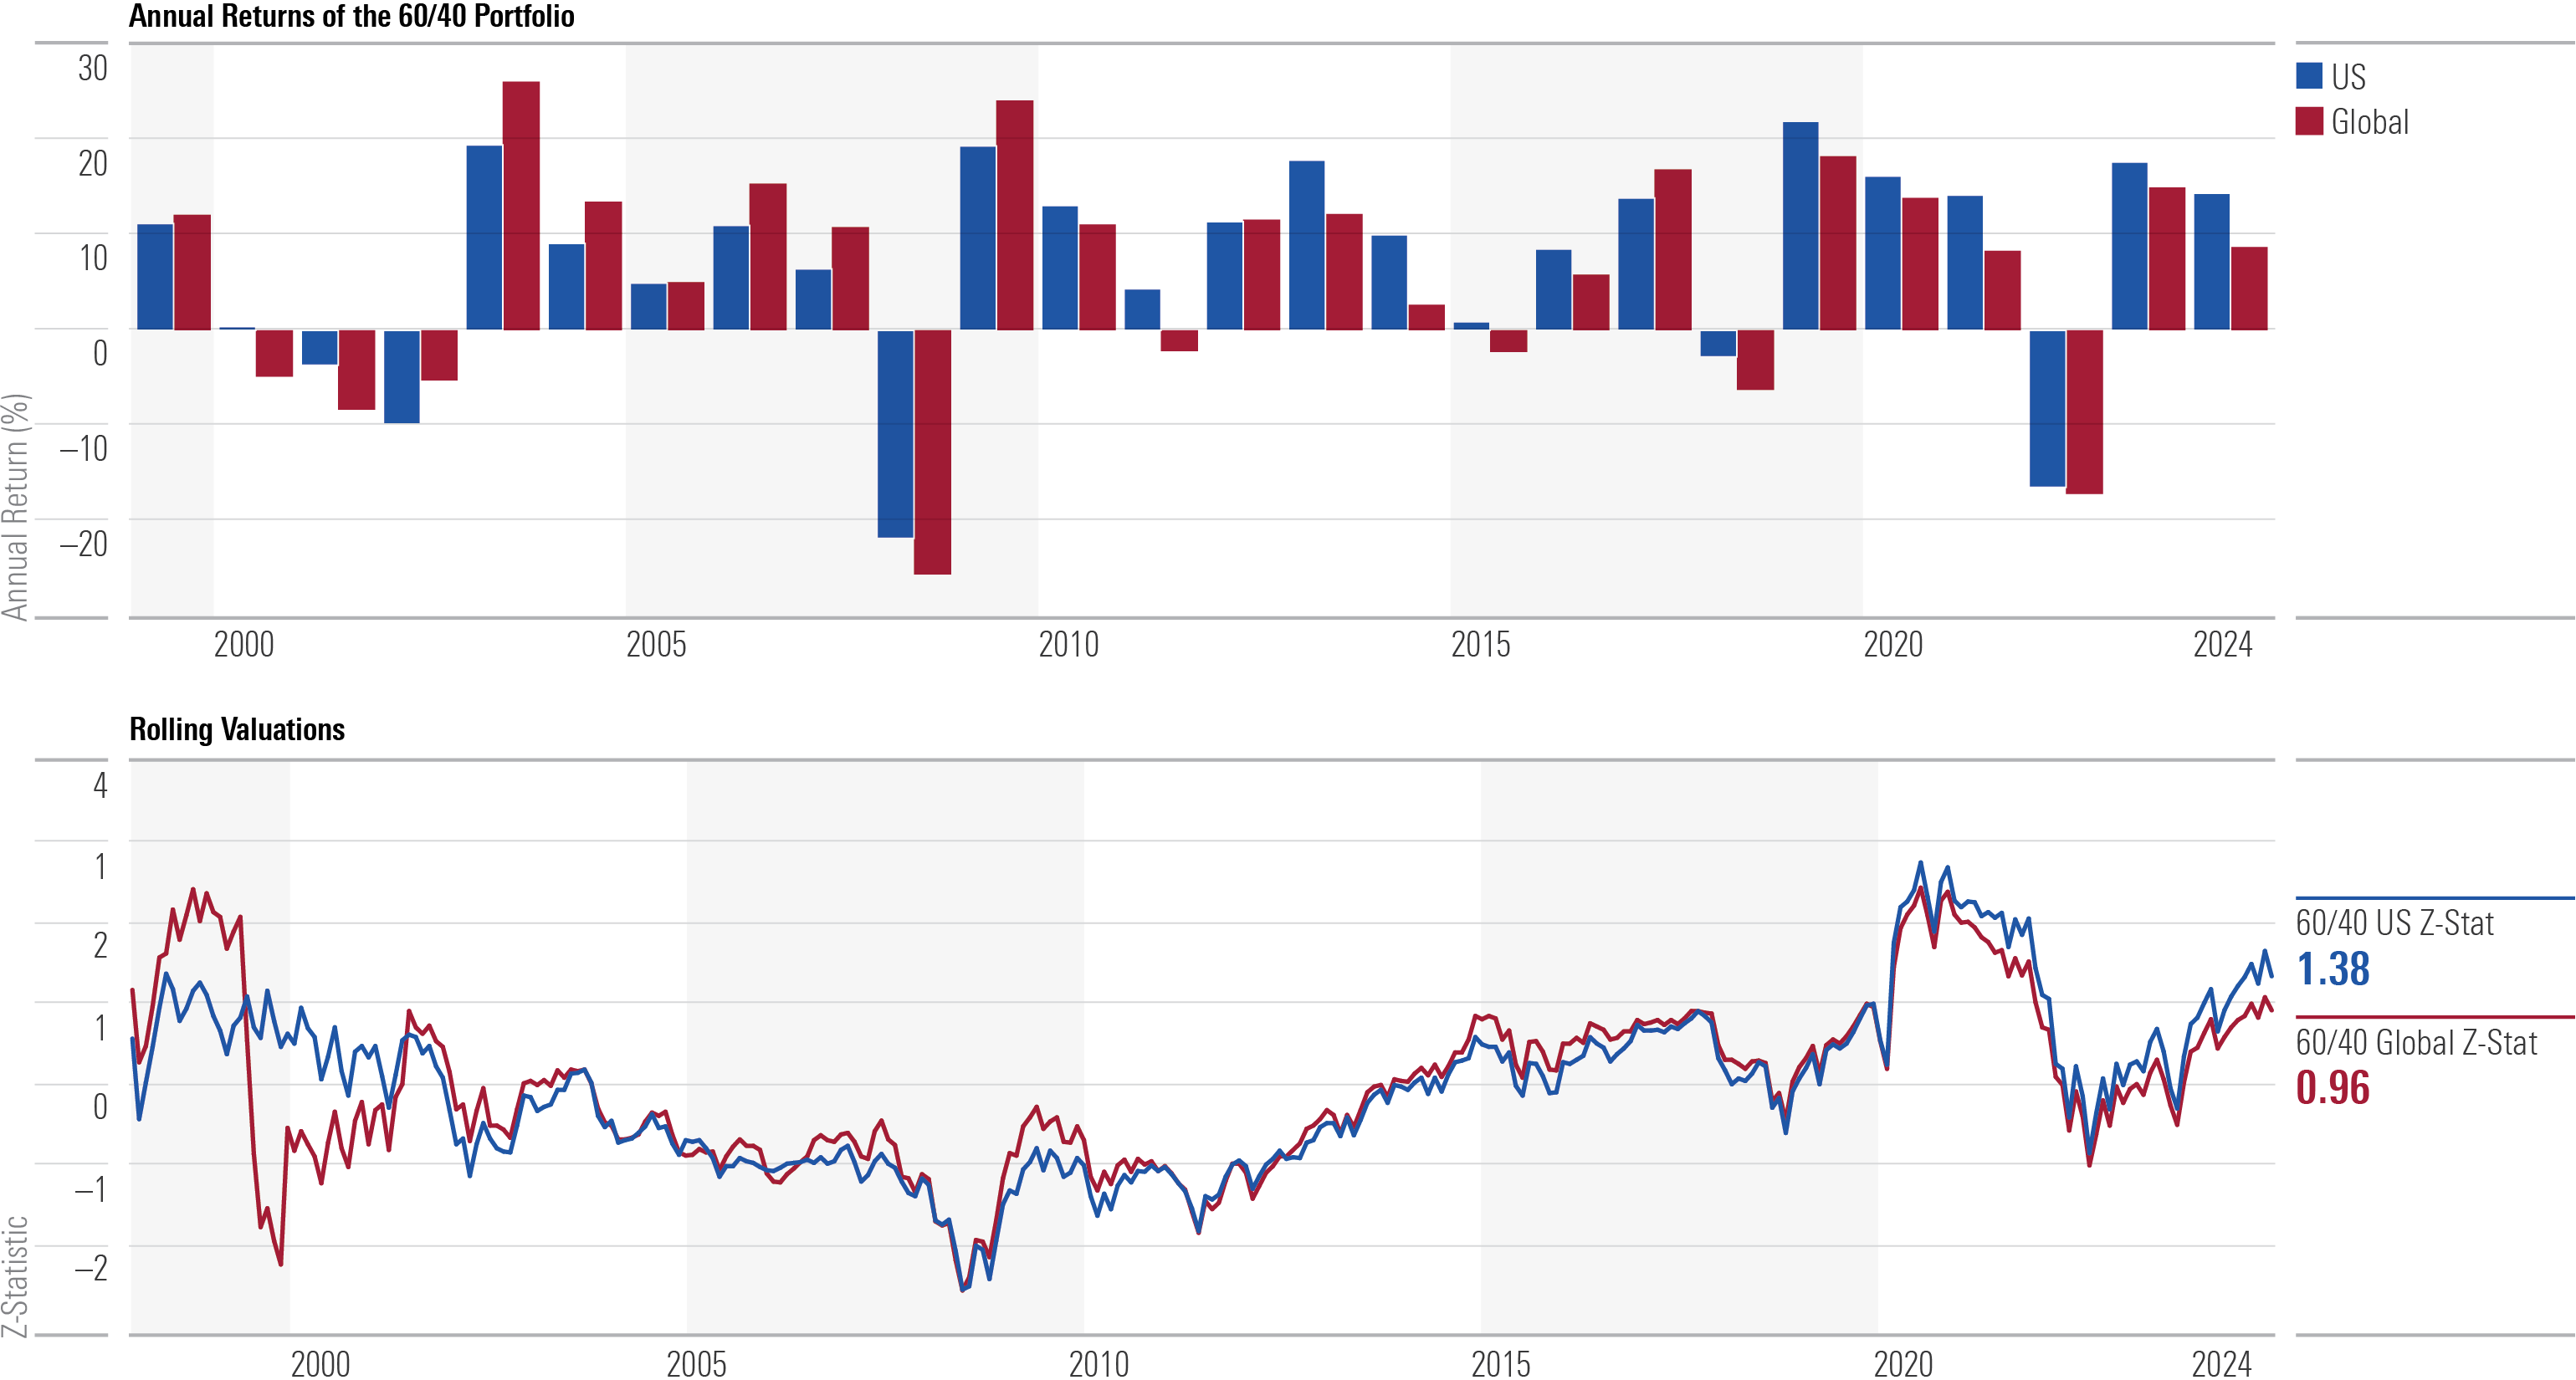
Are 60/40 Portfolio Valuations Back in the Danger Zone?
The classic 60/40 balanced portfolio continued to rebound from its sharp decline in 2022 with a US-focused blend delivering another double-digit return in 2024. When comparing US and global 60/40 portfolio valuations to their long-term averages, they are currently about one standard deviation above historical norms. This has been driven largely by the equity portion, with prices rising versus earnings expectations. Valuations still sit below the elevated levels seen in 2021, though.
Annual Returns and Rolling Valuations for 60/40 Portfolios
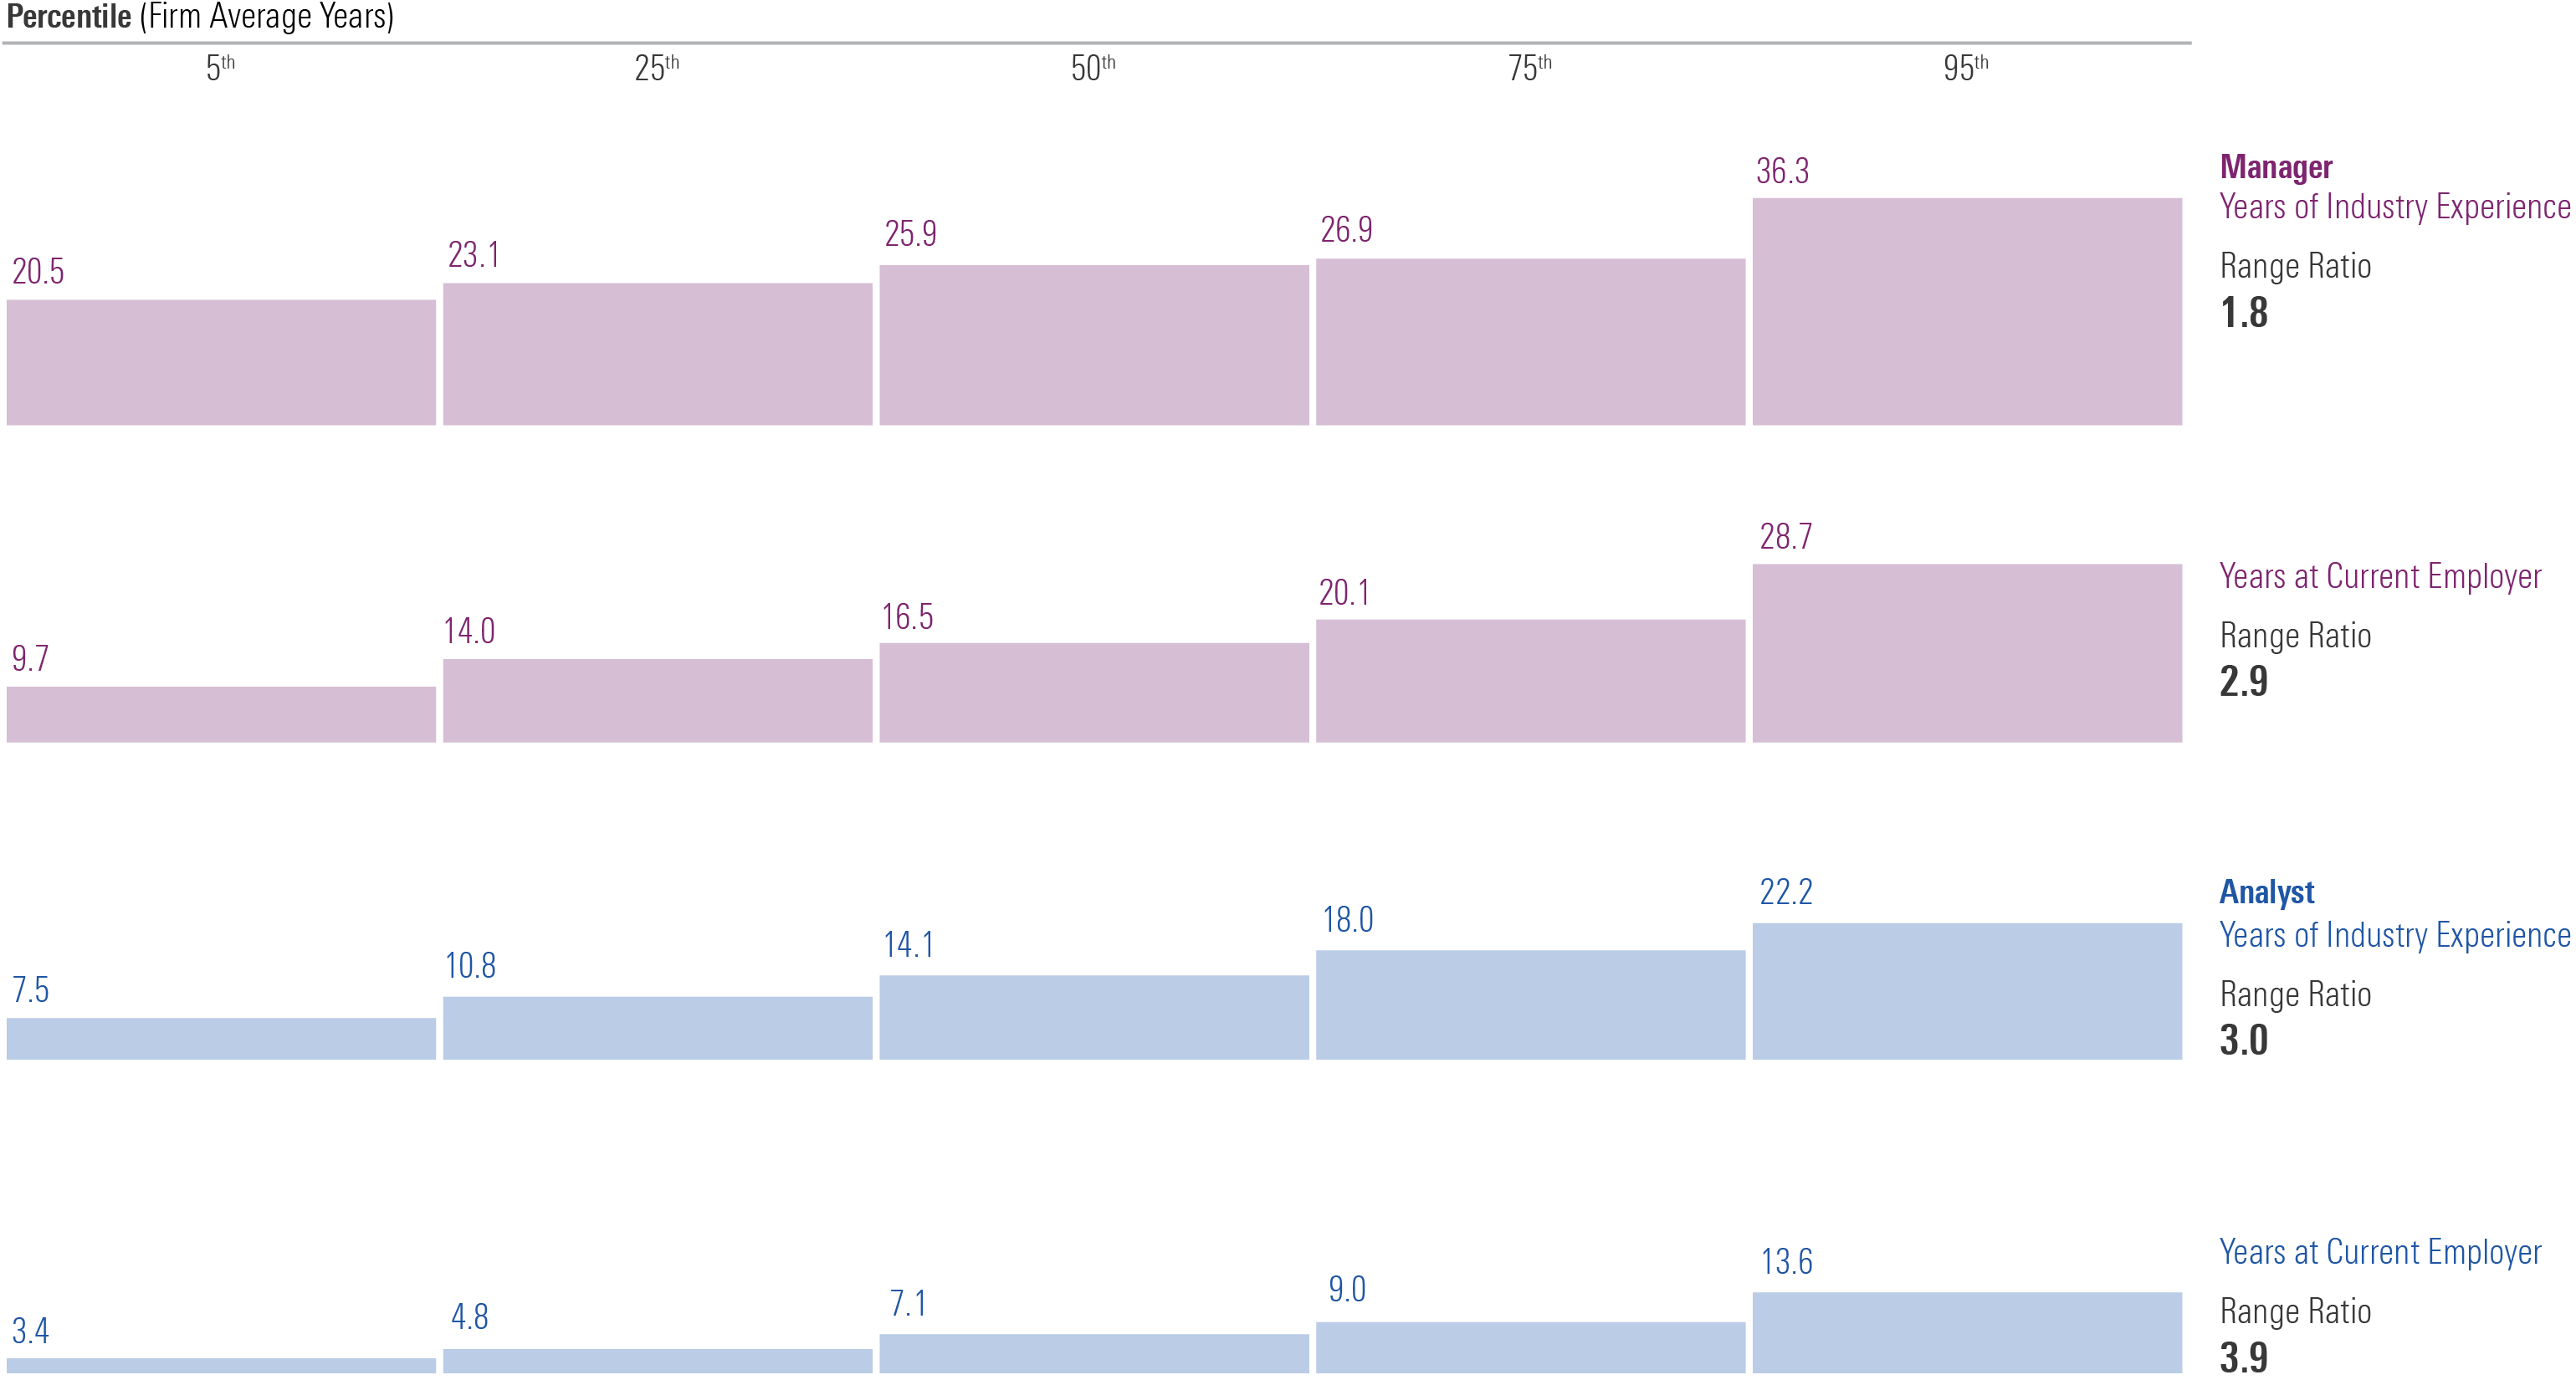
Manager Industry Experience Isn’t a Differentiator, but Firm Tenure Is
Many firms advertise how experienced their portfolio managers are. Yet aggregated survey data indicate that nearly all named equity portfolio managers have many years of industry service. The length of time managers have spent in their current role or at their current firm shows greater dispersion (as defined by range ratio—the maximum divided by minimum), making those traits a better differentiator. Analyst years of experience and firm tenures also vary widely. See Morningstar’s Active Equity Benchmarking Report for further details.
Industry Experience vs. Firm Tenure
Active ETF Momentum Surged in 2024
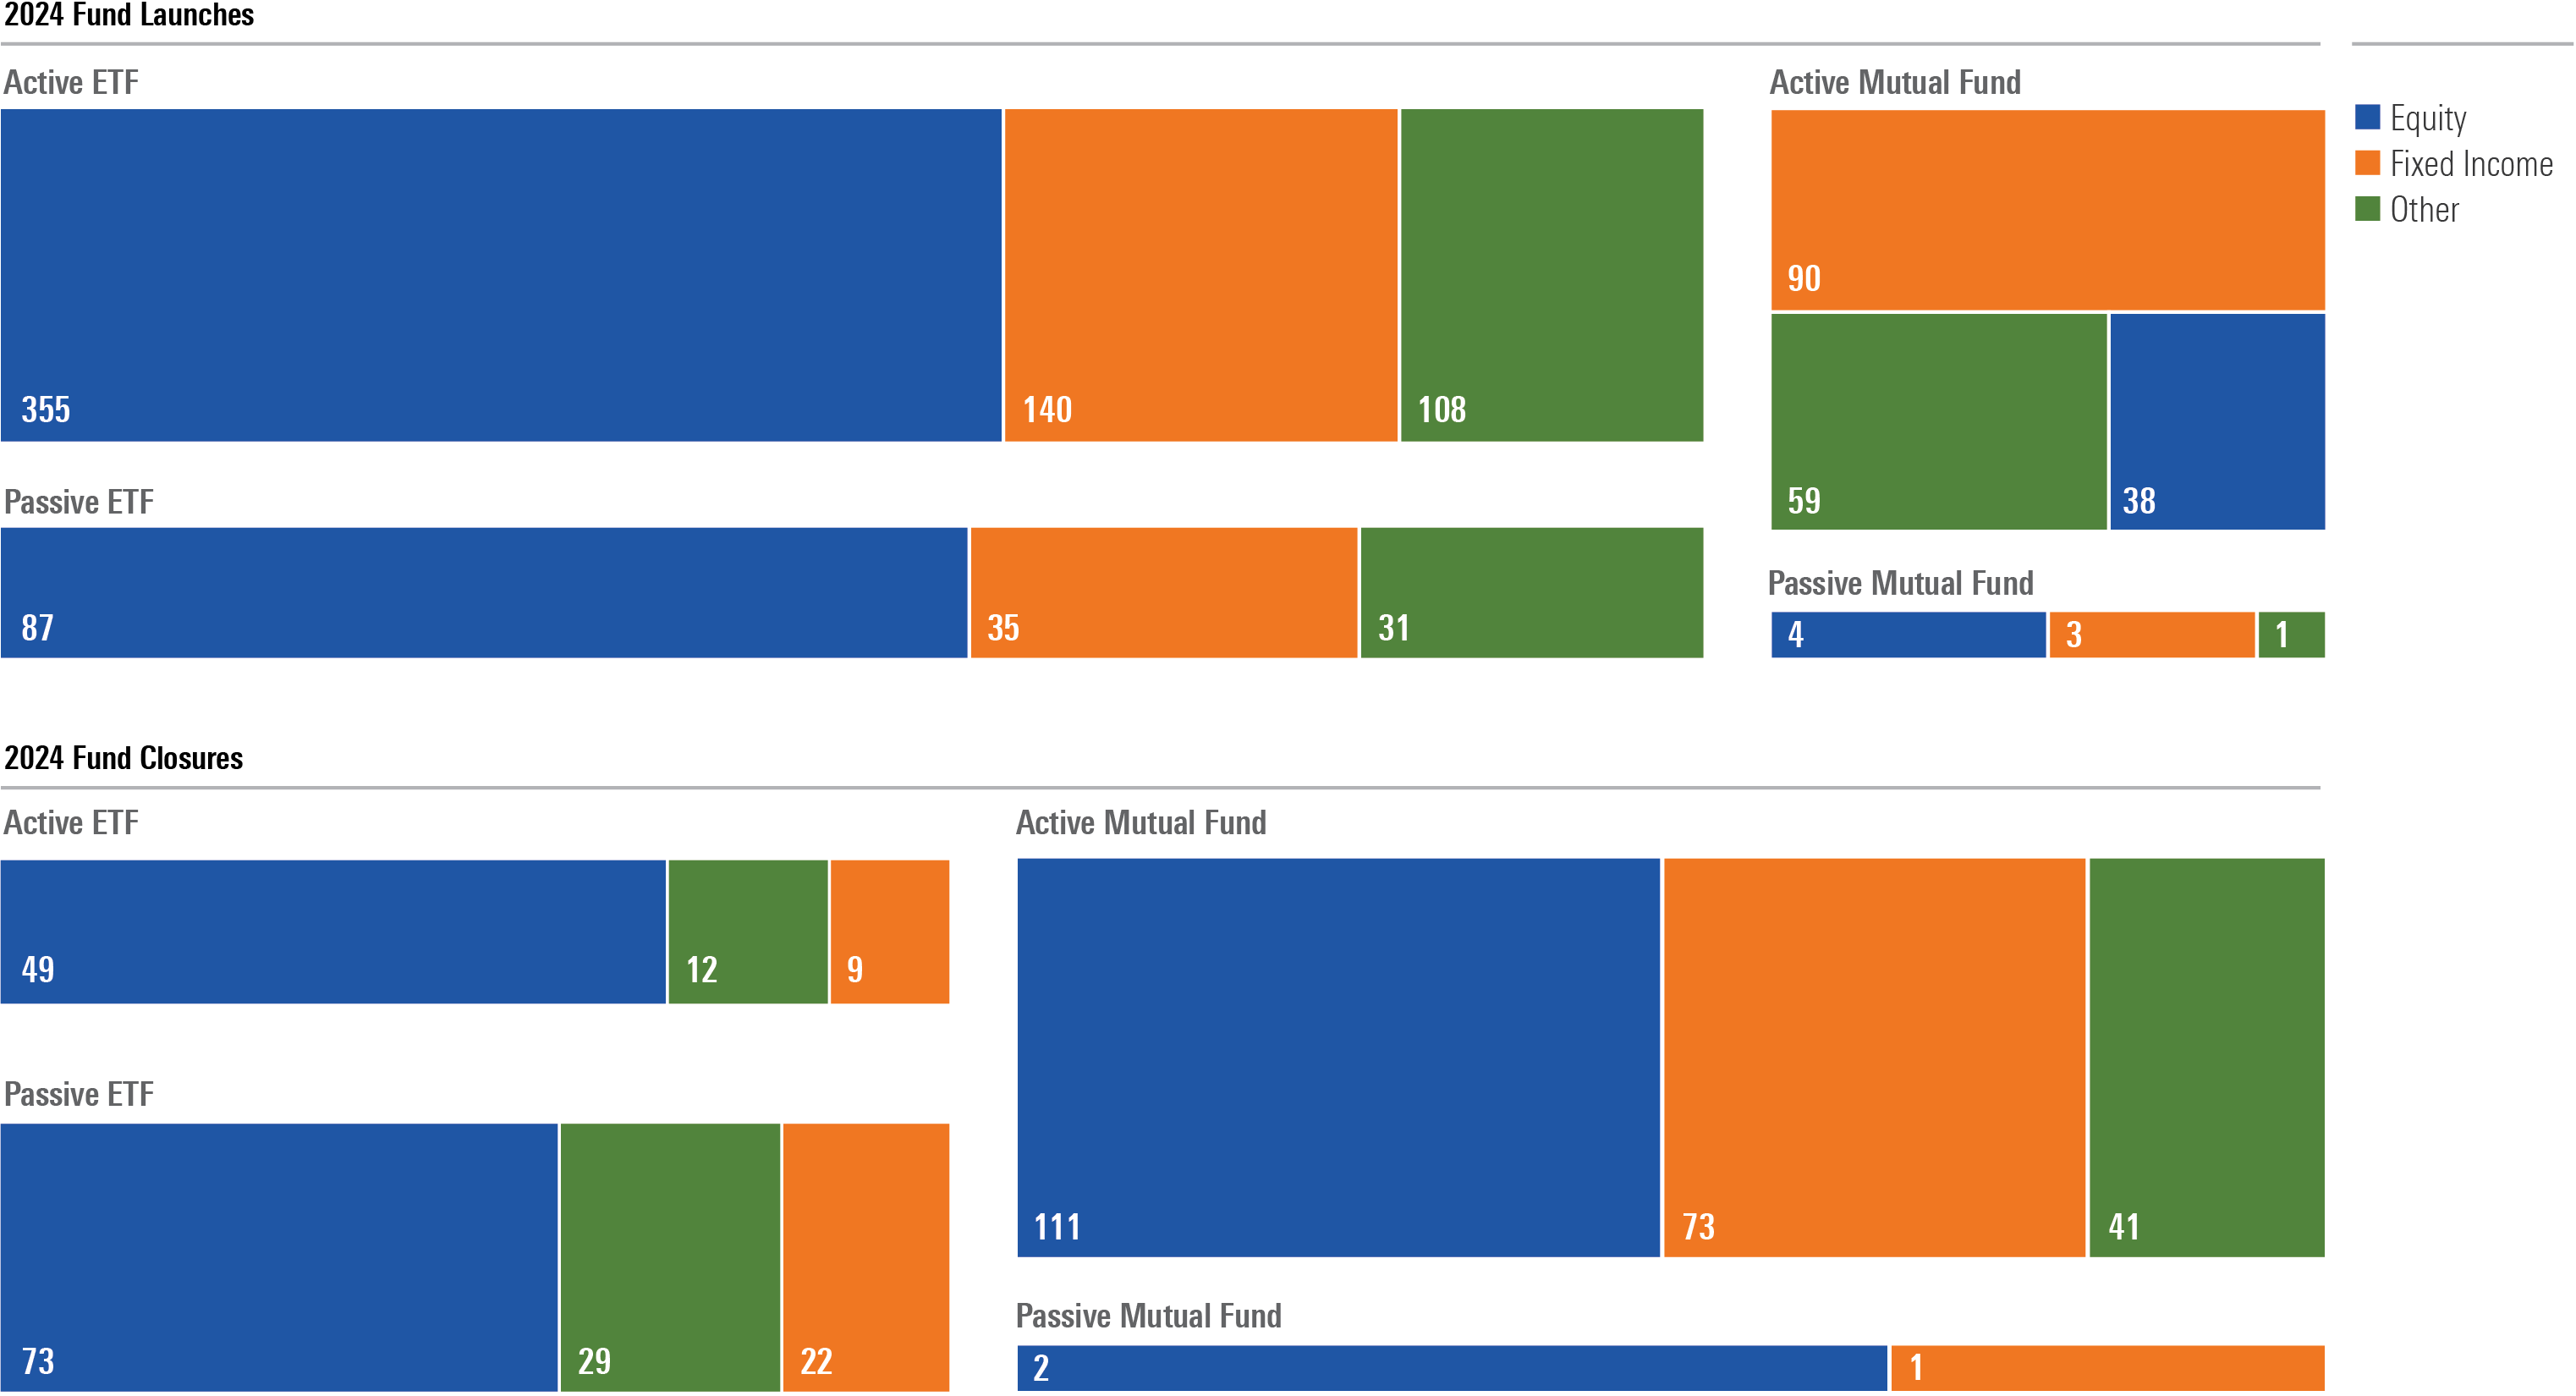
Fund companies again favored ETFs in 2024. A record 603 active ETFs came to market, along with 153 new passive ETFs. While active mutual fund launches far outpaced their index-based siblings, they also saw the most closures during the year with 225 as firms shift resources to ETFs. As a result, 2024 closed with a net increase of 562 ETFs and a net reduction of 33 mutual funds.
2024 Fund Launches and Closures
Election Cycles: A Historically Wide, but Typically Positive, Range of Outcomes
The below chart shows the distribution of daily price returns (that is, excluding dividends) for the S&P 500 over four-year US presidential election cycles dating back to 1928. Starting Nov. 1 of each election year, through Oct. 31 four years later, the average index price return is a cumulative 34%, though there’s a wide range of outcomes. Through two months of the new cycle, returns are above the historical trend.
S&P 500 4-Year Presidential Election Cycle

Higher Tariffs Could Reduce US Real GDP
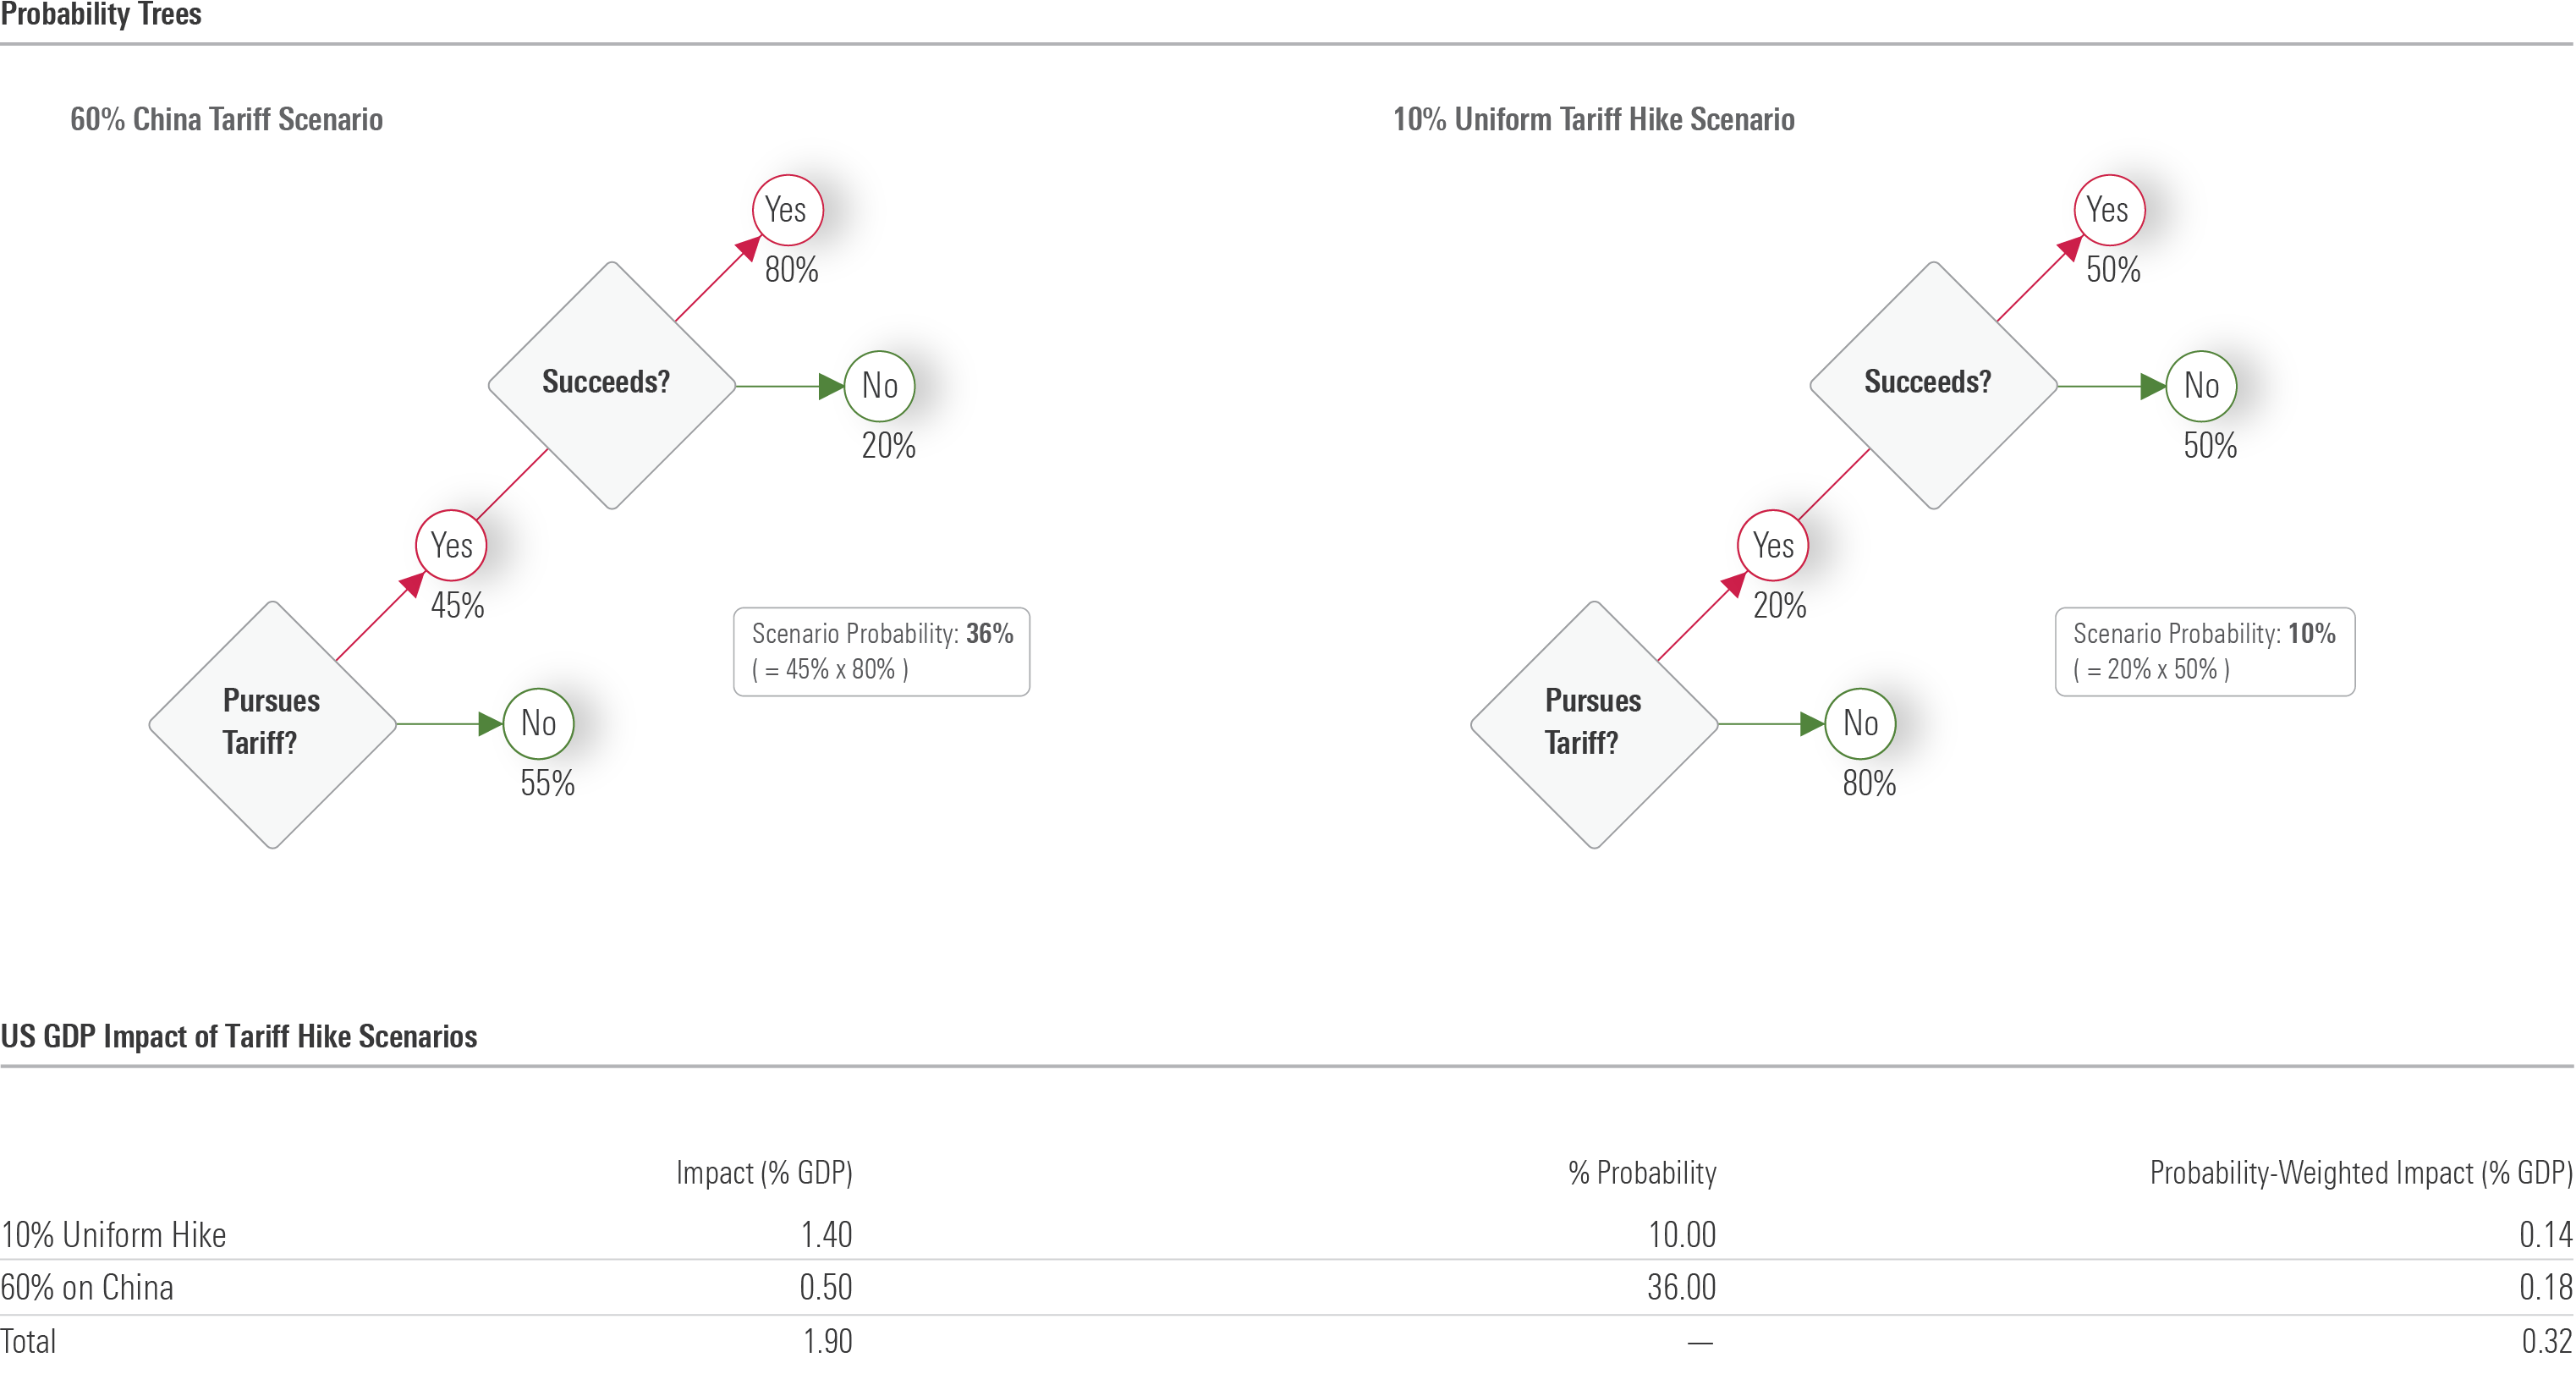
In contrast to most issues, US presidents can enact sweeping changes on trade without congressional approval. We estimate that President Trump’s proposed tariff hikes would subtract 1.9% from the long-run level of US real GDP. Still, we think it’s more likely than not that Trump would back down from the threatened tariffs, particularly the 10% uniform hike. This leads to a probability-weighted impact of negative 0.32%. See Morningstar’s latest US Economic Outlook for further details.
Probability Tree
High Tariffs Were Once the Norm for the US
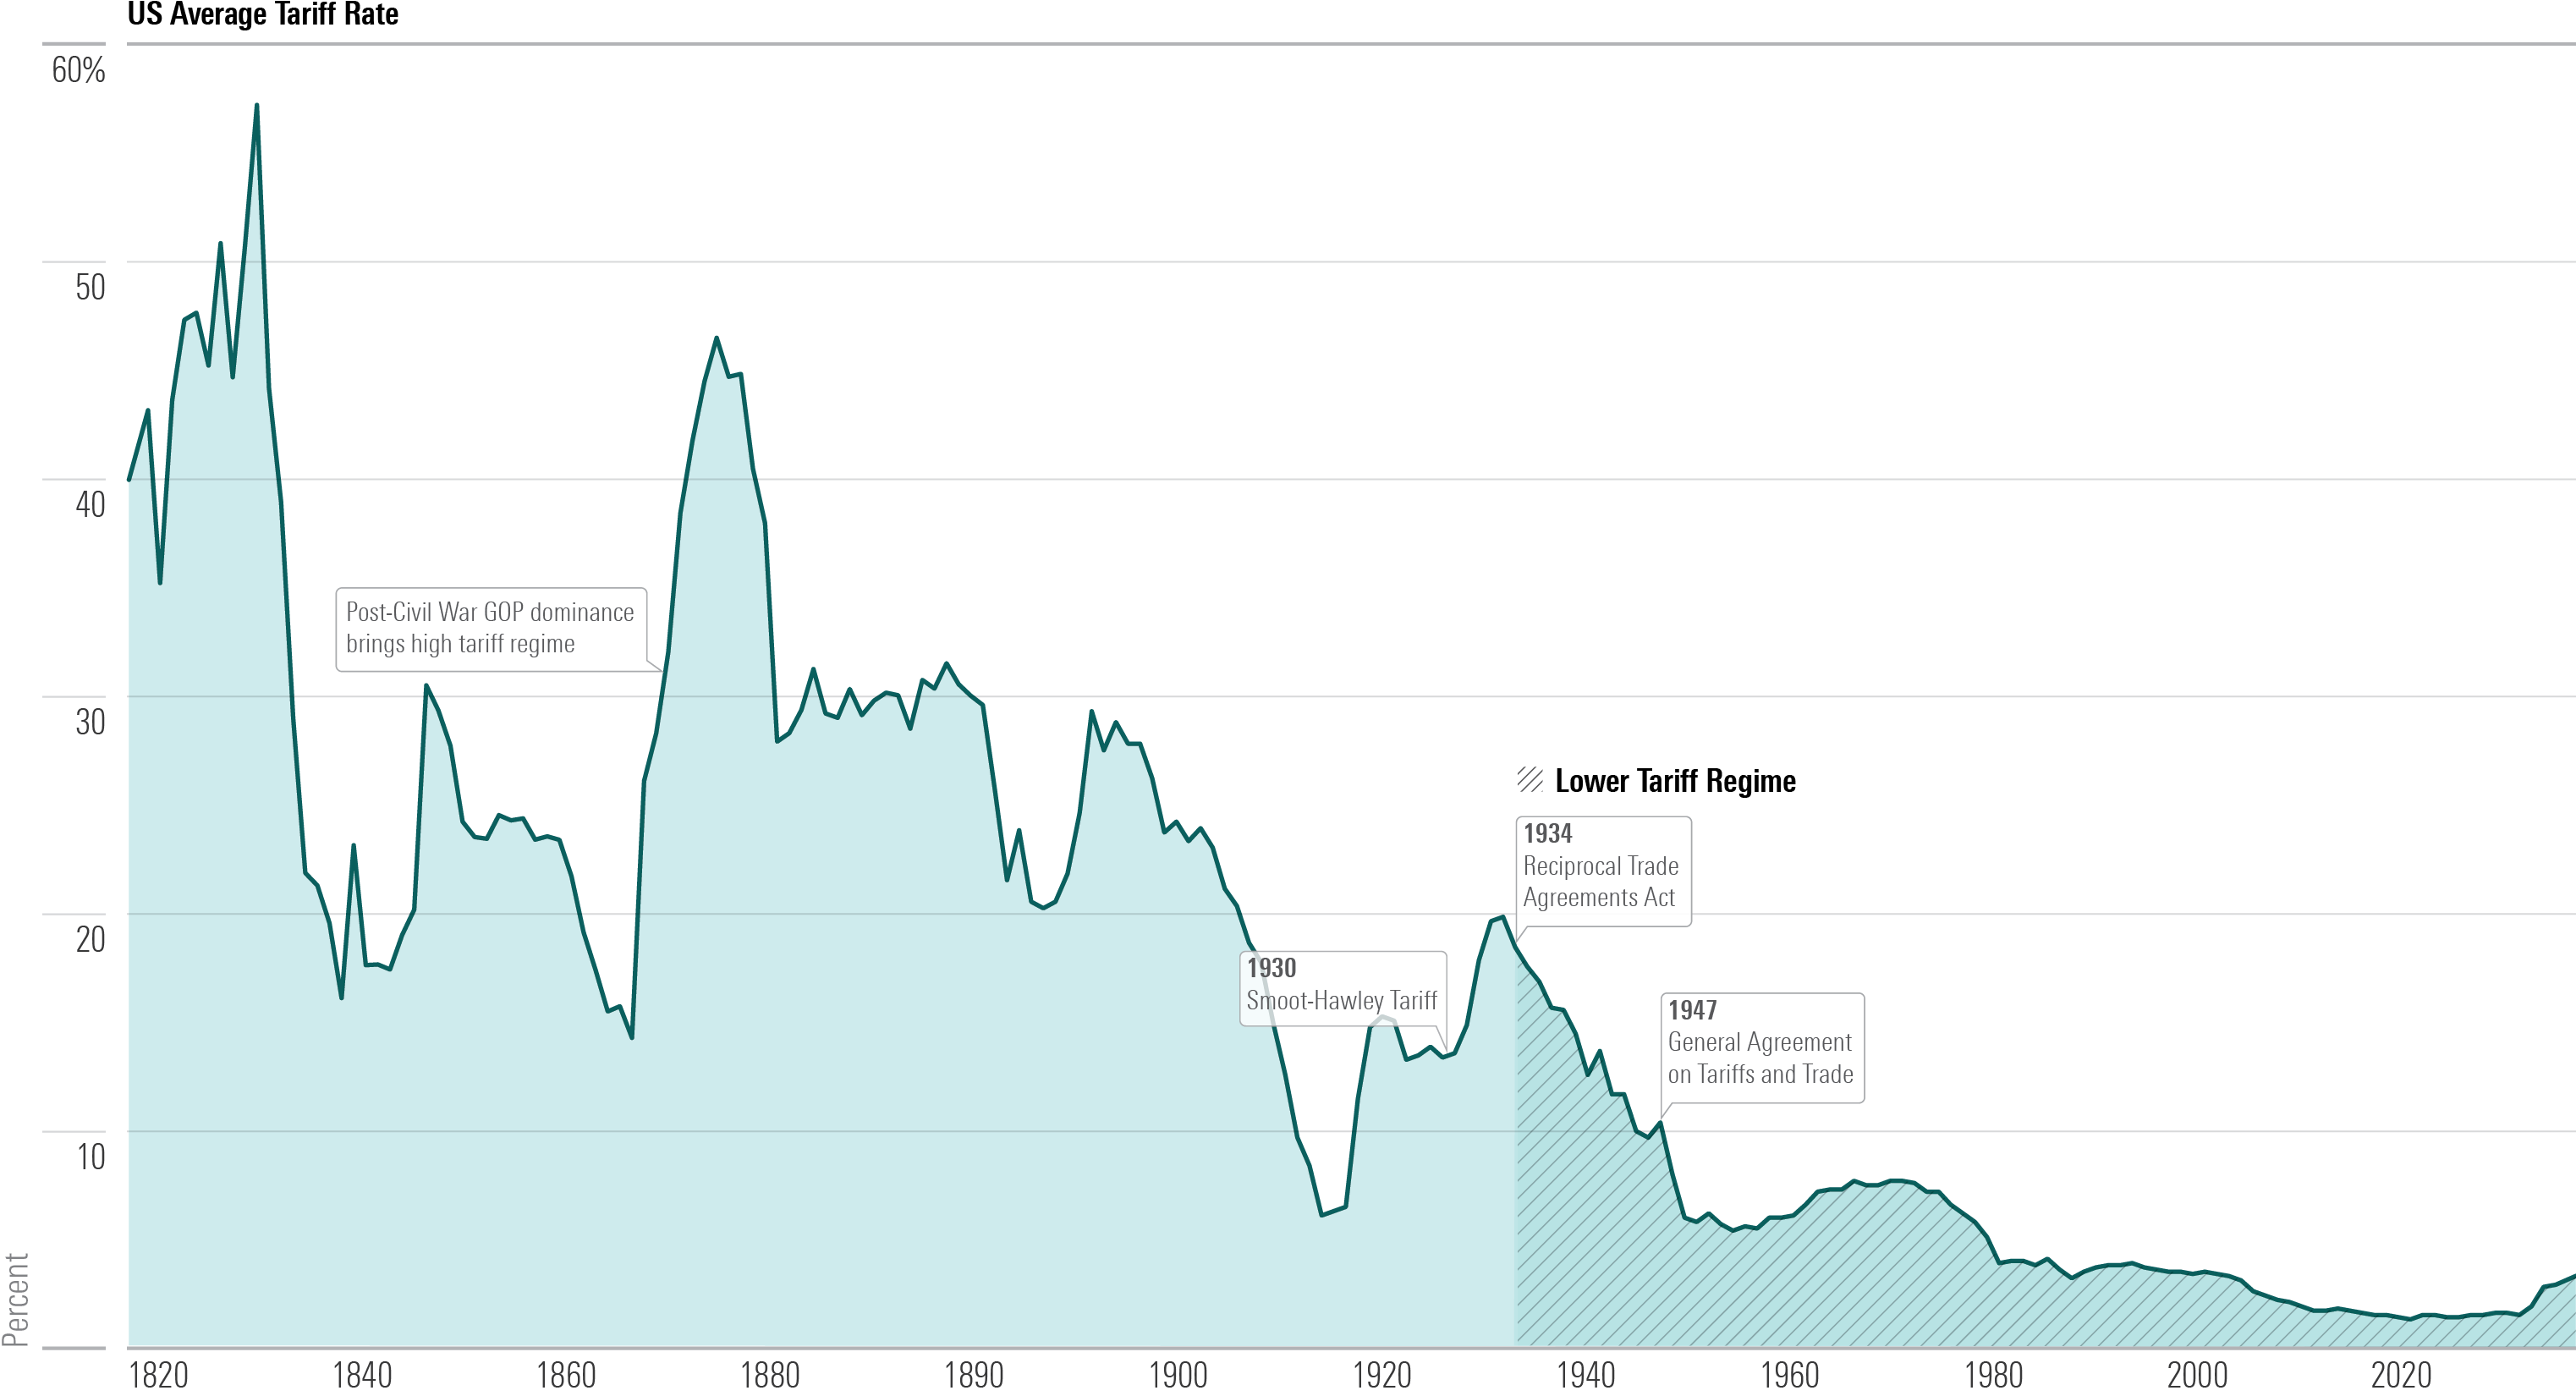
Low tariff rates have been the standard for the US and most other major economies since the end of World War II, but that hasn’t always been the case. From the second half of the 19th century to the early 20th, the US had very restrictive tariffs. One key lesson is that high tariffs, once they’re in place, are very hard to dislodge, owing to vested interests and the need for unified control over government. Douglas Irwin’s Clashing Over Commerce is an authoritative account of this history.
US Average Tariff Rate
Joseph Weas, Jason Kephart, Hong Cheng, Thomas Murphy, Adam Sabban, Zachary Evens, and Preston Caldwell contributed to this article.
The author or authors do not own shares in any securities mentioned in this article. Find out about Morningstar’s editorial policies.

 United States