
Mutual Fund Managers Are Wrong More Than They’re Right
These managers overcame low hit rates to exceed their benchmarks.
/s3.amazonaws.com/arc-authors/morningstar/b0c51583-b9a2-49eb-9a8f-5f25a8bda4a3.jpg)

Active mutual fund managers get more stock picks wrong than they do right, but the odds are stacked against them.
In my latest research, I examine active fund managers’ hit rates—that is, the percentage of their holdings that outperformed their fund’s Morningstar Index. I looked to see if hit rates are key drivers of fund performance and whether investors can use them as a guide to finding better investment options.
This research found that in some categories, like large growth, hit rates are virtually meaningless, while in others, an investor who could’ve known the high hit rate funds in advance would have significantly improved their odds of success.
Active Funds Struggle to Pick Winners—but the Market Creates More Losers Than Winners
To examine the stock-picking record of active managers, I looked at the portfolio histories for all funds in the nine Morningstar Style Box categories dating to 2013 through the end of 2023.
Over those 10 years, only 10% of mutual funds saw more than half of their stock picks beat the index. This means that 90% of funds picked more losing stocks than winners.
When bundled together, the stock-picking record of active managers is not inspiring. My research tracked more than a quarter of a million unique positions in large-cap funds between 2013 and 2023. Of those positions, only 44% beat the index over the period in which funds held them. Small-cap managers fared slightly better, as 46% of their nearly 160,000 unique positions topped the index over their holding periods.
Given the dismal record of active management, these statistics may not seem surprising. Yet they’re not an outright condemnation of active management. A passive fund essentially does no better. Active managers tend to cluster around the “market” hit rate—that is, the percentage of index constituents that outperforms the index. Market hit rates vary by category, usually depending on the concentration level of the index. For instance, in large growth, on average, less than 40% of index constituents topped the index over rolling three-year periods since 2013. In large value, though, on average, 48% of constituents beat the index over rolling three-year periods.
So, position sizing is the real differentiator between active and passive portfolios, not the fact that active managers struggle to pick more winners than the index. The ground that active managers’ winners gain often cannot make up for what their laggards lose. Of course, higher fees don’t help, either.
Hit Rates Do Matter—but Not As Much as You’d Think
Still, as seen below, hit rates aren’t completely meaningless. The chart below ranks funds by their hit rates relative to category peers. Funds in the lowest decile, for instance, had the highest 10% of hit rates in their category.
All Funds: Frequency of Underperformance by Hit Rate Ranking Within Category
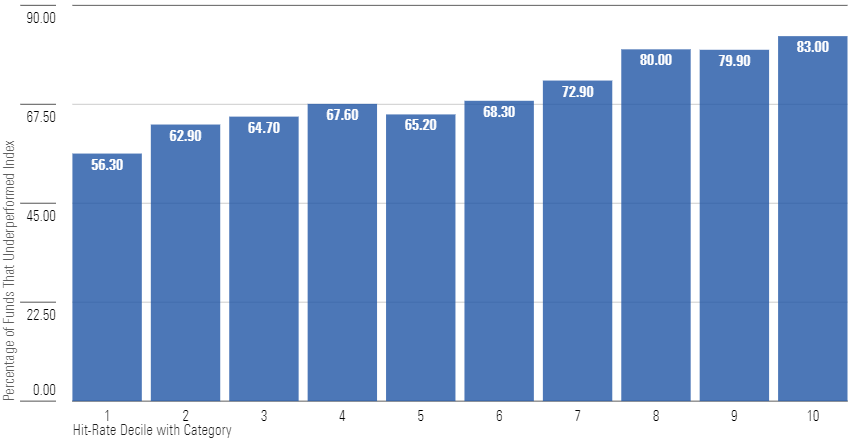
In the aggregate across all nine categories, funds with higher hit rates (that is, lower ranks) tended to underperform far less frequently than those with lower hit rates. It may seem obvious that a fund that picks winners at a higher rate than another fund should do better—however, the success of active management depends on more than just picking winners.
Managers must weight them in a way that produces index-topping performance. Funds that hit it big on a low percentage of stocks can still beat their benchmarks, and funds with hit rates above 50% can still trail the index if poor picks accounted for most of their assets. Hit rates do a decent job of sorting funds on a backward-looking basis, but they still don’t explain variations in fund returns very well.
Stock Hit Rate Distribution: Large-Growth Funds
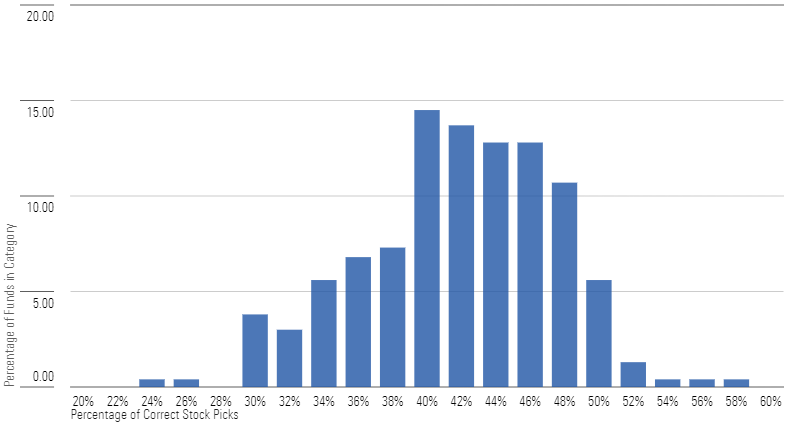
Hit rates tend to matter the least in categories with concentrated universes, like large growth. This study tracked over 96,000 unique positions held by large-growth funds. Of those, only 42% ended up topping the market over their holding periods. Meanwhile, on average, just 39% of the Russell 1000 Growth’s constituents topped the index over rolling three-year periods.
From that standpoint, large-growth managers actually seem to have a better eye for finding winners than the market at large, as shown above. At the fund level, nearly three fourths of large-growth funds had higher hit rates than the market’s 39% hit rate (that is, what a passive investor would’ve experienced). Yet less than a fourth of those funds actually beat the index. The implication is obvious: Most large-growth managers did not own enough of their winners. In many cases, they underweighted the index’s top performers like Apple AAPL, Microsoft MSFT, and Alphabet GOOGL, and allocated money to lower-returning stocks instead.
Still, some large-growth managers overcame low hit rates. Funds like Fidelity OTC FOCPX and JPMorgan Large Cap Growth SEEGX topped their benchmarks meaningfully, despite low hit rates for their category. Both benefited from big wins in sizable holdings. On the other hand, Rational Dynamic Brands HSUAX hit on 57% of its stock picks yet still lagged the index by more than 5% annually because it allocated poorly; its winners were smaller positions and its losers were larger ones.
Market Returns Are Almost Always Concentrated
While the Russell 1000 Growth’s portfolio concentration is historically high, concentrated return streams are not historically unprecedented. In fact, they tend to be the rule. The stock market doesn’t dole out rewards and punishments evenly, and missing a big winner can often be too big a mistake for managers to overcome.
The odds of picking whether a stock will beat the market is usually worse than a coin flip, as most constituents in any index underperform the index over subsequent periods. A relative few winners (or losers) tend to drive results.
Market Breadth Is Usually Narrow for Russell 1000 Growth
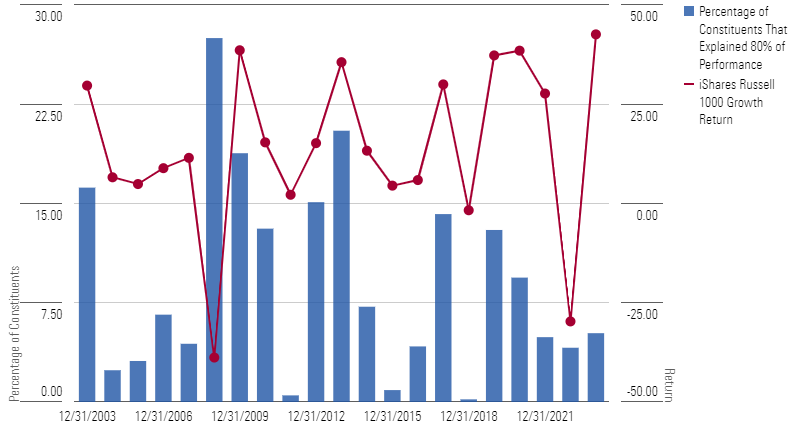
The Pareto Principle, which contends that 80% of outcomes are explained by 20% of causes, tends to hold in financial markets, often in an even stronger form (that is, fewer than 20% of causes explain 80% of outcomes).
Consider the Russell 1000 Growth. Since 2003, less than 20% of the index’s holdings have accounted for 80% of its gains in every calendar year except one, as shown above. Given this reality, breadth of success often takes a back seat to depth of success. That is, how big your winners were matters more than how many winners you owned.
This is not just a large-growth phenomenon, though. Even in small-cap universes, a small percentage of stocks drives returns. For example, since 2003, there have been only three years when more than 20% of the Russell 2000′s holdings explained 80% of its return.
Key Takeaways for Investors
If hit rates were persistent, investors could improve their odds of success by owing funds with the highest hit rates. Unfortunately, hit rates do not seem to be consistent over time. While they do a good job of explaining past performance across nearly all time periods, past hit rates are not reliable forward-looking signals of which managers will be good stock-pickers in the future.
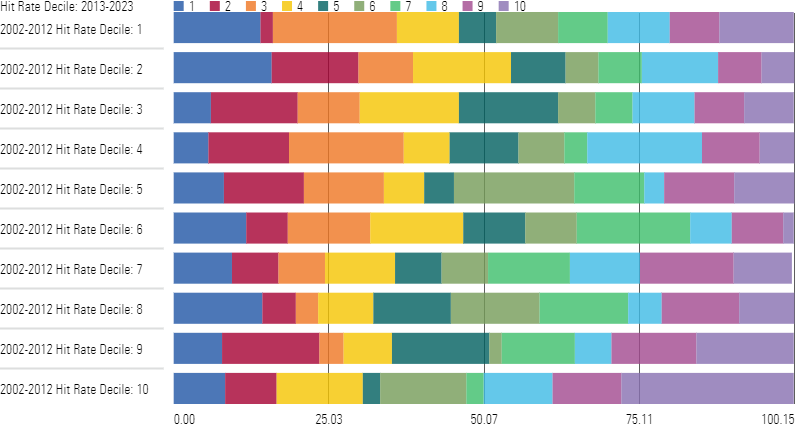
As shown below, few of the top stock-pickers between 2002 and 2012 remained top stock-pickers in 2013-23. More than a fourth of the top-decile stock-pickers in 2002-12 fell to the bottom three deciles in 2013-23. Likewise, more than a fourth of the worst-decile stock-pickers ended up in the top three deciles in 2013-23.
Still, the bottom hit rate decile funds stayed relatively consistent, albeit in the wrong direction. Roughly 50% of the funds in the bottom decile in 2002-12 remained in the bottom three deciles over the next decade. There is likely some survivorship bias at play, as funds that liquidated or merged away were not included in the chart below.
Strong Hit Rates Do Not Persist
Given this information, do-it-yourself investors should approach owning individual stocks with caution. Professional money managers, who have mountains of data at their fingertips, entire floors of analysts supplying them with financial models, and generous travel budgets allowing them to meet with company management teams, still get most of their stock picks wrong. That does not bode well for someone seeking to build a do-it-yourself portfolio while working a day job. Complicating the challenge is the need to size portfolio positions appropriately, which is tougher in a managed portfolio than a passive one that lets the market do the rebalancing. The real challenge active managers (and DIY-ers) face is not in getting more picks right than the market but rather in sizing them in a manner that leads to outperformance.
On the whole, active managers tend to be right about stocks as often as the market overall. The fact that they consistently underperform passive options exposes their Achilles’ heel: portfolio construction. Active managers do not appear, in the aggregate, to be able to weight a portfolio more effectively than the collective wisdom of the market.
The author or authors do not own shares in any securities mentioned in this article. Find out about Morningstar’s editorial policies.
/cloudfront-us-east-1.images.arcpublishing.com/morningstar/T2LGZCEHBZBJJPPKHO7Y4EEKSM.png)
/d10o6nnig0wrdw.cloudfront.net/07-25-2024/t_56eea4e8bb7d4b4fab9986001d5da1b6_name_file_960x540_1600_v4_.jpg)
/cloudfront-us-east-1.images.arcpublishing.com/morningstar/BU6RVFENPMQF4EOJ6ONIPW5W5Q.png)
:quality(80)/s3.amazonaws.com/arc-authors/morningstar/b0c51583-b9a2-49eb-9a8f-5f25a8bda4a3.jpg)