
May ETF Flows Favor Recent Winners from Divergent Stock Market
Led by large-blend, technology, and Treasury funds, U.S. ETFs collected $35 billion of inflows in May.
/s3.amazonaws.com/arc-authors/morningstar/30e2fda6-bf21-4e54-9e50-831a2bcccd80.jpg)

Key Takeaways
- U.S. exchange-traded funds pulled in an estimated $35 billion in May, a slight increase from their April and May hauls
- Strong flows into U.S. large-blend strategies helped stock ETFs collect nearly $21 billion.
- Investors pulled a record $7 billion from large-value funds in their fifth straight month of outflows.
- Technology ETFs absorbed more than $9 billion behind enormous flows into Vanguard Information Technology ETF VGT.
- Commodities ETFs collected $1 billion in May, their most lucrative month since April 2022.
- The Morningstar US Market Index scraped out a 0.45% gain as the market’s largest firms papered over weak mid- and small-cap performance.
- The Morningstar US Core Bond Index lost 1.07% as default concerns on U.S. Treasuries and hotter-than-expected labor and inflation data resurfaced.
Bonds Face Familiar Concerns
The exhibit below shows May returns for a sample of Morningstar analyst-rated ETFs that serve as proxies for major asset classes. Investors in a blended portfolio lost 0.93% last month, as U.S. bonds and foreign stocks weighed on returns.
May Market Performance Through the Lens of Analyst-Rated ETFs
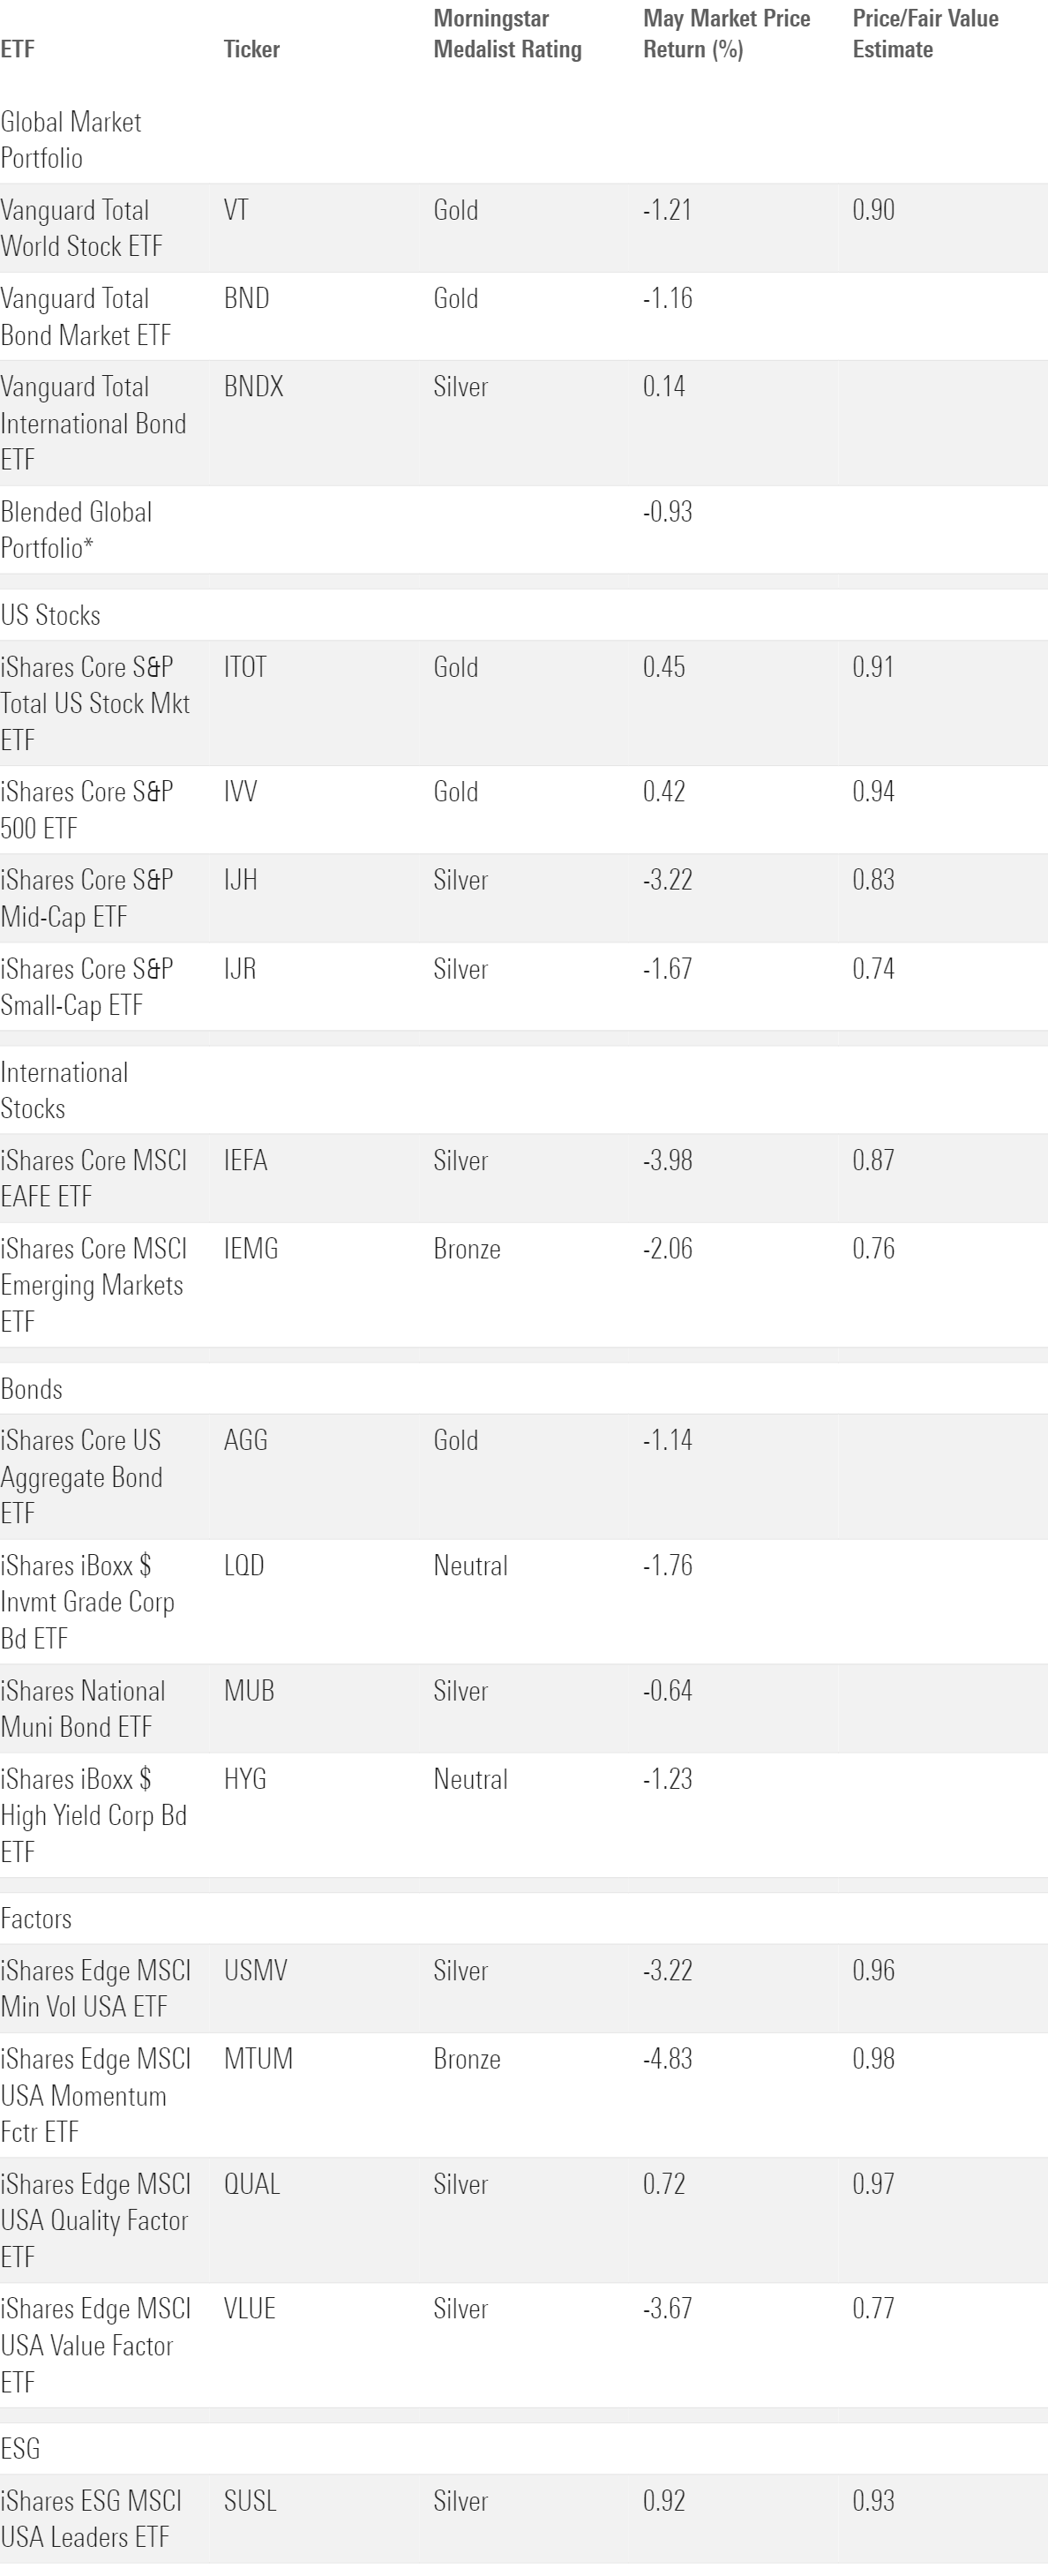
Vanguard Total Bond Market ETF BND hampered the blended portfolio’s bond sleeve with a 1.16% loss in May. Against the backdrop of a then-unresolved U.S. debt ceiling, investors digested many of the same economic concerns that punished bonds in 2022. Initially, most market participants believed the interest-rate hike that the Federal Reserve greenlit in its May 3 meeting would mark the last for a while. But hotter-than-expected inflation and labor data emerged throughout the month, casting doubt on whether the Fed would pause rate hikes like it hinted it would.
The uncertainty around the Fed’s course hit longer-term portfolios the hardest because they are more sensitive to interest rates. IShares 20+ Year Treasury ETF TLT shed 3.02%, while iShares Short Treasury Bond ETF SHV scratched out a 0.32% gain. Most bond ETFs that prioritize credit risk landed somewhere in the middle. IShares Broad USD Investment Grade Corporate Bond ETF USIG and SPDR Bloomberg High Yield Bond ETF JNK declined 1.42% and 1.25%, respectively.
Foreign Stocks Falter
Vanguard Total World Stock ETF VT pulled back 1.21% in May. Its developed-market European stocks—17% of the portfolio entering May—had a particularly rough month. Several of the continent’s most prominent economies continued to wrestle with inflation but didn’t see the economic growth that normally comes with it. As consumer sentiment and household consumption declined, inflation did not, putting central bankers in a difficult position moving forward. This predicament manifested in the markets: Morningstar indexes that track German, French, and U.K. stocks slid between 5.5% and 7.5% apiece in May. IShares Core MSCI Europe ETF IEUR tumbled 5.41% in a reality check for one of the global market’s hottest corners to start 2023.
Emerging-markets stocks held up a bit better than their developed peers in May. IShares Core MSCI Emerging Markets ETF IEMG slid 2.06%, about half the 3.98% drawdown that the iShares Core MSCI EAFE ETF IEFA endured. It got a boost from its 16% stake in Taiwan, where semiconductor producers like Taiwan Semiconductor Manufacturing Company TSM and MediaTek MDTKF clocked excellent growth. Indian and South Korean stocks fared well, too. Even after beating IEFA last month, IEMG trailed its developed-markets counterpart by about 5 percentage points for the year to date through May.
Uneven U.S. Equities
Vanguard Total Stock Market ETF VTI ticked up 0.43% in May. That mild return belies the chasm between the U.S. market’s haves and have-nots that expanded in May. Only 25% of S&P 500 stocks finished May in the black, but most that did 1) won big and 2) sat toward the top of the index. The average top-10 S&P 500 holding climbed 12.19% in May, while all the others peeled back an average of 4.11%.
California-based semiconductor manufacturer Nvidia NVDA stole the show in May. It jumped 36.34% on the month and more than 24% on May 25 alone after unveiling tremendous earnings. Nvidia’s market cap finished May about $248 billion larger than where it started. Fellow semiconductor companies Broadcom AVGO and Advanced Micro Devices AMD climbed over 28% apiece, as the market crowned semiconductor companies as the main beneficiaries of the artificial intelligence frenzy that has dominated headlines and earnings calls. VanEck Semiconductor ETF SMH advanced 16.75% for the month and 41.93% for the year to date through May.
Semiconductors powered Technology Select Sector SPDR ETF XLK to an 8.92% May return. That and its 32.31% year-to-date gain both led SPDR’s suite of sector ETFs. Communication Services Select Sector SPDR ETF XLC is not far behind, up 30.05% since the start of 2023. Fueled by double-digit May returns from Alphabet GOOG and Meta Platforms META, it rose 3.91% last month. And Consumer Discretionary Select Sector SPDR ETF XLY advanced 2.45% as Amazon.com AMZN and Tesla TSLA—which jointly constitute 40% of the portfolio—gained 14.35% and 24.11% in May, respectively.
All the other SPDR sector funds finished May in the red. In the case of Energy Select Sector SPDR ETF XLE, it was more of a crimson: The fund tumbled 10.03% as oil prices sank by about the same amount. Materials Select Sector SPDR ETF XLB fared poorly, too, losing 6.87% in its worst month since September 2022. A common thread between these sectors is their sensitivity to commodity prices. As energy companies respond to oil, many materials firms fluctuate based on the price of precious metals. Indeed, Invesco Optimum Yield Diversified Commodity Strategy No K-1 ETF PDBC, a broad basket of those commodities and more, dipped 6.5% in May.
Unbalanced sector performance only widened the growing gap between growth and value stocks in 2023. Vanguard Growth ETF VUG climbed 5.17% in May, while Vanguard Value ETF VTV shed 4.12%. That 9.29% disparity is the largest one-month spread in the funds’ history, which dates back to their early-2004 inception. VUG beat VTV by about 28 percentage points for the year to date through May, coming close to erasing the lead the VTV built when it held up far better during the 2022 bear market.
Stock ETFs Pick up the Pace
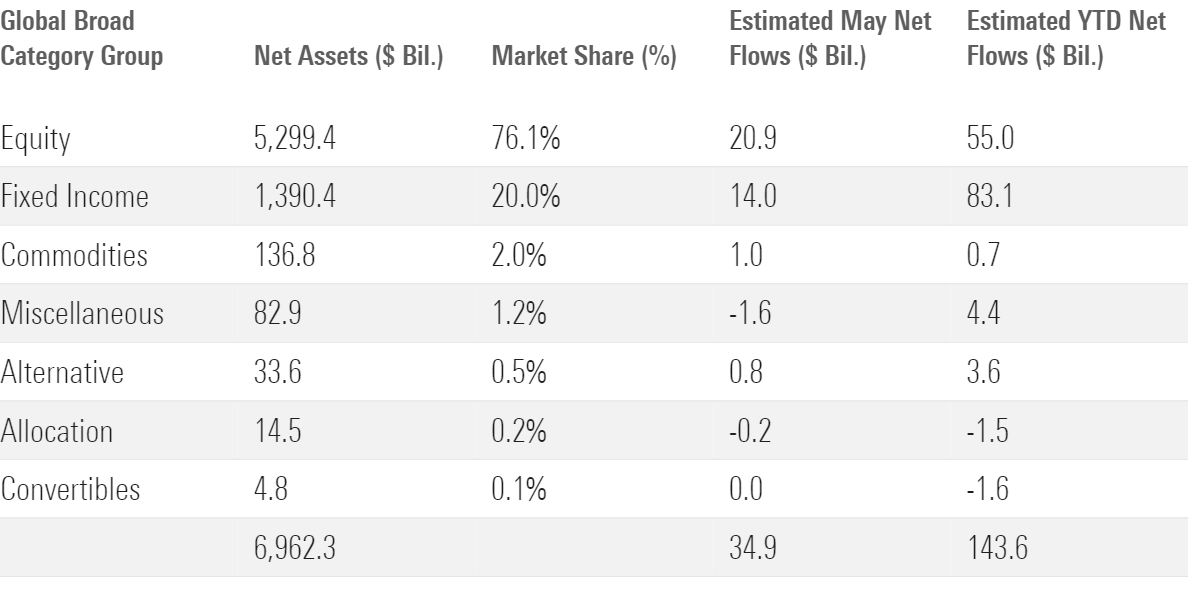
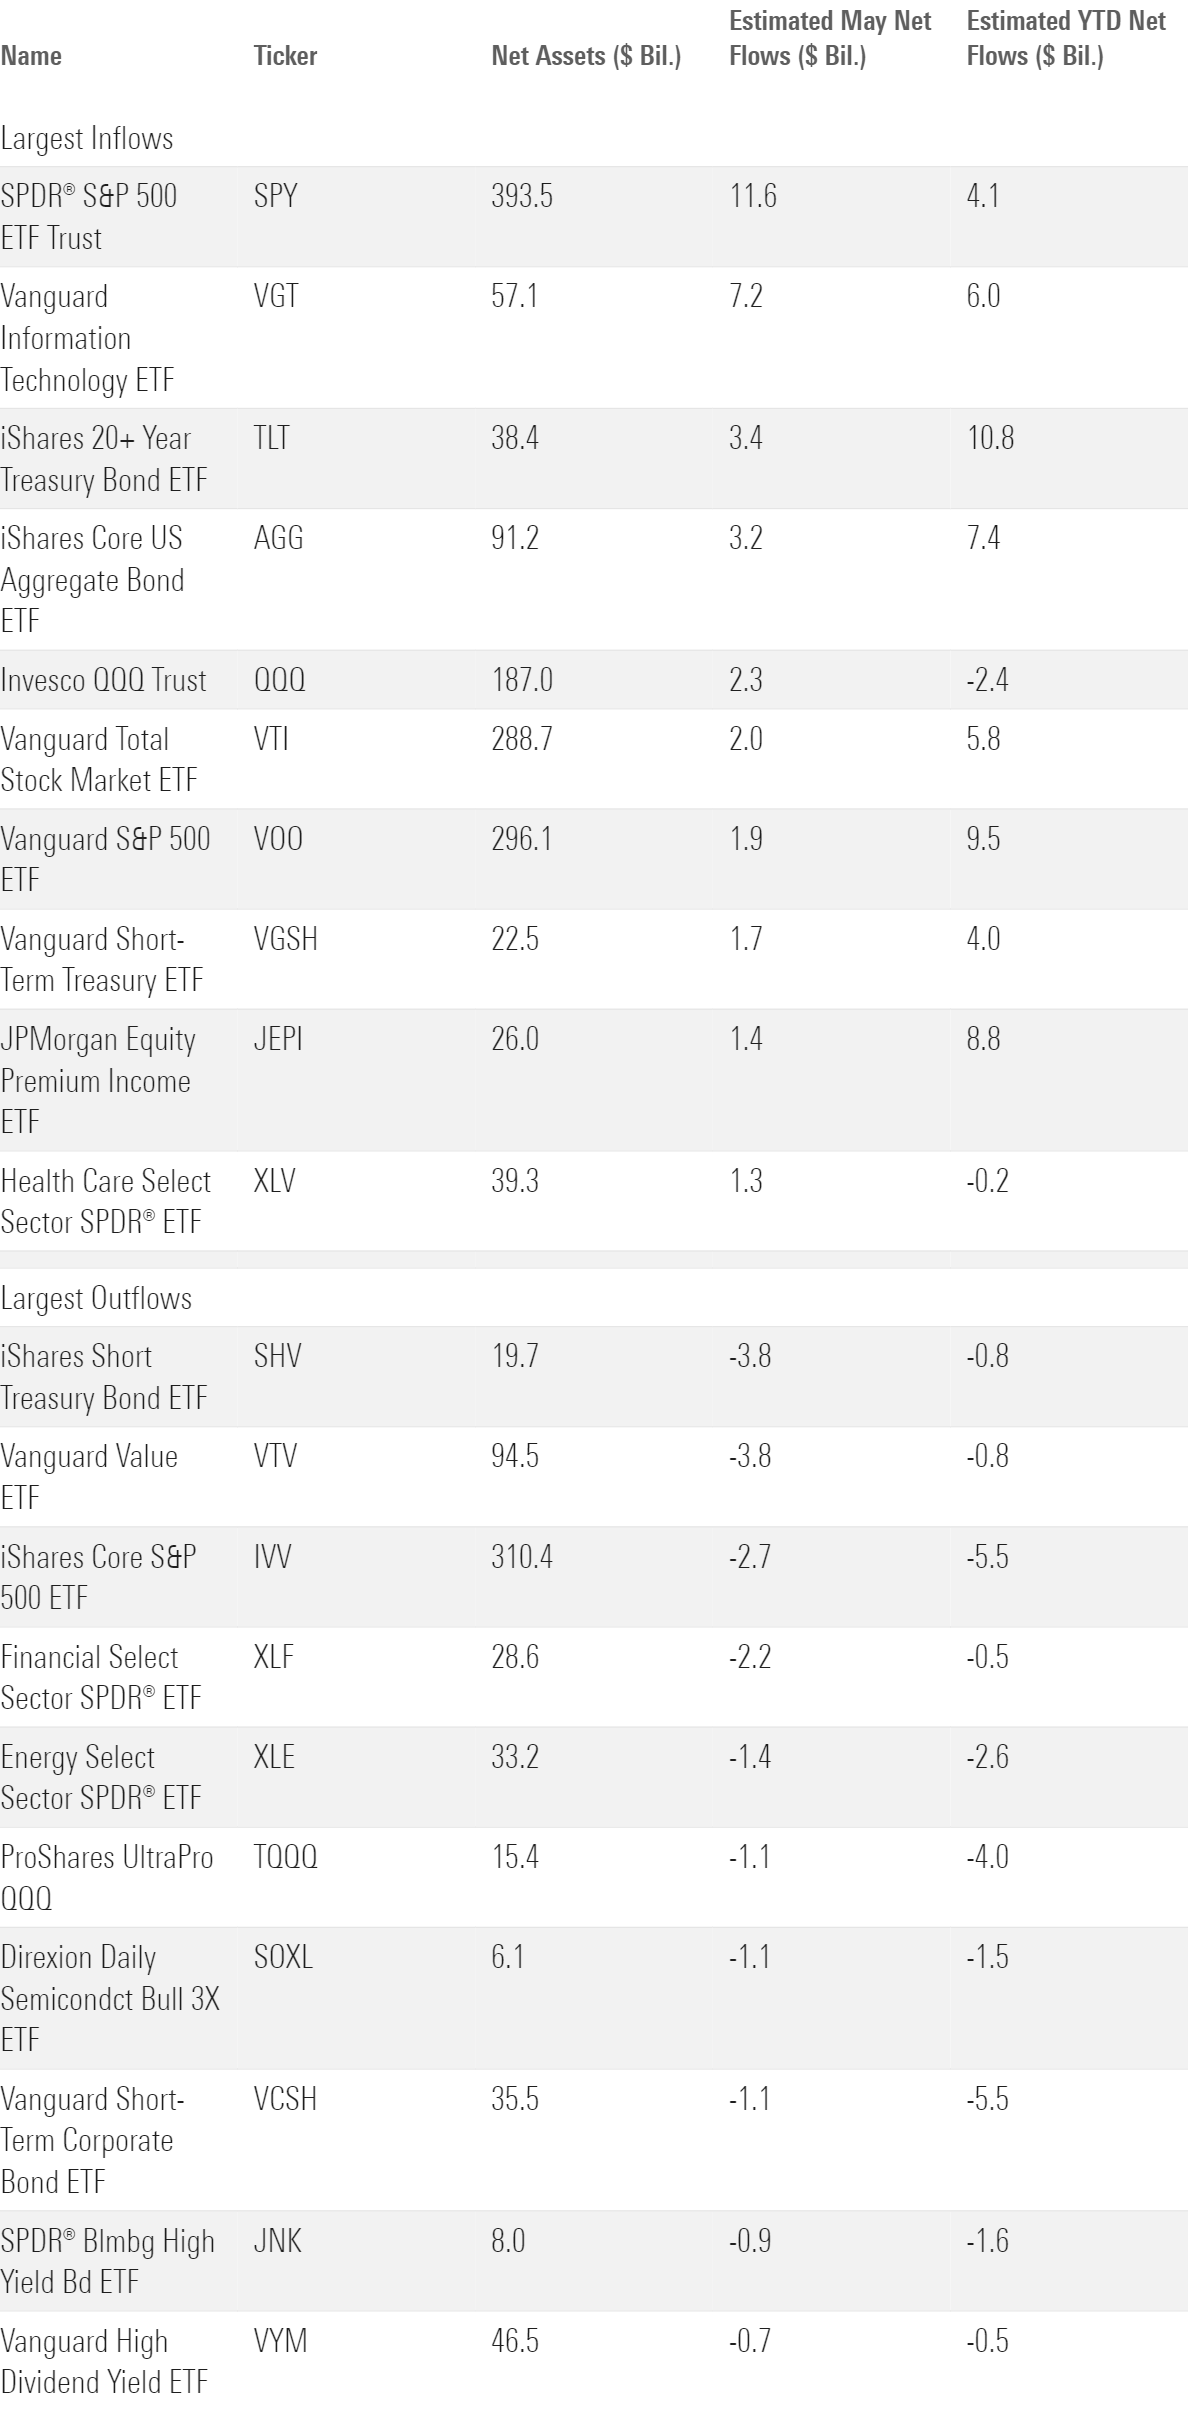
Stock ETFs collected $20.9 billion in May, as U.S. large-blend funds saw strong inflows of $15.5 billion. After an uncharacteristically quiet start to the year, the large-blend Morningstar Category is building momentum. SPDR S&P 500 ETF Trust SPY provided the spark in May. The vehicle of choice in the trading community spent last month in traders’ good graces, pulling in almost $12 billion. Vanguard S&P 500 ETF VOO and Vanguard Total Market ETF VTI—last year’s top flows finishers—reeled in about $2 billion apiece as well. About 26% of total ETF assets sat in U.S. large-blend funds as of May 2023. Flows to and from this corner of the market often tell the story of the ETF market overall.
May Flows Across Morningstar Broad Category Groups
Morningstar Categories With the Largest May Flows
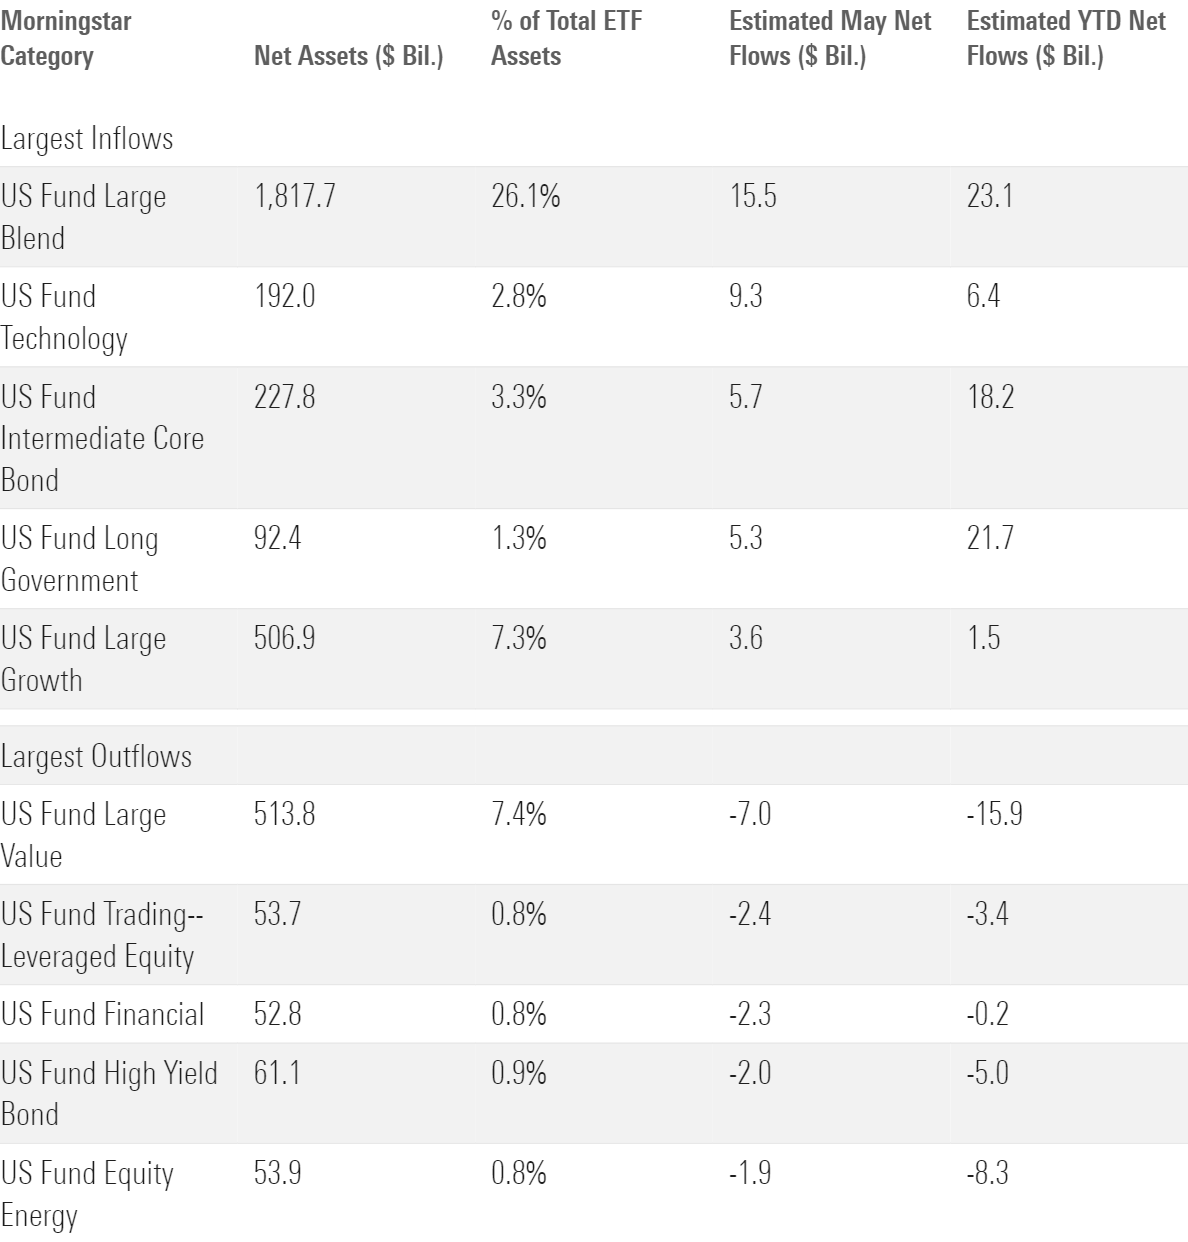
May was not as kind to certain U.S. equity segments: Investors pulled about $7 billion from large-value funds in May. That marked their fifth consecutive month of outflows, large-value funds’ longest such streak since January through May 2009. It also represented their largest one-month exodus since value ETFs hit the market in the late 1990s. Value bellwethers have taken it on the chin: Vanguard Value ETF VTV shed $3.8 billion in May, and another $350 million out of iShares Russell 1000 Value ETF’s IWD doors pushed that fund’s year-to-date outflow over $5 billion. Dividend funds haven’t papered over these issues after they starred in 2022. Investors have pulled $2 billion from value dividend strategies in 2023. Growth ETFs, on the other hand, collected $3.6 billion—enough to push them into inflow territory on the year.
Flows between sector ETFs told a similar value/growth story, with one crucial plot point: Technology ETFs collected $9.3 billion, a category record. Almost all that money funneled into Vanguard Information Technology VGT, the now-$57 billion fund whose asset base ballooned when it pulled in $6.6 billion on May 30 alone. That it happened in such a burst suggests that VGT benefited from a change to a widely followed model portfolio, much like the QUAL-for-ESGU swap in March 2023. Meanwhile, investors fled ETFs tracking the value-oriented energy, financial, real estate, and industrial sectors, likely repelled by subpar performance.
ETFs With the Largest May Flows
Bond ETF Flows Keep Coming In
Investors plowed about $14 billion into bond ETFs in May, a sum that trailed stock ETFs in absolute terms but translated into a higher organic growth rate, which scales for size. Bond ETFs’ $83 billion year-to-date haul equated to about a 6.4% OGR over the first five months of 2023, compared with $55 billion and 1.1% for stock ETFs. Intermediate core bond funds led the way in May, spearheaded by iShares Core U.S. Aggregate Bond ETF AGG and its $3.2 billion intake.
Investors favored riskier bond funds for the first time all year in April, but bond ETF flow patterns in May made that look more like an anomaly than an inflection point. Fixed-income investors resumed the safety dance last month, plowing over $11 billion into the government-bond funds that they preferred earlier in the year and in 2022. Ironically, the uncertainty around the U.S. government debt ceiling may have sparked a flight to safety that drove investors to U.S. government debt. A U.S. government default would likely start a hurricane in the bond market, and many investors felt safest in the eye of the storm.
Shorter-term bond funds endured widespread outflows for the second straight month in May. After a scorching first quarter, the ultrashort bond category shed more than $1.3 billion in back-to-back months. Short-term bond funds suffered their fourth consecutive month of outflows and have now bled nearly $6 billion for the year to date. These shorter-dated bond funds seem mired in a sour spot, as investors are eager to capitalize on money market funds’ attractive interest yields or lock in rates with longer-term bond offerings.
Gold ETFs Return to the Scene
Funds in the commodities-focused category reeled in $1.4 billion in May. SPDR Gold Shares ETF GLD led the way with $871 million of inflows. This cohort, which mostly comprises gold strategies, hadn’t collected more than $1 billion in any month since March 2022, when investors turned to precious metals as inflation hedges. It’s been rocky since then; focused commodity funds bled about $17.5 billion over the 12 months entering May. But as a banking crisis and debt ceiling uncertainty have made some investors trepidatious, it seems many have turned to a store of value that has been around for generations.
Tactics and Thematics
Investigating the more tactical corner of the ETF market can shine a light on investor sentiment. It painted a cynical picture in May. Inverse equity ETFs—strategies that short indexes or portfolios—pulled in about $754 million, while the ETFs that offer leveraged long exposure to similar stocks collectively bled about $2.5 billion. Investors in these products cut their exposure to tech and semiconductor stocks in particular, abiding by a “sell the rip” philosophy. Direxion Daily Semiconductor Bull 3X ETF SOXL—up 47.78% in May—shed $1.1 billion for the month.
Thematic funds tagged with some version of “artificial intelligence” in Morningstar’s database reeled in nearly $400 million in May. Plenty of funds have high AI exposure but fit better in a broader category like technology or large growth. Still, funds like Global X Robotics & Artificial Intelligence BOTZ certainly capitalized on AI’s coming-out party: The $235 million it collected in May translated into an organic growth rate of nearly 14%. While fundholders gladly accepted BOTZ’s 10.12% May return, investors should be cautious that thematic funds require several good calls in order to pan out.
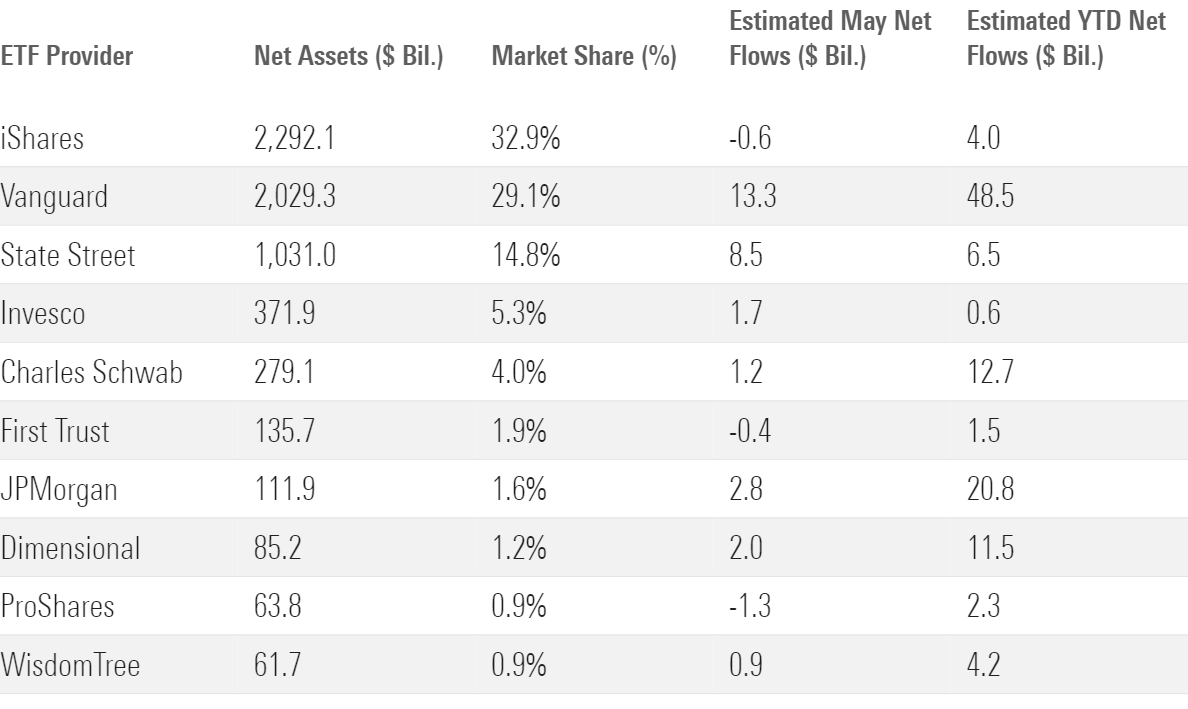
Vanguard Extends Its Lead
Vanguard pulled in $13.3 billion of inflows in May, leading all ETF providers in monthly flows. That was business as usual for Vanguard, but the recipe it used was not its bread and butter. Vanguard’s lineup of U.S. equity strategies represented about 56% of its ETF assets and tended to attract most of the firm’s monthly ETF flows. However, these funds actually leaked about $1.1 billion in May, as VTV’s woes set the whole lineup back. Fixed-income products like Vanguard Short-Term Treasury ETF VGSH ($1.7 billion inflow) and BND ($1.2 billion) picked up the slack, and VGT’s record-setting haul catapulted it into first place for May.
May Flows for the 10 Largest ETF Providers
Paying up for Quality
The fair value estimate for ETFs rolls up our equity analysts’ fair value estimates for individual stocks and our quantitative fair value estimates for stocks not covered by Morningstar analysts into an aggregate fair value estimate for stock ETF portfolios. Dividing an ETF’s market price by this value yields its price/fair value ratio. This ratio can point to potential bargains and areas of the market where valuations are stretched.
The 10 Most Under- and Overvalued Morningstar Analyst-Rated ETFs
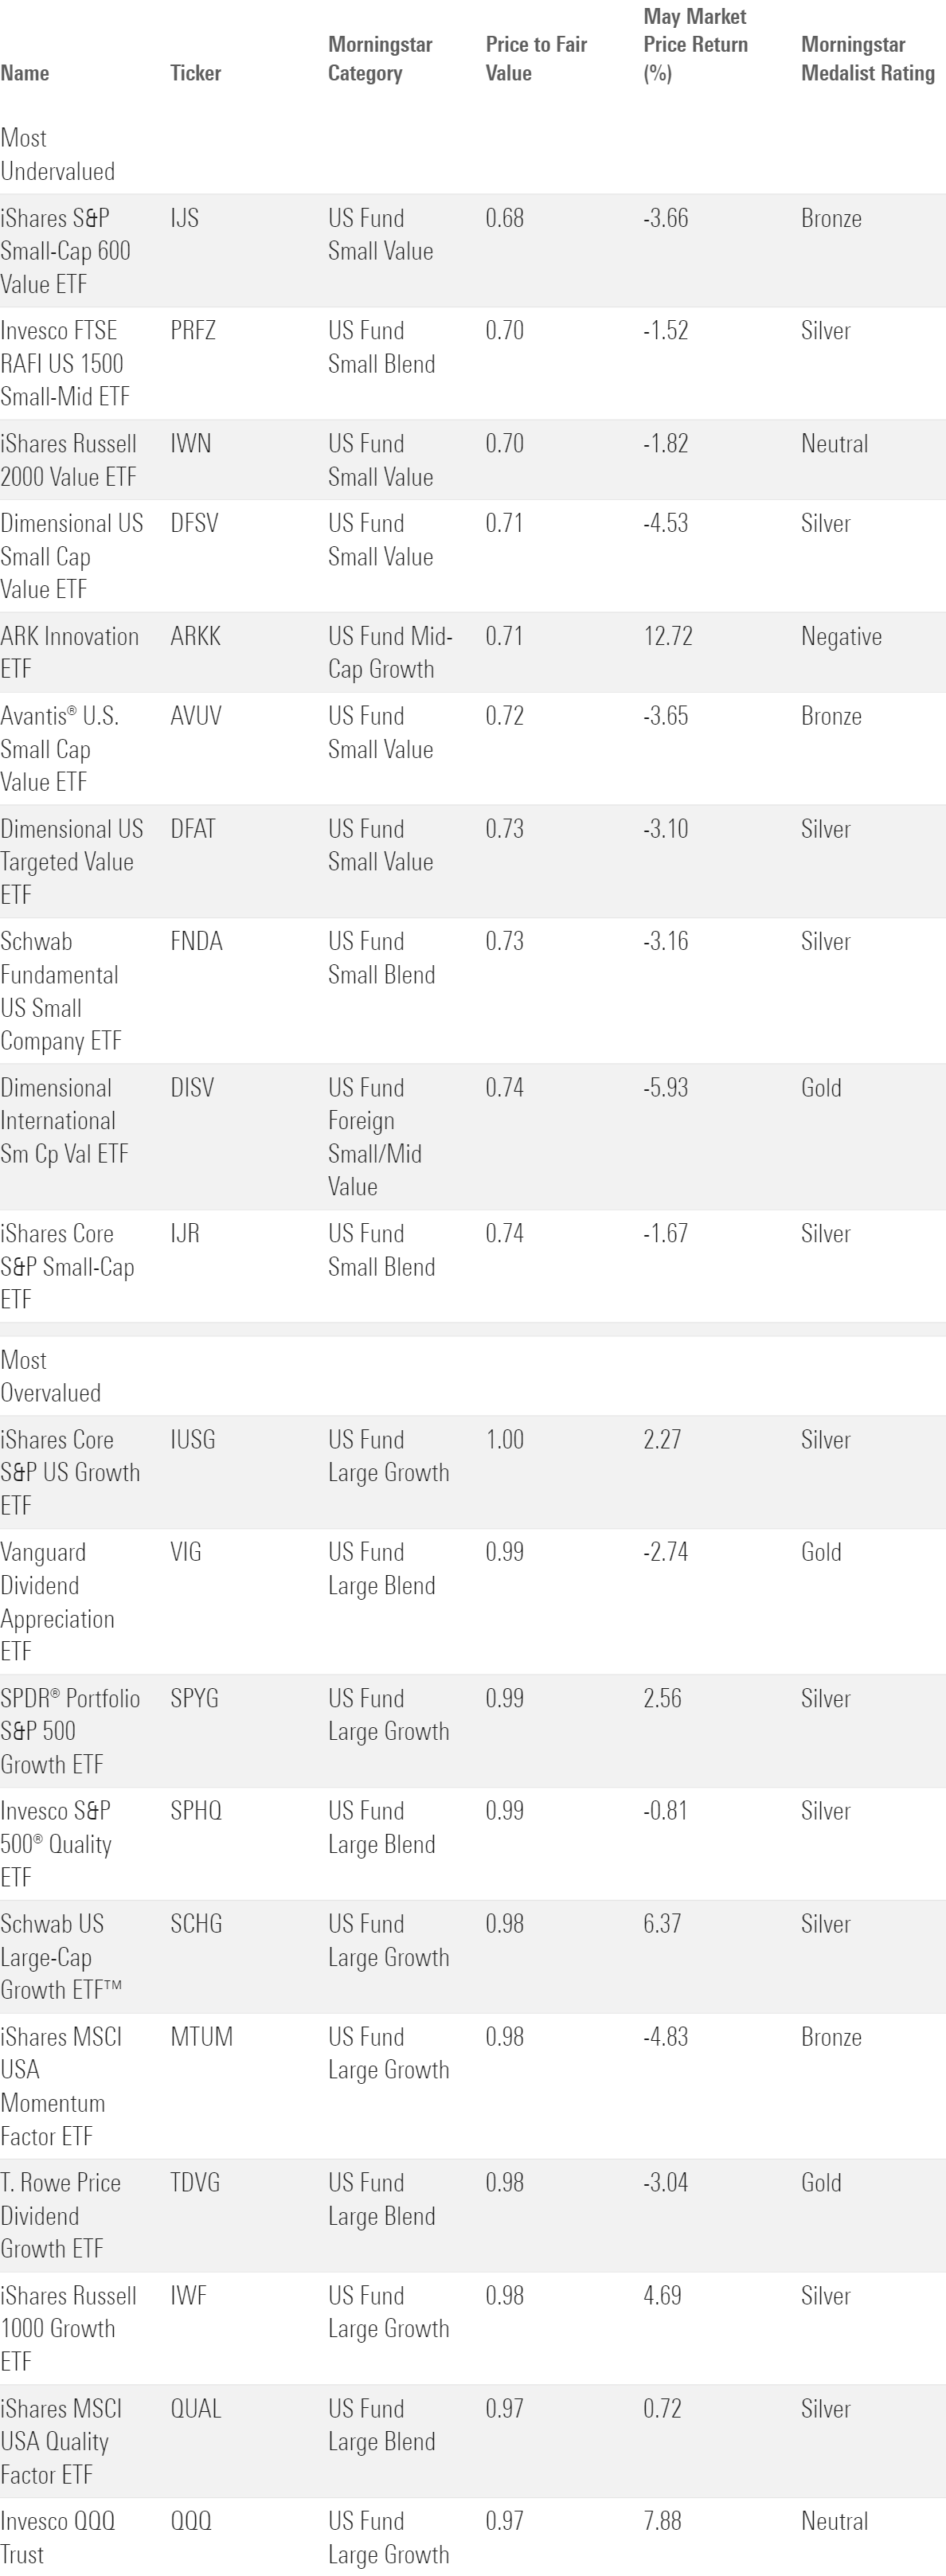
Small-cap stock ETFs continue to look undervalued after finishing another month behind their large-cap peers. Small-value funds offer the deepest discount; the six analyst-rated funds traded an average of 27% below their fair value at May’s end. Even iShares Core S&P Small-Cap ETF IJR offered a 26% discount as of May 31, 2023. Weak performance has shrunk the numerator in small-cap funds’ price/fair value ratios; IJR trailed IVV by 11.61 percentage points for the year to date through May.
That said, investors should note that small-cap funds sit in a delicate position. Should banks tighten lending standards in response to the Silicon Valley Bank crisis, small-cap companies would likely be affected more acutely than their better-established peers that can obtain financing more easily. Small-cap funds that favor profitable, financially sound stocks may better navigate a tighter environment. Avantis U.S. Small Cap Value ETF AVUV and Dimensional U.S. Small Cap Value ETF DFSV both fit that description and sport Morningstar Medalist Ratings of Silver.
At the end of May, all Morningstar analyst-rated ETFs traded below their fair value. Two funds that rested at the pricier end of the analyst-rated range target the quality factor, iShares MSCI USA Quality ETF QUAL and Invesco S&P 500 Quality ETF SPHQ, both trade within 3% of their fair value. That should come as little surprise, as profitable, well-established firms don’t come cheap. These funds have rewarded investors willing to lean into the premium: Both ranked within the large-blend peer group’s top quartile over the 12 months through May 2023. While there are much cheaper options out there, investors keen on wonderful companies may find their current prices fair.
The author or authors do not own shares in any securities mentioned in this article. Find out about Morningstar’s editorial policies.
/cloudfront-us-east-1.images.arcpublishing.com/morningstar/T2LGZCEHBZBJJPPKHO7Y4EEKSM.png)
/d10o6nnig0wrdw.cloudfront.net/04-18-2024/t_34ccafe52c7c46979f1073e515ef92d4_name_file_960x540_1600_v4_.jpg)
:quality(80)/s3.amazonaws.com/arc-authors/morningstar/30e2fda6-bf21-4e54-9e50-831a2bcccd80.jpg)