
How to Invest Better With Bonds
Sharpening your fixed-income portfolio allocations can improve results.
/s3.amazonaws.com/arc-authors/morningstar/08b315db-4874-427f-b3b1-f2b84a16e609.jpg)
/s3.amazonaws.com/arc-authors/morningstar/fadee740-dfeb-494d-95b1-c462d0ac1f59.jpg)
Higher yields have spurred investors to take a closer look at bonds. New Morningstar research suggests that, as they do, investors should rethink how they assemble their portfolios. Simply mirroring the fixed-income market, as represented by the Morningstar US Core Plus Bond Index, may not be the best recipe for success.
This article provides a practical summary of our recent paper, “Sharpening Fixed-Income Portfolio Allocations,” and suggests ways to put its key takeaways to use in portfolios.
The Sharpe Ratio
The starting point for our research is the Sharpe ratio, a well-known measure of risk-adjusted performance. Its numerator is an investment’s return in excess of a sure bet, like three-month Treasury bills; and its denominator is the volatility, or standard deviation, of that excess return.
The Sharpe ratio’s appeal is intuitive. In comparing two investments that both outperform by 5% annually over a long period, for example, the Sharpe ratio penalizes the one whose price oscillates more along the way—in effect, rewarding the steadier one. When it comes to the Sharpe ratio, higher is better.
But building a best-in-class portfolio is not just a matter of choosing the top asset classes in terms of Sharpe ratio. The direction and extent to which asset class prices change in relation to each other, or their covariances and correlations, matter as well. Thus, the Sharpe-optimal portfolio is the one whose mix of asset classes maximizes excess return relative to its standard deviation.
Given the Sharpe ratio’s prominence, one might assume that Sharpe-optimal portfolios are the norm, but that’s not the case. Using return data on intermediate U.S. government bonds and U.S. large-cap stocks since 1926 and optimizing for Sharpe ratio leads not to the standard 60% stock/40% bond portfolio but something closer to a 20% stock/80% bond allocation.
Investing Better in Theory
The contemporary bond market’s diversity, in theory, allows for an even smaller equity stake. Drawing on Morningstar Index data since 2000 and sticking to major U.S.-dollar-denominated asset classes, optimizing for Sharpe ratio results in a 5% stock allocation, far smaller than is typical in all but the most conservative portfolios, and a bond allocation whose subsector weightings look quite different from the broad fixed-income market.
Exhibit 1 Sharpe-Optimized Portfolio vs. Broad Fixed Income Market
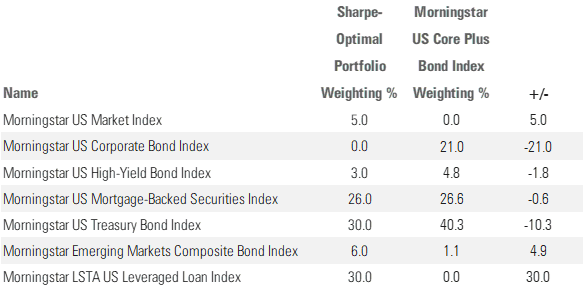
Exhibit 1 shows how the Sharpe-optimized portfolio’s weightings compare with those of the Morningstar US Core Plus Bond Index as of September 2023. The bond portion results would not be much different if equities, represented by the Morningstar US Market Index, had been excluded from the calculations. That means it is the direction and extent of the bond sector movements that are driving the allocations, not the presence of stocks.
Within the Sharpe-optimized portfolio of Exhibit 1, the investment-grade corporate market is not represented, even though it accounts for one fifth of the index. Credit risk, or the potential that a borrower won’t make timely payments of interest and principal, instead comes largely from low-volatility leveraged loans, or bank loans. Indeed, the portfolio’s leveraged loan weighting is 30%, versus zero for the benchmark (which excludes this more than $1 trillion asset class as a matter of index construction).
Why such a big bank loan weighting? In our data dating to 2000, bank loans tended to move less in lockstep with Treasuries than did investment-grade corporate bonds. Thus, their sizable inclusion in the portfolio made for a better overall Sharpe ratio.
Bank loans have unique risks to bear in mind. They aren’t regulated in the same way as stocks and bonds, and trades can take longer to settle. Holding loans through a fund mitigates those longer settlement times, but longer settlement times can also make the asset class more vulnerable to narrow market shocks. The bank loan space has also evolved and is less staid than it was during the earlier years of our dataset.
Although the future will not repeat the past, there’s good reason to think bank loans will continue to contribute to a higher Sharpe ratio. By design, bank loan coupons rise when interest rates go up and, hence, when Treasuries tend to sell off. Those dynamics were evident in 2022, for example, when the Federal Reserve repeatedly raised interest rates to combat inflation. The Morningstar US Treasury Bond Index lost 12.4% that year, versus a drop of 0.8% for the Morningstar LSTA US Leveraged Loan Index. The U.S. stock market, by contrast, shed nearly 20% in 2022.
Investing Better in Practice
Theory doesn’t always work in practice, though. Indeed, academic theory suggests investors who want to increase portfolio returns beyond what a 5% stock allocation would produce should employ financial leverage. But that’s hard to implement in practice and courts considerable risk if extreme market events exceed expectations.
A more actionable alternative is for investors to build their bond portfolios around a minimum desired equity weighting. While that may lead to a suboptimal experience from the standpoint of the Sharpe ratio, it can help them meet their real-world goals without recourse to leverage, and the Sharpe ratio can still be useful in optimizing the bond portion of the portfolio once a minimum equity percentage has been determined.
Exhibit 2 Sharpe-Optimized Portfolios with Required Minimum Equity Allocations
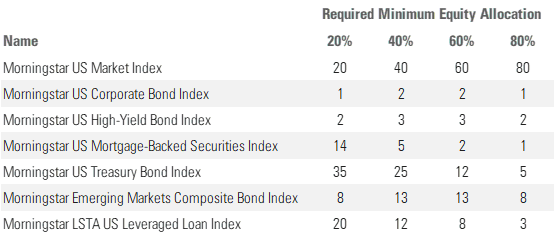
Exhibit 2 illustrates how bond allocations shift as an investor’s minimum required equity weighting increases from 20% to 80% by increments of 20 percentage points. Corporate bonds go from no role in the prior exhibit, where the equity weighting was 5%, to a modest one throughout this one. Most notable of all, though, the emerging-markets-debt allocation increases to double digits at equity weightings of 40% and 60%, and is the highest bond exposure in the latter portfolio.
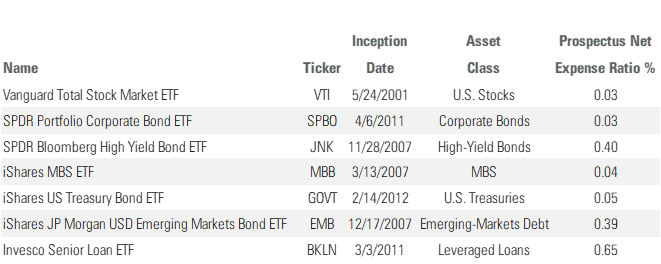
Implementation
Building portfolios that approximate Morningstar Index exposures is not difficult. Those interested in implementing one of these Sharpe-optimized portfolios may use the seven exchange-traded funds in Exhibit 3. The list includes some pricey options, such as the 65-basis-point Invesco Senior Loan ETF BKLN, but the weighted-average cost of this portfolio series at its most expensive (the 95% bond allocation) is about 26 basis points per year and at its cheapest (the 80% equity allocation) is less than 9 basis points annually.
Exhibit 3 Exchange-Traded Fund Implementation of Sharpe-Optimized Portfolios
Performance
An investor who used these ETFs to build one of our Sharpe-optimized portfolios would have done well over more than a decade. Exhibit 4 shows the absolute and risk-adjusted results of all five Sharpe-optimized portfolios shown in this article from March 2012, the funds’ earliest common inception, through September 2023. The plus/minus columns compare that performance to the results of an equivalent stock/bond mix using Vanguard Total Stock Market ETF VTI and Vanguard Total Bond Market ETF BND. For example, the Sharpe-optimized 5% Equity portfolio beat a 5%-95% blend of Vanguard Total Stock Market and Vanguard Total Bond Market in every respect. Its 2.13% annualized gain over the period was 48 basis points more, its 3.73% standard deviation was 72 basis points lower, and its 0.30 Sharpe ratio doubled its rival’s. Since the Sharpe-optimized portfolios also use Vanguard Total Stock Market ETF for their equity weighting, what the plus/minus columns highlight is the difference between bond portfolio performance.
Exhibit 4 Sharpe-Optimized Portfolios versus Blend of Vanguard Total Stock Market ETF VTI and Vanguard Total Bond Market ETF BND
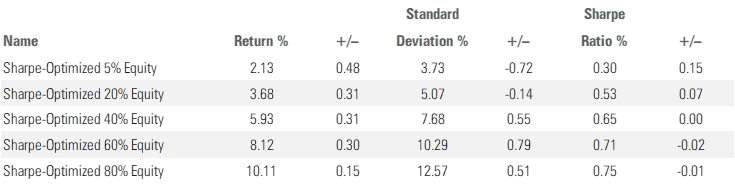
Given that increased equity exposure imposes more of a constraint, the Sharpe-optimized portfolios’ results are quite competitive. Their annualized return beat each equivalent stock/bond mix. The degree of that outperformance declined from 48 basis points to 15 basis points as the equity weighting moved from 5% to 80%. The standard deviation of the two most bond-heavy Sharpe-optimized portfolios was also lower, though as the equity weighting moved beyond 20%, the Sharpe-optimized portfolios became more volatile. Still, the Sharpe ratios of the optimized portfolios continued to be superior up to a 40% required equity weighting, at which point they either matched or were about in line with their stock/bond equivalents.
Our Sharpe-optimized portfolios proved competitive not just with passive stock/bond mixes but also with topnotch actively managed counterparts. Although not reflected in Exhibit 4, our white paper looks at the results of more finely tuned portfolio mixes, including a Sharpe-optimized 65% equity portfolio that gained 8.61% annualized from March 2012 through September 2023. Its return would have placed in the moderate-allocation Morningstar Category’s best decile, ahead of well-known balanced funds like Vanguard Wellington VWENX (8.23%) and American Funds American Balanced RLBGX (8.40%), which have respective Morningstar Medalist Ratings of Gold and Silver.
Granted, American Balanced’s 0.81 Sharpe ratio and Vanguard Wellington’s 0.76 over that period beat the Sharpe-optimized 65% equity portfolio’s 0.72. But that was likely owing to those funds’ less volatile equity portfolios, given their focus on dividend-paying stocks. In any case, a 0.72 Sharpe ratio was still good enough to place in the moderate-allocation category’s top quintile.
Conclusion
Even those who opt not to implement one of our Sharpe-optimized portfolios may still want to reconsider their approach to portfolio construction. Big allocations to investment-grade bonds, for example, might seem difficult to justify based on their correlations with other asset classes, while leveraged loans may deserve a greater role in many portfolios.
3 Great Bond ETFs
The author or authors do not own shares in any securities mentioned in this article. Find out about Morningstar’s editorial policies.
/cloudfront-us-east-1.images.arcpublishing.com/morningstar/G3DCA6SF2FAR5PKHPEXOIB6CWQ.jpg)
/cloudfront-us-east-1.images.arcpublishing.com/morningstar/6ZMXY4RCRNEADPDWYQVTTWALWM.jpg)
:quality(80)/s3.amazonaws.com/arc-authors/morningstar/08b315db-4874-427f-b3b1-f2b84a16e609.jpg)
:quality(80)/s3.amazonaws.com/arc-authors/morningstar/fadee740-dfeb-494d-95b1-c462d0ac1f59.jpg)