
ETF Investors Stuck to the Script in August
Plain-vanilla, broadly diversified index funds continued to attract healthy flows last month.
/s3.amazonaws.com/arc-authors/morningstar/30e2fda6-bf21-4e54-9e50-831a2bcccd80.jpg)
/s3.amazonaws.com/arc-authors/morningstar/a90ba90e-1da2-48a4-98bf-a476620dbff0.jpg)
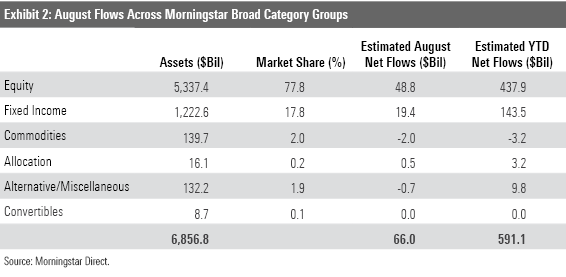
Exchange-traded funds built on their record year last month as they raked in a fresh $66 billion of new investor money. With two thirds of 2021 in the books, ETFs’ year-to-date haul clocked in at over $591 billion.
Global stock markets continued to advance despite uncertainty around the coronavirus delta variant. The Morningstar Global Markets Index--a broad gauge of global equities--added 2.5% in August, boosting its year-to-date return to 15.64%. That marked its seventh consecutive month in the black, its longest such streak since it notched 15 straight positive months from November 2016–January 2018. Bonds took a small step back, however, snapping a four-month winning streak of their own. After sliding 0.15% in August, the Morningstar US Core Bond Index has now lost 0.72% for the year to date.
Here, we’ll take a closer look at how the major asset classes performed last month, where investors put their money, and which corners of the market look rich and undervalued at month’s end--all through the lens of ETFs.
Stocks Don’t Waver
Exhibit 1 shows July returns for a sample of Morningstar Analyst-rated ETFs that serve as proxies for major asset classes. Investors in a blended global portfolio reaped a 1.23% return last month. Stocks returned to their role as the blended portfolio bellwether. Vanguard Total World Stock ETF VT, the portfolio’s stock tentpole, added 2.26%--its best monthly return since April. It picked up the slack for Vanguard Total Bond Market ETF BND and Vanguard Total International Bond ETF BNDX, which posted August losses of 0.19% and 0.43%, respectively.
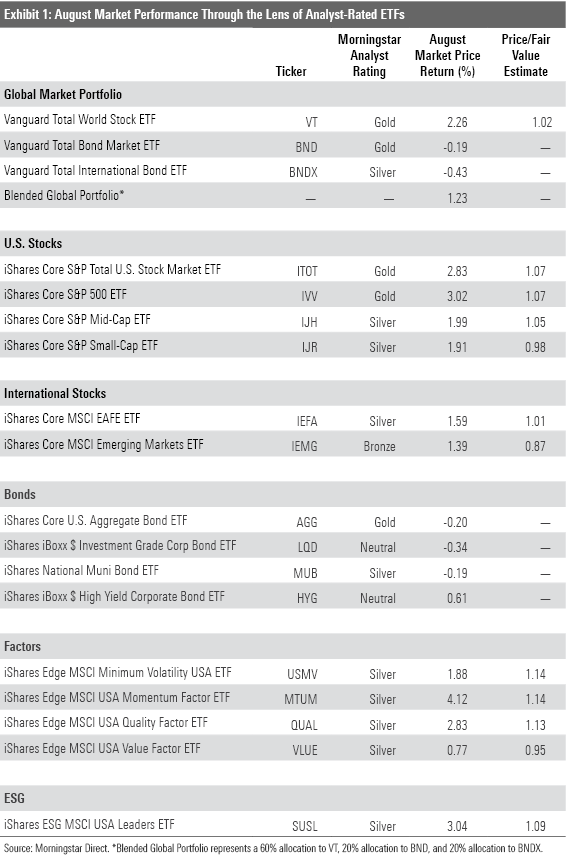
International stocks bounced back from a lackluster July to help VT’s cause. IShares MSCI ACWI ex US ETF ACWX advanced 1.45% after losing a similar amount the month prior. Much of the turnaround points to emerging-markets stocks, which steadied the ship and contributed solid performance last month. Indian stocks, in particular, went on a tear. The MSCI India Index jumped 10.94%--its best monthly showing since April 2020.
It was U.S. stocks that continued to set the pace, though, undeterred by the specter of a COVID-19 resurgence. At the end of August, the seven-day rolling average of U.S. reported cases had reached its highest level since January, according to the Centers for Disease Control and Prevention. Still, iShares Core S&P U.S. Total Stock Market ETF ITOT advanced 2.83% last month. Investors’ optimism may spring from increased vaccination rates--64% of U.S. adults had received full doses at the end of August--the Fed’s recent hints that interest-rate hikes remain distant on the horizon, or some combination of other factors. In any event, stocks have marched along; the Morningstar US Market Index’s 20.44% year-to-date gain is its best eight-month stretch to start a calendar year since 1997.
Large-cap U.S. stocks have led the charge most recently. IShares Core S&P 500 ETF IVV climbed 3.02% last month, while smaller sibling iShares Core S&P Small-Cap ETF IJR added 1.91%. The latter shot out of the 2021 gates--it outpaced IVV by about 13 percentage points over January and February--but the S&P 500 tracker has nearly closed the gap after several strong months. IVV’s 21.62% year-to-date return narrowly trailed IJR’s 22.85% gain at the end of August.
Growth and value stocks’ relative performance continued to parallel the large- versus small-cap relationship. Vanguard Growth ETF’s VUG added 3.67% in another stellar month, while Vanguard Value ETF VTV posted a 2.09% return. Many of the same economic factors that underpin large caps' and small caps’ relative returns likely influence the value-growth story. The cheaper sectors that VTV favors tend to be more sensitive to economic uncertainty. For example, the fund’s energy holdings like Exxon Mobil XOM and Chevron CVX slid about 4% apiece last month. Meanwhile, the tech titans that VUG favors tend to be more insulated from the economy’s currents. Companies like Microsoft MSFT and Apple AAPL emerged from the early 2020 drawdown relatively unscathed and have continued to trek ahead as economic uncertainty has resurfaced. VUG now has the year-to-date upper hand over VTV (21.45% gain versus 20.45%) after the latter carved a healthy advantage earlier this year.
That iShares MSCI USA Momentum Factor ETF MTUM led the iShares suite of single-factor strategic-beta ETFs last month seems to align with value-growth trends because it tends to favor faster-growing stocks. However, much of the momentum fund’s 4.12% August return owes to its hefty allocation to financials. Financials stocks tend to be more popular among value funds, but after MTUM’s growth-oriented stance stunted performance in late 2020 and early 2021, the fund raised its financials exposure to 32% from 2% at its May rebalance. MTUM’s pivot toward cheaper names has yielded mixed results as growth stocks have excelled, but it paid off in August, when financials stocks were the market’s top sector.
The broad U.S. market’s stellar run has precipitated rich valuations. ITOT traded at a 7% premium in August, as measured by Morningstar’s price/fair value estimate. It has hovered around that premium for most of the year. Investors may find more attractive value overseas, particularly in emerging-markets stocks. IShares Core MSCI Emerging Markets ETF IEMG traded 13% below its fair value in August--an even wider margin than the 11% discount it registered in July. That it looks even cheaper after a month of positive returns reflects increased analyst conviction in its underlying holdings.
Easy Does It
Stock ETFs continued a prolific year in August. After collecting another $50 billion last month, they have claimed about three fourths of all ETF flows for the year to date. Last year, equity ETFs accounted for 46% of flows.
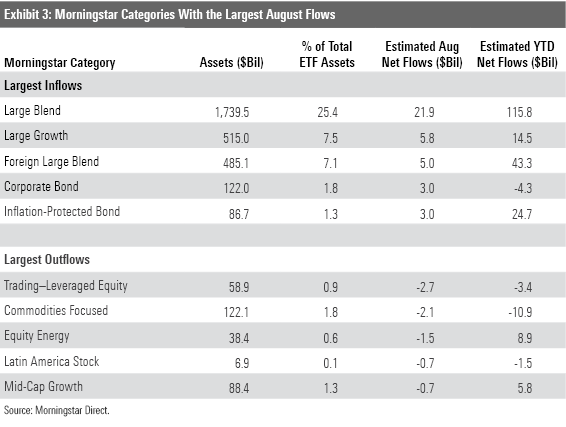
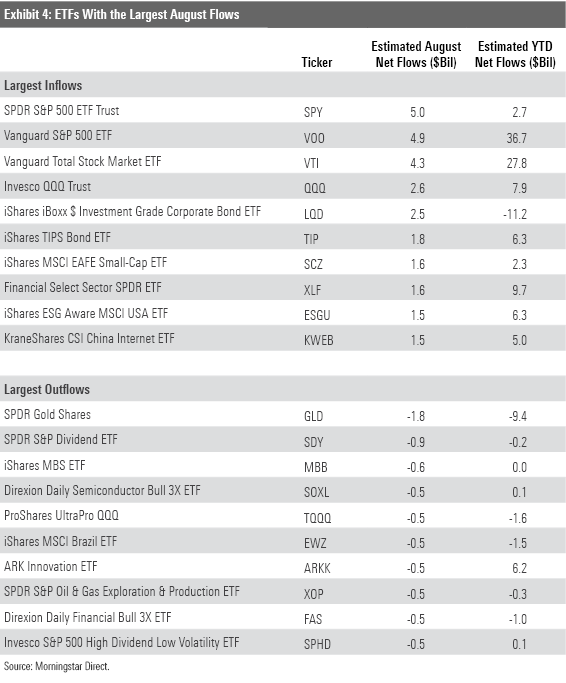
Growth ETFs’ solid performance over the past few months has been accompanied by solid inflows. U.S. large-, mid-, and small-cap growth ETFs collectively hauled in $5 billion last month--about double that of their value counterparts. They have now absorbed $17 billion in the past three months after adding only $3 billion from the start of the year through May. Invesco QQQ Trust QQQ--the tech-heavy Nasdaq-100 tracker and fifth-largest ETF on the market--once again led the way. It pulled in $2.5 billion last month, cranking its trailing three-month inflows to $9 billion. The flows pendulum has decidedly swung back to growth strategies after favoring value funds for the first half of 2021.
Funds that reside in the U.S. financials Morningstar Category collectively raked in $2.5 billion last month after bleeding the same amount in July. Despite last month’s stumble, financial stock ETFs have racked up the most inflows of all sector categories. The $21.5 billion they have taken in for the year to date more than doubles the nearest contender’s haul, technology funds’ $9.6 billion. Financial Select Sector SPDR ETF XLF has tallied $9.7 billion in flows alone--the eighth-most among all ETFs this year. Investors’ expectations for increased interest rates may explain this rush, as financial stocks tend to fare better in such environments. Investors could also be chasing performance. Financials were the second-best-performing sector from the start of the year through August. Real estate and energy stocks ranked first and third, and they have pulled in $7.9 billion and $8.9 billion, respectively.
While some investors have tried to tactically allocate their sector exposures, most have stuck to the script: low-cost, broadly diversified, market-cap-weighted index funds. Forty-four percent of all new money flowed into the U.S. large-blend category in August, led by a pair of S&P 500 trackers (SPDR S&P 500 ETF Trust SPY, Vanguard S&P 500 ETF VOO), and an even broader offering (Vanguard Total Stock Market ETF VTI). Vanguard's two-headed monster of VOO and VTI has been fixed atop the flows leaderboard; the tandem has jointly raked in $64.5 billion for the year to date. That tops the 2021 inflows of all Morningstar Categories, excluding the large-blend space in which they reside.
Bond ETFs notched another sound month of flows, pulling in about $19.4 billion of new investment. As their equity counterparts have made headlines, bond ETFs have quietly and consistently amassed strong flows of their own. Their monthly haul has ranged from $17 billion to $20 billion in each of the past five months. At their current rate, bond ETFs are on pace to narrowly eclipse the annual flows record they set in 2020.
While the Fed has maintained that recent inflation is transitory and rate hikes remain in the distant future, fixed-income ETF investors appear skeptical. Following a lucrative August, inflation-protected bond ETFs have now pulled in more than $10 billion over the past three months. Shorter-term bond ETFs have drawn in more money than longer-term options, which are subject to greater interest-rate risk. The U.S. intermediate- and short-term bond categories have each absorbed over $24 billion for the year to date, while the U.S long-term bond category has added only $400 million.
Vanguard Stays Streaking
Vanguard’s ETF lineup collected $23.7 billion last month. While that marked its lowest monthly inflows in 2021, it was enough to extend its streak atop the ETF provider flows league table to nine months. At the end of July, the firm’s $231.1 billion year-to-date haul more than doubled its nearest competitor, iShares ($119.8 billion).
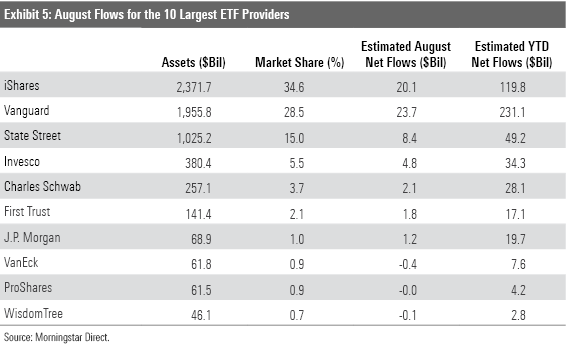
Despite leaking about $141 million last month, WisdomTree retained its tenuous spot on the list of the 10 largest ETF providers. It outlasted close competitor ARK Invest, which leaked about $1.1 billion last month as each ETF in its eight-fund lineup experienced outflows.
WisdomTree U.S. Quality Dividend Growth ETF DGRW led WisdomTree’s ETF lineup last month, but WisdomTree Emerging Markets ex-State-Owned Enterprises ETF XSOE has been the firm’s crown jewel this year, accounting for about half of the firm’s year-to-date inflows. This fund targets emerging-markets stocks but excludes all state-owned enterprises, allowing it to sidestep some of the unique governance risks that can plague emerging-markets strategies. It outstripped the MSCI Emerging Markets Index by 2.8 percentage points annually over the five years through August 2021.
Attractive Valuations Warrant a Second Look
The fair value estimate for ETFs rolls up our equity analysts' fair value estimates for individual stocks and our quantitative fair value estimates for stocks not covered by Morningstar analysts into an aggregate fair value estimate for stock ETF portfolios. Dividing this value by the ETFs' market prices yields the price/fair value ratio. This ratio can point to potential bargains and areas of the market where valuations are stretched.
The ”undervalued” half of Exhibit 6 shows funds that traded at the lowest price relative to their fair value at the end of July. This month’s edition features a unique combination of Chinese, energy, and cannabis funds.
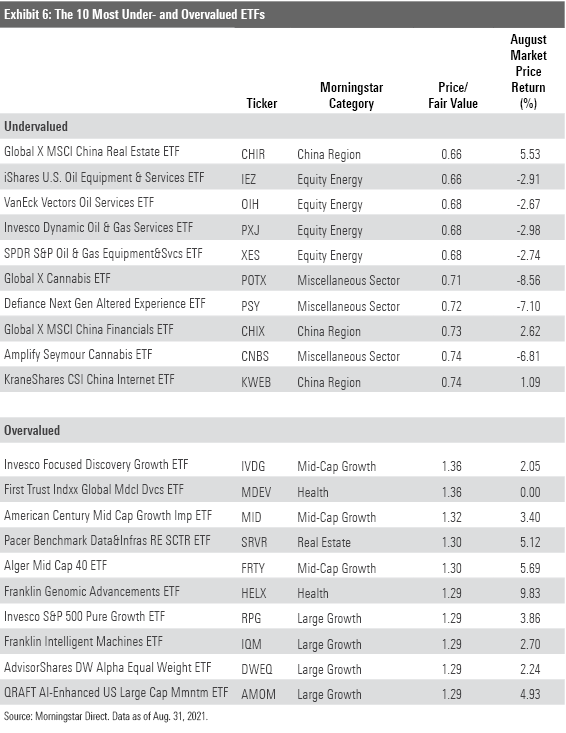
KraneShares CSI China Internet ETF KWEB, a 52-stock portfolio of Chinese Internet stocks, is an interesting constituent. In July, this fund spiraled after Beijing’s regulatory crackdown affected nearly all of the portfolio’s holdings, including top names Alibaba BABA and Tencent TCEHY. U.S. investors flocked to KWEB as it plummeted and have continued to even after it stabilized in August. After pulling $1.9 billion into the fund in July, it added another $1.5 billion last month. No other “undervalued” fund in Exhibit 6 experienced August flows of more than $120 million in either direction. While there is risk that this portfolio is chock-full of falling knives, following the money reveals investor confidence in a course reversal.
Investors hunting cheap valuations in a more diversified portfolio should likely keep their focus overseas. As Exhibit 7 shows, emerging-markets stock ETFs dominated the ranks of the cheapest broad-based option at the end of August. Most of these funds zero in on international stocks that look cheap relative to their dividends or other fundamental measures of value. The question becomes: Are these funds cheap enough to offer adequate returns for the risk they court?
For example, Schwab Fundamental Emerging Markets Large Company Index ETF’s FNDE value-centric, fundamental-weighting approach probably makes more sense in the U.S. market. It takes lofty stakes in stocks from the materials and energy sectors whose exposure to volatile commodity prices raises their risk. Additionally, state-owned enterprises are more prominent in this portfolio than in the MSCI Emerging Markets Index. The fund has trailed that benchmark by 1.26 percentage points annually since its inception, with about 15% more volatility. The stocks featured in some of these portfolios may be cheap but are not cheap enough to compensate them for their risk.
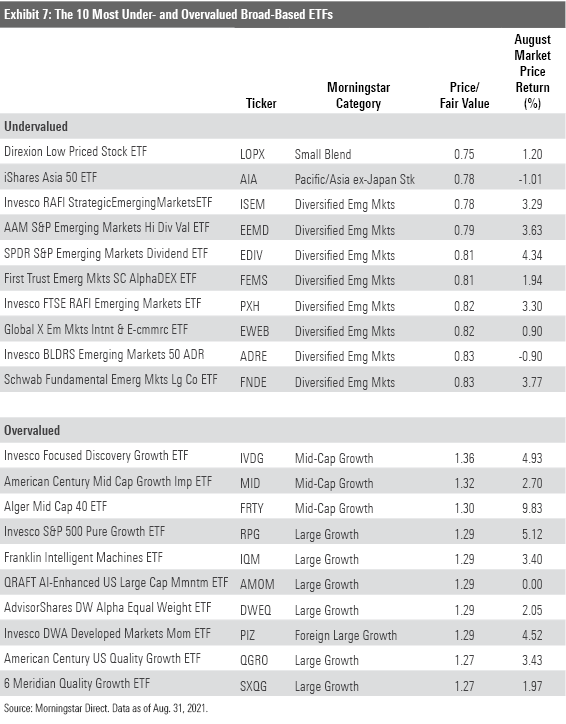
The pricier side of Exhibit 7 consists almost entirely of funds that invest in U.S. stocks. Invesco S&P 500 Pure Growth ETF RPG headlines the list. This fund steers decisively into fast-growing stocks, but that’s no guarantee it will outperform its large growth category index when growth is in favor. Indeed, it trailed the Russell 1000 Growth Index by over 4.5 percentage points annually over the five years through August 2021--a period characterized by growth stocks’ success. A smaller-than-average market-cap orientation held this strategy back, overshadowing its pronounced growth exposure. This underscores the importance of evaluating ETFs from all possible angles rather than trusting they will perform as they promise.
/d10o6nnig0wrdw.cloudfront.net/04-25-2024/t_29c382728cbc4bf2aaef646d1589a188_name_file_960x540_1600_v4_.jpg)
/cloudfront-us-east-1.images.arcpublishing.com/morningstar/24UPFK5OBNANLM2B55TIWIK2S4.png)
/cloudfront-us-east-1.images.arcpublishing.com/morningstar/T2LGZCEHBZBJJPPKHO7Y4EEKSM.png)
:quality(80)/s3.amazonaws.com/arc-authors/morningstar/30e2fda6-bf21-4e54-9e50-831a2bcccd80.jpg)
:quality(80)/s3.amazonaws.com/arc-authors/morningstar/a90ba90e-1da2-48a4-98bf-a476620dbff0.jpg)