
How Investors Can Take Advantage of the 5% Interest-Rate Reset
Understanding the risks and opportunities in the new landscape.
/s3.amazonaws.com/arc-authors/morningstar/dc89b57e-a12e-4246-96ca-b598517b15f4.jpg)
/s3.amazonaws.com/arc-authors/morningstar/d70ff945-8520-4b27-9d10-eb509531f5aa.jpg)

It is no secret that the income landscape has changed.
- Interest rates have increased from practically zero across the developed world (even negative in some cases) and have broadly reset at the 4.0%-5.5% level, depending on the country.
- Bond yields have anticipated these rises and increased, too, with 4%-5% yields generally available across the curve.
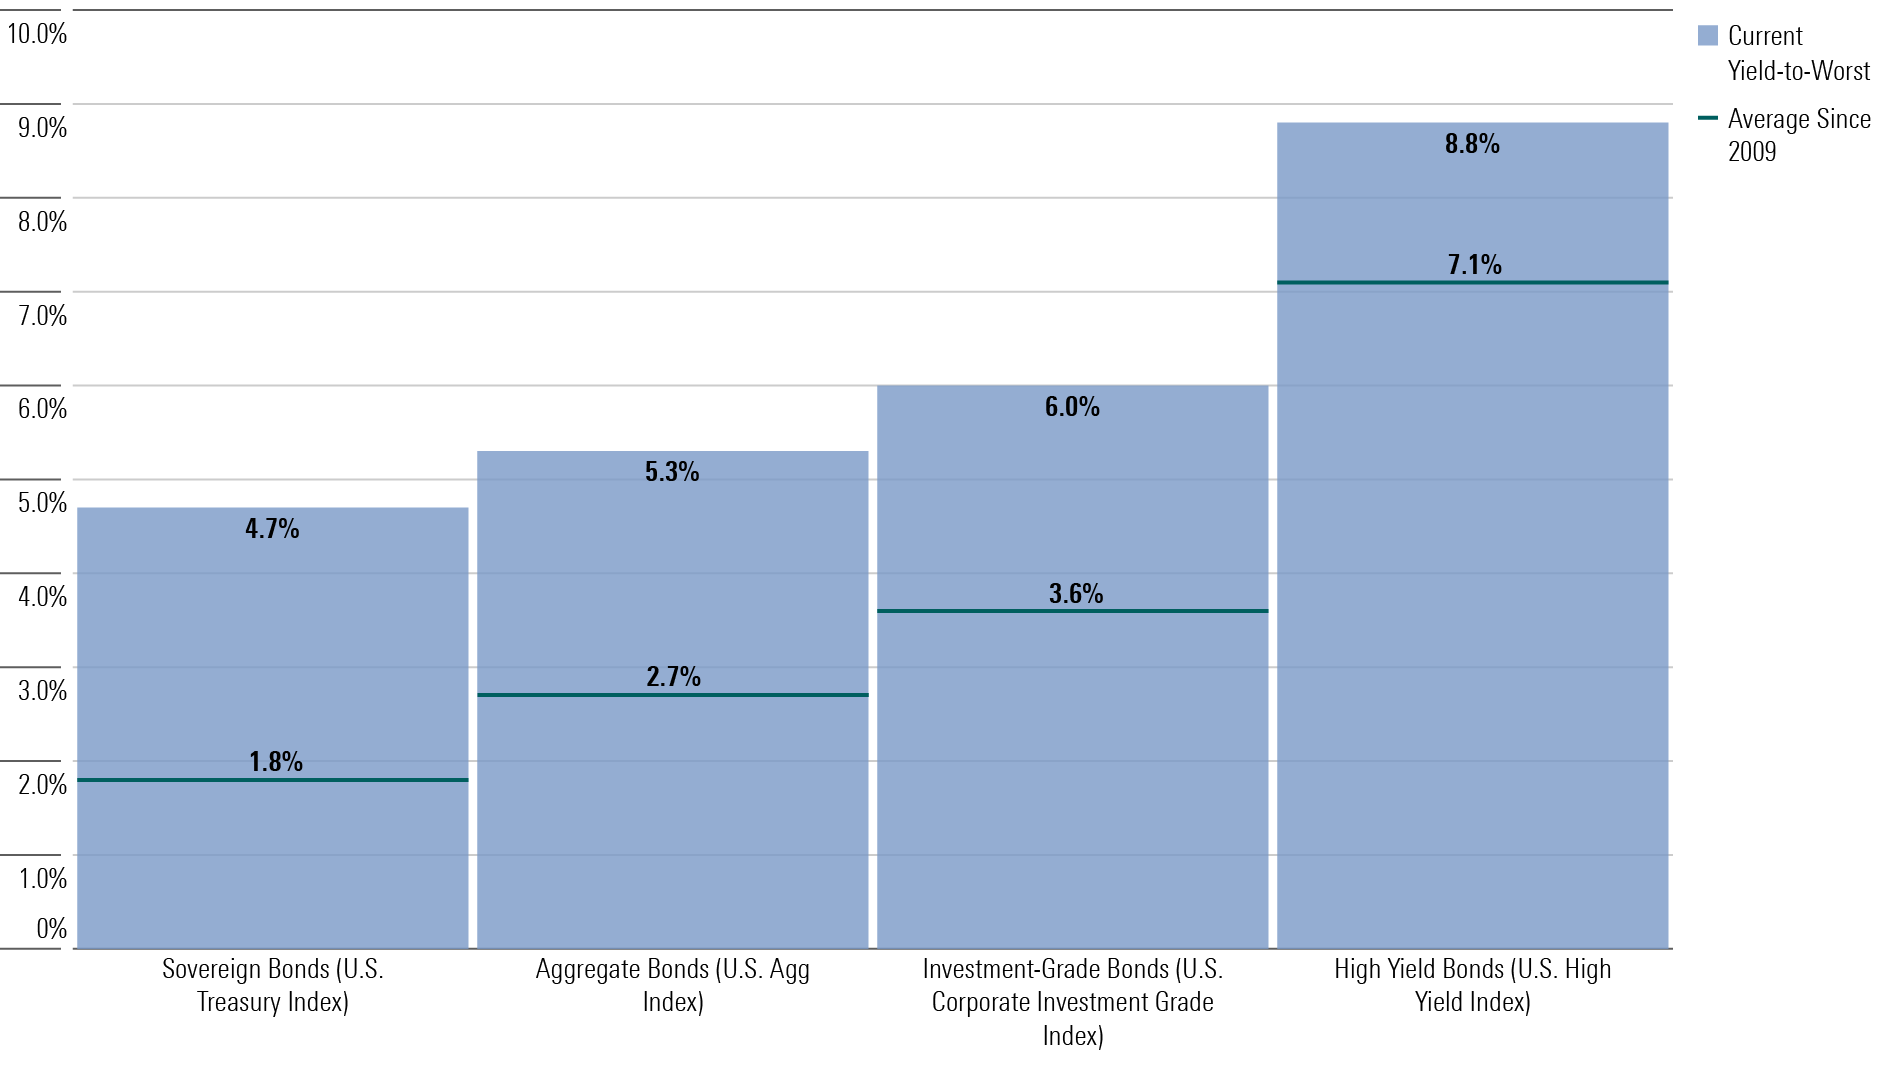
- Riskier bonds, like high yield, have increased from as low as 4% in 2022 to around 9% today.
- Meanwhile, dividend yields have hardly budged and are now materially lower than yields available in fixed income for most sectors and geographies.
Let’s kick off with the large-scale reset in interest rates we’ve witnessed lately. Drifting up from their historical decade-lows, rates are now near the 5% mark, ushering in a significantly different “base rate” to consider for all asset-class views. This shift has upended the investing landscape as we knew it, with opportunities and risks worth delving into.
We have a specific focus on income-producing assets, with their yields undergoing noticeable changes. Yet, the reset in interest rates hasn’t come without risks. We’ve seen significant price falls in asset classes that were historically considered “low-risk” by textbook definitions—including the Morningstar US 10+ Year Treasury Bond Index, which declined 41.7% from July 31, 2020, to Nov. 15, 2023.
As advocates for independent thinking, we see opportunities being created from these moves. It’s worth noting that these transformations continue to carry certain risks.
Yields Available Are Better Across the Board, With Areas of Attraction
As we delve into the world of income-producing assets, the noteworthy shift in base rates has greatly affected the investment case. Navigating this shift can yield fruitful results if we understand how to utilize the fluctuations to our advantage, while also being wary of the potential risks involved.
Central to this discussion is the major increase in headline yields available across various income-producing assets. However, it’s important to note that some asset classes shine brighter than others.
Bond Yields Are Very Attractive Relative to Recent History
The beauty of the current investing landscape also lies in the wide array of options, which can be matched to the mandate of a portfolio. For example, if you have a short time horizon, we see opportunities at the shorter end of the yield curve for the first time in decades. For those with a longer time horizon, we can express our views across the shape of the yield curve to get the right balance.
As we navigate these shifts, we’ve reevaluated the broad equity and fixed-income allocations within income portfolios, with a move out of equities and into bonds. This is mostly a shift in allocating capital to areas offering higher yields. Within bonds, we like short-dated bonds, given the inversion we see across most developed curves, although we do see growing appeal in longer-maturity bonds.
For investors prioritizing stability, dividends are another area to consider. However, we have not seen the same uptick in dividend yields as we’ve seen in fixed-income yields.
For example, the yield on the Morningstar US Core Bond Index has risen to 5.4% from 1.2% between November 2020 and November 2023. Meanwhile, the dividend yield of the Morningstar US Market Index has risen just 0.3%, to 1.5% from 1.2% over the same period.
In the realm of dividend-paying stocks, areas offering attractive dividends are financials, U.K. equities, master-limited partnerships, and infrastructure.
Finally, the reset in base rates has brought into question the changing merits of a 60/40 portfolio (60% in stocks, 40% in bonds, or equivalent mixes), which we believe are likely overstated. In our view, the merit of a 60/40 portfolio has improved following the increase in yields.
Positive Views of Income-Producing Asset Classes
How can investors take advantage of the reshaping of the income and interest-rate landscape? The shape of the yield curve and regional differences must be tackled in this context, as they are integral to understanding the opportunity set.
- Short-dated bonds generally represent a great starting point by yielding above fair value, rendering them a compelling investment choice. This applies across sovereign and corporates, with more companies borrowing for shorter periods.
- As a safety net against potential market uncertainties, longer-dated government bonds, such as U.S. Treasuries, are expected to offer an effective hedge in most macroeconomic scenarios.
- Dividend stocks maintain their position as a feasible option for investors, though their appeal is somewhat muted owing to the relative attraction of bond yields.
- Emerging-markets bonds appeal to us as a noncore opportunity. Our enthusiasm toward these bonds remains, although it has been modestly tempered by the marked shift in other opportunities. Specifically, the allure of developed-markets bonds has prompted us to moderate our favorable outlook for emerging-markets bonds.
- Cash is now a tool to be considered, although we don’t expect it to play much of a role for long-term investors, given the likelihood of bond and equity outperformance.
The shape of the yield curve is an important consideration. Despite the “higher for longer” narrative, we still see an inverted yield curve, where we can capture higher yields for bonds that mature in the short term, while those that mature in 10-plus years continue to be less attractive.
We must reinforce the positive case for bonds—both short and long duration—with their yields now above fair value for the first time since the global financial crisis. That said, an inverted yield curve can be a sign of recessionary preconditions, with longer-dated bonds expected to provide a necessary hedge.
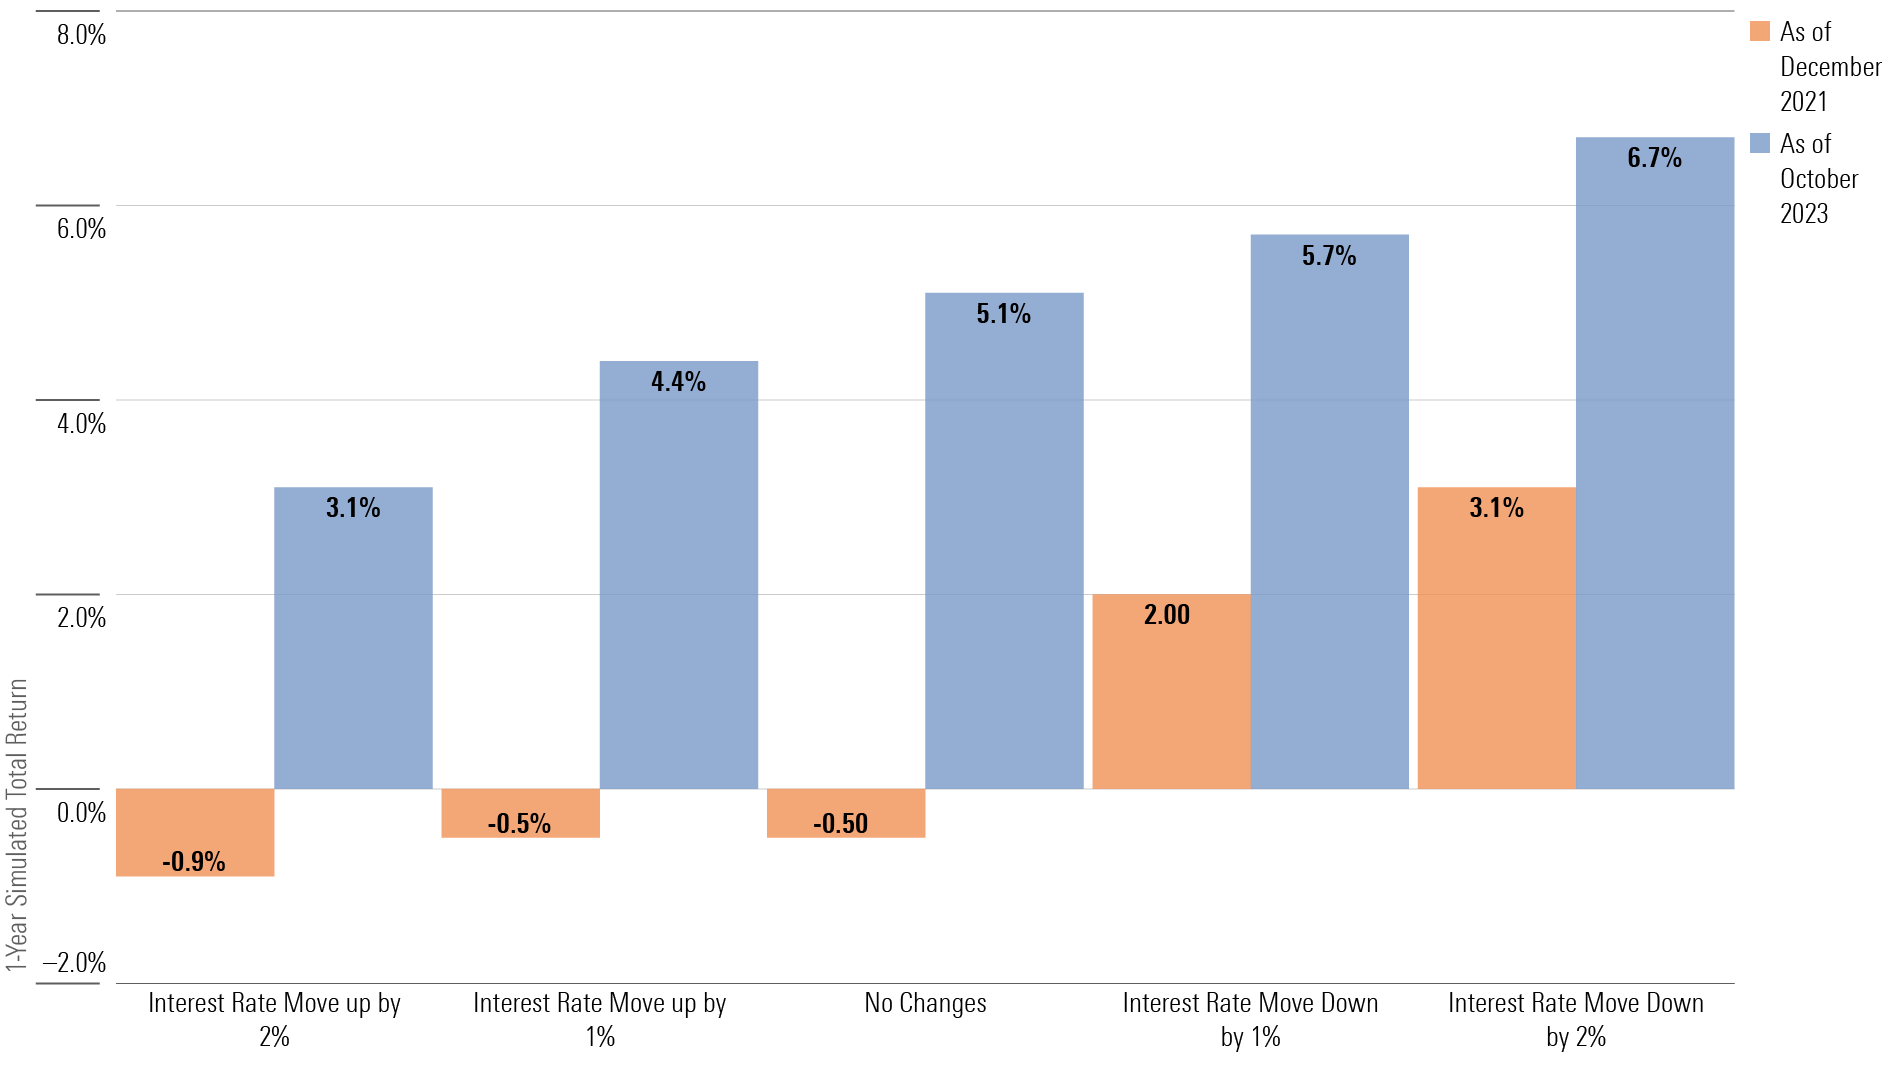
Bond Math Is Favorable
One effective way of thinking about the shape of the yield curve is to focus on the bond math, where we can see the expected gain in different scenarios and how the range of outcomes has shifted.
1-Year Simulated Total Return Across Interest-Rate Scenarios
Areas that warrant a dose of caution:
- Credit spreads: We perceive corporate bonds as only providing a slight increment in extra yield. Although this might seem lucrative, it is tempered versus government bonds.
- High-yield debt: Related to the above, it may be tempting to think 9%-plus yields are attractive. However, despite offering high absolute yields, we caution against the inherent risks tied to these assets. The lure of high returns should always be weighed against a potential default cycle, which is not reflected in spreads.
- Dividend-chasing: For investors who utilize rules-based vehicles such as active exchange-traded funds to access high-dividend names, many dividend indexes can experience big shifts in sector composition. Investors need to be mindful of the sector exposure that they are getting. Moreover, while dividends remain a key area to explore—and we express this in our portfolios—we note that dividend instability could potentially pose a risk to income investors. Sectors such as energy and financials are more prone to dividend cuts during downturns.
As we look toward next year, it is important to remain adaptable and open to adjusting investment views by embracing the evolving landscape and harnessing income-producing assets where sensible.
What Risks Are Introduced From 5%-Plus Rates?
There are plenty of available investment strategies you can employ to navigate these risks and boost the overall return prospects of a portfolio. However, every decision should factor in risk.
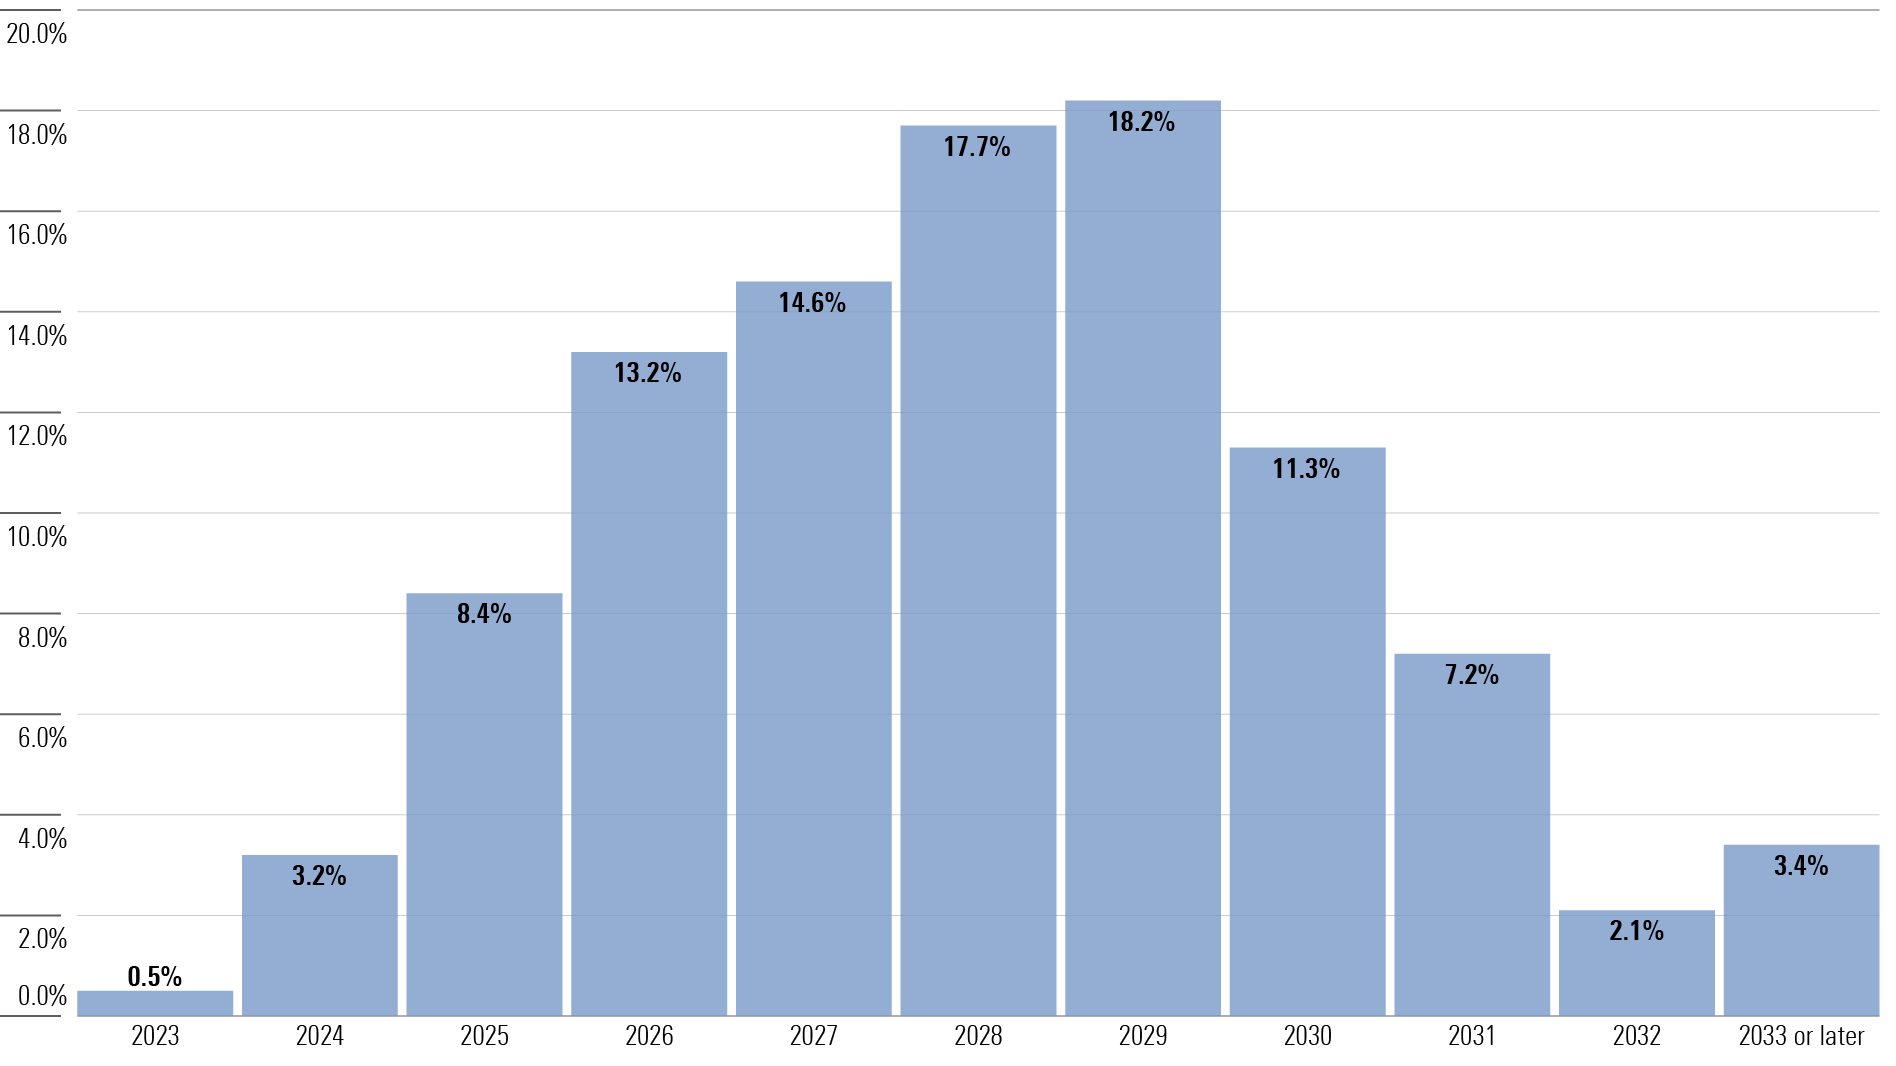
The first risk that we must weigh is the increase in bond supply—especially a U.S. Treasury maturity wall—which can significantly affect the market by amplifying the volume of bonds. The U.S. Treasury Department has confirmed the need to borrow more than $800 billion in the first quarter of 2024, which could test the appetite of investors. All else being equal, this could result in higher yields.
For corporate bonds—whether investment-grade or high-yield—one obvious risk is a deterioration in company fundamentals. This will often show first among high-yield bonds, where we are seeing early signs of strain—albeit from a historically low base. It is worth noting that high-yield bond issuance is not expected to materially increase in 2024, with most of the debt due to mature in the 2026 to 2029 window. The credit quality has also improved for high-yield bonds, so they are arguably better positioned than in prior periods of deteriorating fundamentals. We identify three areas regarding impairment:
- Revenue and earnings growth are now declining.
- Leverage ratios have increased, although they remain well within historical norms.
- Interest coverage has edged lower from strong levels, meaning companies may find themselves struggling to make repayments.
However, it is worth repeating that we see corporate fundamentals as reasonable and see no immediate risks of a significant rise in defaults.
No Signs of a Debt Cliff
Another risk is inflation could go higher. This is not our base case, but it is worth protecting against, and inflation-linked bonds are a relatively cheap insurance option at current breakeven levels.
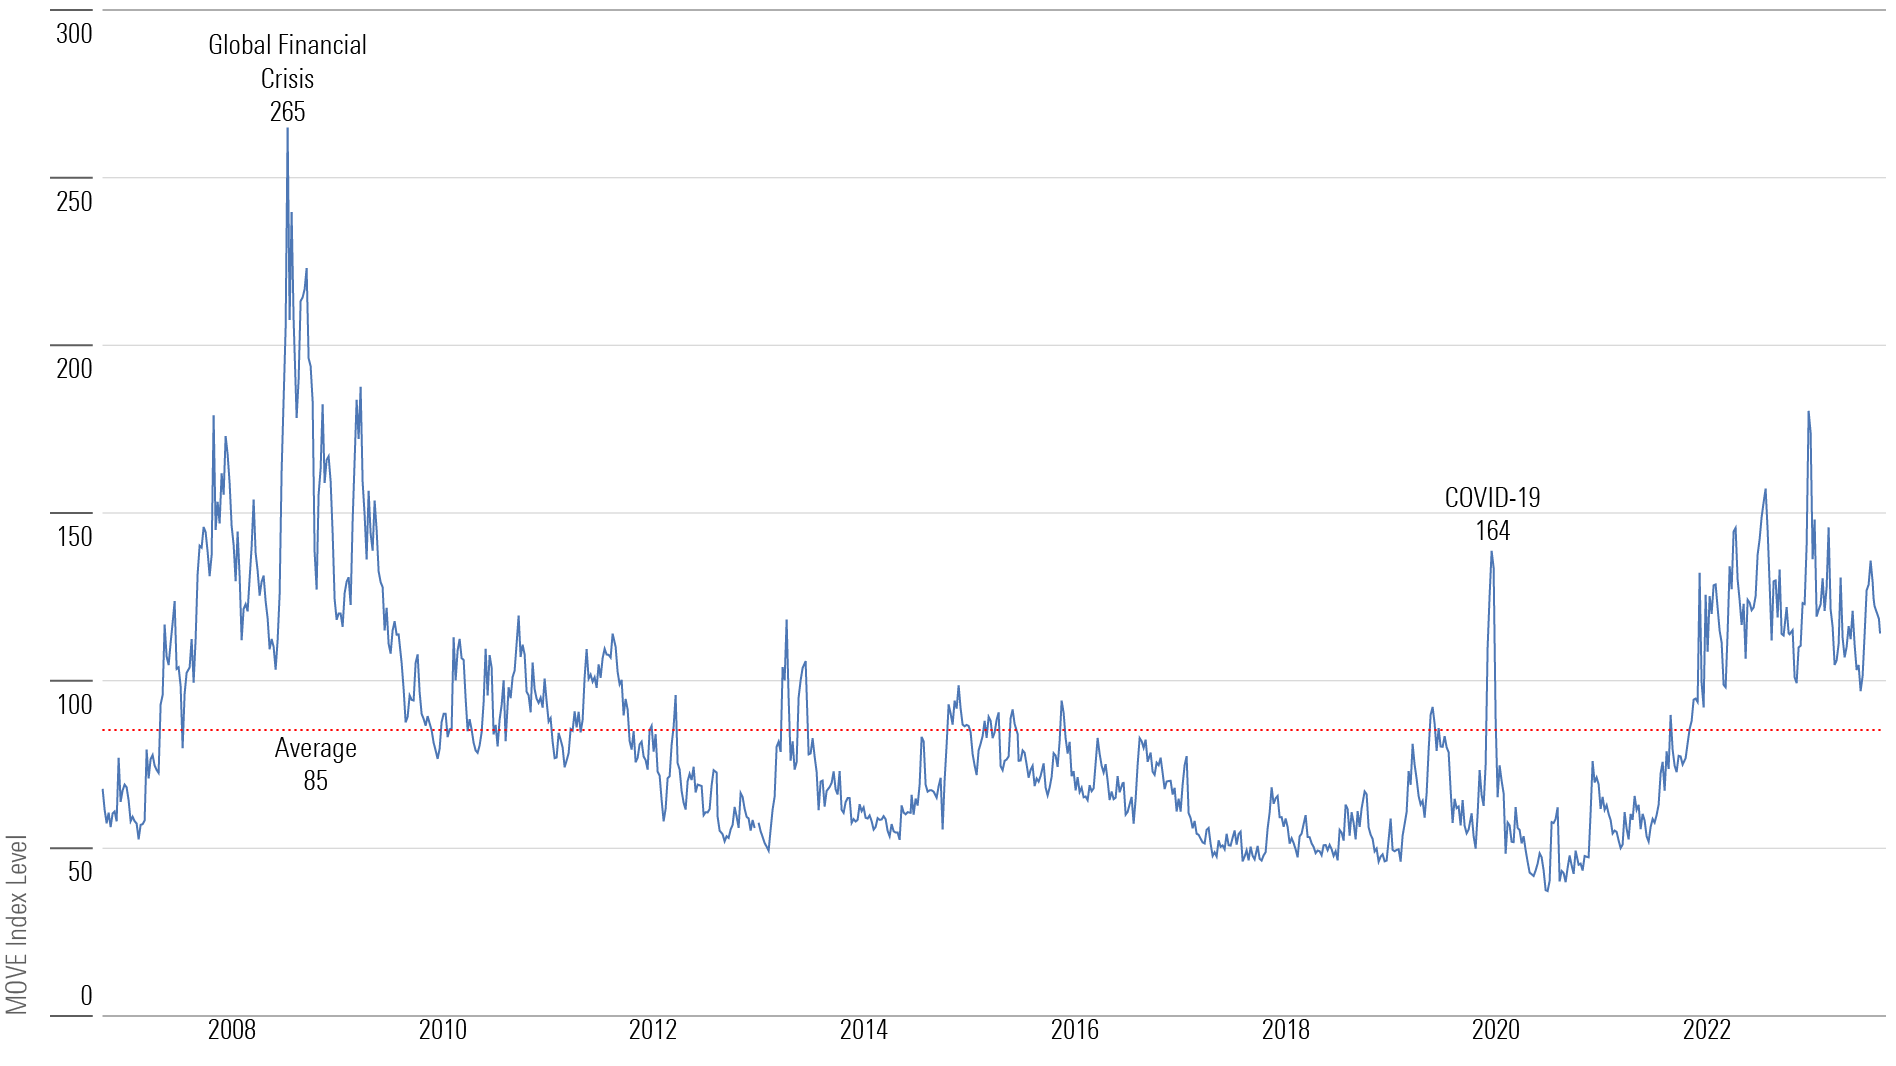
More generally, we’ve seen a major uptick in bond volatility, especially in long-term bonds, as there is a heightened sense of uncertainty for investors. This does not necessarily pose a risk of impairment, but it could affect investors’ behavior.
Bond Market Volatility Remains Elevated, Which May Make Some Investors Feel Uneasy
On the flip side, a continued duration rally is possible if rates fall quickly—perhaps in a deep recession, characterized by a drop in interest rates—which can negatively influence the relative performance of short-dated bonds. In this scenario, short-dated bonds may not experience the same level of increase as their longer-term counterparts. This creates reinvestment risk—the risk that a bond matures after rates fall and investors need to reinvest the proceeds at lower rates—for short-dated bonds.
An Uplift for Newly Invested Money
It is important to understand that the majority of the positivity in income-producing assets comes from price moves, not rises in dividends or new bond issuance. However, for all future money invested, you’ll access better yields along with a gradual improvement from new issuance.
The potential for higher yields exists across the entire opportunity set, which is an exciting prospect indeed. However, amid the allure of stability in dividends, we must also consider the risk of dividend cuts in certain sectors and the need to watch for a potential credit default cycle.
Morningstar Investment Management LLC is a Registered Investment Advisor and subsidiary of Morningstar, Inc. The Morningstar name and logo are registered marks of Morningstar, Inc. Opinions expressed are as of the date indicated; such opinions are subject to change without notice. Morningstar Investment Management and its affiliates shall not be responsible for any trading decisions, damages, or other losses resulting from, or related to, the information, data, analyses, or opinions or their use. This commentary is for informational purposes only. The information data, analyses, and opinions presented herein do not constitute investment advice, are provided solely for informational purposes and therefore are not an offer to buy or sell a security. Before making any investment decision, please consider consulting a financial or tax professional regarding your unique situation.
The author or authors do not own shares in any securities mentioned in this article. Find out about Morningstar’s editorial policies.
Morningstar Investment Management LLC is a Registered Investment Advisor and subsidiary of Morningstar, Inc. The Morningstar name and logo are registered marks of Morningstar, Inc. Opinions expressed are as of the date indicated; such opinions are subject to change without notice. Morningstar Investment Management and its affiliates shall not be responsible for any trading decisions, damages, or other losses resulting from, or related to, the information, data, analyses or opinions or their use. This commentary is for informational purposes only. The information data, analyses, and opinions presented herein do not constitute investment advice, are provided solely for informational purposes and therefore are not an offer to buy or sell a security. Before making any investment decision, please consider consulting a financial or tax professional regarding your unique situation.
/cloudfront-us-east-1.images.arcpublishing.com/morningstar/MQJKJ522P5CVPNC75GULVF7UCE.jpg)
/cloudfront-us-east-1.images.arcpublishing.com/morningstar/ZYJVMA34ANHZZDT5KOPPUVFLPE.png)
/cloudfront-us-east-1.images.arcpublishing.com/morningstar/S7NJ3ZTJORFVLCRFS2S4LRN3QE.png)
:quality(80)/s3.amazonaws.com/arc-authors/morningstar/dc89b57e-a12e-4246-96ca-b598517b15f4.jpg)
:quality(80)/s3.amazonaws.com/arc-authors/morningstar/d70ff945-8520-4b27-9d10-eb509531f5aa.jpg)